|
JKQTPlotter trunk/v5.0.0
an extensive Qt5+Qt6 Plotter framework (including a feature-richt plotter widget, a speed-optimized, but limited variant and a LaTeX equation renderer!), written fully in C/C++ and without external dependencies
|
|
JKQTPlotter trunk/v5.0.0
an extensive Qt5+Qt6 Plotter framework (including a feature-richt plotter widget, a speed-optimized, but limited variant and a LaTeX equation renderer!), written fully in C/C++ and without external dependencies
|
Functions | |
| template<class InputCatIt, class InputValueIt, class TGraph> | |
| TGraph * | jkqtpstatAddBoxplots (JKQTBasePlotter *plotter, InputCatIt inFirstCat_Y, InputCatIt inLastCat_Y, InputValueIt inFirstValue_Y, InputValueIt inLastValue_Y, double quantile1Spec=0.25, double quantile2Spec=0.75, double minimumQuantile=0, double maximumQuantile=1.0, JKQTPStatGroupDefinitionFunctor1D groupDefFunc=&jkqtpstatGroupingIdentity1D, const QString &columnBaseName=QString("grouped boxplot data")) |
create horizontal boxplots of type TGraph, from the 5-value-summary of groups in the input data | |
| template<class InputIt> | |
| JKQTPBoxplotHorizontalElement * | jkqtpstatAddHBoxplot (JKQTBasePlotter *plotter, InputIt first, InputIt last, double boxposY, double quantile1Spec=0.25, double quantile2Spec=0.75, double minimumQuantile=0, double maximumQuantile=1.0, JKQTPStat5NumberStatistics *statOutput=nullptr) |
| add a JKQTPBoxplotHorizontalElement to the given plotter, where the boxplot values are calculated from the data range first ... last | |
| template<class InputIt> | |
| std::pair< JKQTPBoxplotHorizontalElement *, JKQTPSingleColumnSymbolsGraph * > | jkqtpstatAddHBoxplotAndOutliers (JKQTBasePlotter *plotter, InputIt first, InputIt last, double boxposY, double quantile1Spec=0.25, double quantile2Spec=0.75, double minimumQuantile=0.03, double maximumQuantile=0.97, const QString &outliercolumnBaseName=QString("boxplot"), JKQTPStat5NumberStatistics *statOutput=nullptr) |
| add a JKQTPBoxplotHorizontalElement and a JKQTPSingleColumnSymbolsGraph for outliers to the given plotter, where the boxplot values are calculated from the data range first ... last | |
| template<class InputCatIt, class InputValueIt> | |
| std::pair< JKQTPBoxplotHorizontalGraph *, JKQTPXYLineGraph * > | jkqtpstatAddHBoxplotsAndOutliers (JKQTBasePlotter *plotter, InputCatIt inFirstCat_Y, InputCatIt inLastCat_Y, InputValueIt inFirstValue_X, InputValueIt inLastValue_X, double quantile1Spec=0.25, double quantile2Spec=0.75, double minimumQuantile=0.03, double maximumQuantile=0.97, JKQTPStatGroupDefinitionFunctor1D groupDefFunc=&jkqtpstatGroupingIdentity1D, const QString &columnBaseName=QString("grouped boxplot data")) |
create vertical boxplots of type JKQTPBoxplotHorizontalGraph, from the 5-value-summary of groups in the input data, also adds a graph showing the outliers | |
| template<class InputIt, class BinsInputIt> | |
| JKQTPBarVerticalGraph * | jkqtpstatAddHHistogram1D (JKQTBasePlotter *plotter, InputIt first, InputIt last, BinsInputIt binsFirst, BinsInputIt binsLast, bool normalized=true, bool cummulative=false, const QString &histogramcolumnBaseName=QString("histogram")) |
| calculate an autoranged histogram and add a JKQTPBarVerticalGraph to the given plotter, where the histogram is calculated from the data range first ... last, bins defined by their width | |
| template<class InputIt> | |
| JKQTPBarVerticalGraph * | jkqtpstatAddHHistogram1DAutoranged (JKQTBasePlotter *plotter, InputIt first, InputIt last, double binWidth, bool normalized=true, bool cummulative=false, const QString &histogramcolumnBaseName=QString("histogram")) |
| calculate an autoranged histogram and add a JKQTPBarVerticalGraph to the given plotter, where the histogram is calculated from the data range first ... last, bins defined by their width | |
| template<class InputIt> | |
| JKQTPBarVerticalGraph * | jkqtpstatAddHHistogram1DAutoranged (JKQTBasePlotter *plotter, InputIt first, InputIt last, int bins=11, bool normalized=true, bool cummulative=false, const QString &histogramcolumnBaseName=QString("histogram")) |
| calculate an autoranged histogram and add a JKQTPBarVerticalGraph to the given plotter, where the histogram is calculated from the data range first ... last, bins defined by their number | |
| template<class InputItX, class InputItY> | |
| JKQTPColumnContourPlot * | jkqtpstatAddHistogram2DContour (JKQTBasePlotter *plotter, InputItX firstX, InputItX lastX, InputItY firstY, InputItY lastY, double xbinwidth, double ybinwidth, bool normalized=true, const QString &histogramcolumnBaseName=QString("histogram"), double *oxmin=nullptr, double *oxmax=nullptr, double *oymin=nullptr, double *oymax=nullptr) |
| calculate calculate a 2-dimensional histogram and add a JKQTPColumnContourPlot to the given plotter, where the histogram is calculated from the given data range firstX / firstY ... lastY / lastY | |
| template<class InputItX, class InputItY> | |
| JKQTPColumnContourPlot * | jkqtpstatAddHistogram2DContour (JKQTBasePlotter *plotter, InputItX firstX, InputItX lastX, InputItY firstY, InputItY lastY, size_t xbins=10, size_t ybins=10, bool normalized=true, const QString &histogramcolumnBaseName=QString("histogram"), double *oxmin=nullptr, double *oxmax=nullptr, double *oymin=nullptr, double *oymax=nullptr) |
| calculate calculate a 2-dimensional histogram and add a JKQTPColumnContourPlot to the given plotter, where the histogram is calculated from the given data range firstX / firstY ... lastY / lastY | |
| template<class InputItX, class InputItY> | |
| JKQTPColumnMathImage * | jkqtpstatAddHistogram2DImage (JKQTBasePlotter *plotter, InputItX firstX, InputItX lastX, InputItY firstY, InputItY lastY, double xbinwidth, double ybinwidth, bool normalized=true, const QString &histogramcolumnBaseName=QString("histogram"), double *oxmin=nullptr, double *oxmax=nullptr, double *oymin=nullptr, double *oymax=nullptr) |
| calculate calculate a 2-dimensional histogram and add a JKQTPColumnMathImage to the given plotter, where the histogram is calculated from the given data range firstX / firstY ... lastY / lastY | |
| template<class InputItX, class InputItY> | |
| JKQTPColumnMathImage * | jkqtpstatAddHistogram2DImage (JKQTBasePlotter *plotter, InputItX firstX, InputItX lastX, InputItY firstY, InputItY lastY, size_t xbins=10, size_t ybins=10, bool normalized=true, const QString &histogramcolumnBaseName=QString("histogram"), double *oxmin=nullptr, double *oxmax=nullptr, double *oymin=nullptr, double *oymax=nullptr) |
| calculate calculate a 2-dimensional histogram and add a JKQTPColumnMathImage to the given plotter, where the histogram is calculated from the given data range firstX / firstY ... lastY / lastY | |
| template<class InputIt, class BinsInputIt> | |
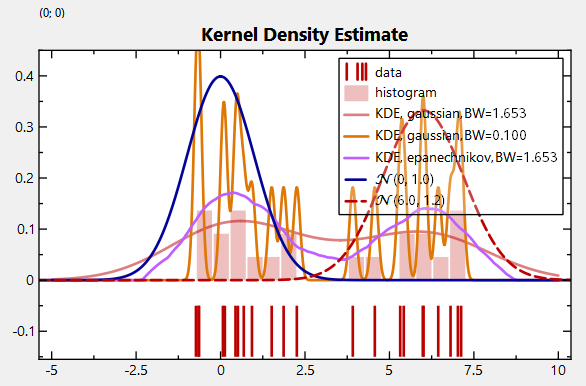
| JKQTPXYLineGraph * | jkqtpstatAddHKDE1D (JKQTBasePlotter *plotter, InputIt first, InputIt last, BinsInputIt binsFirst, BinsInputIt binsLast, const std::function< double(double)> &kernel=std::function< double(double)>(&jkqtpstatKernel1DGaussian), double bandwidth=1.0, bool cummulative=false, const QString &KDEcolumnBaseName=QString("KDE")) |
| calculate an autoranged KDE and add a JKQTPXYLineGraph to the given plotter, where the KDE is calculated from the data range first ... last, bins defined by their width | |
| template<class InputIt> | |
| JKQTPXYLineGraph * | jkqtpstatAddHKDE1D (JKQTBasePlotter *plotter, InputIt first, InputIt last, double binXLeft, double binXDelta, double binXRight, const std::function< double(double)> &kernel=std::function< double(double)>(&jkqtpstatKernel1DGaussian), double bandwidth=1.0, bool cummulative=false, const QString &KDEcolumnBaseName=QString("KDE")) |
| calculate an autoranged KDE and add a JKQTPXYLineGraph to the given plotter, where the KDE is calculated from the data range first ... last, evaluation positions are given by the range binXLeft ... binXRight (in steps of binxDelta ) | |
| template<class InputIt> | |
| JKQTPXYLineGraph * | jkqtpstatAddHKDE1DAutoranged (JKQTBasePlotter *plotter, InputIt first, InputIt last, double binWidth, const std::function< double(double)> &kernel=std::function< double(double)>(&jkqtpstatKernel1DGaussian), double bandwidth=1.0, bool cummulative=false, const QString &KDEcolumnBaseName=QString("KDE")) |
| calculate an autoranged KDE and add a JKQTPXYLineGraph to the given plotter, where the KDE is calculated from the data range first ... last, bins defined by their width | |
| template<class InputIt> | |
| JKQTPXYLineGraph * | jkqtpstatAddHKDE1DAutoranged (JKQTBasePlotter *plotter, InputIt first, InputIt last, int Nout=100, const std::function< double(double)> &kernel=std::function< double(double)>(&jkqtpstatKernel1DGaussian), double bandwidth=1.0, bool cummulative=false, const QString &KDEcolumnBaseName=QString("KDE")) |
| calculate an autoranged KDE and add a JKQTPXYLineGraph to the given plotter, where the KDE is calculated from the data range first ... last, bins defined by their number | |
| template<class InputIt> | |
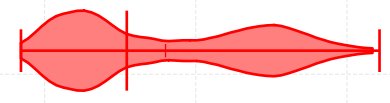
| JKQTPViolinplotHorizontalElement * | jkqtpstatAddHViolinplotHistogram (JKQTBasePlotter *plotter, InputIt first, InputIt last, double violinposY, const QString &distBasename=QString("violin plot distribution"), int violinDistSamples=21) |
| add a JKQTPViolinplotHorizontalElement to the given plotter, where the Violinplot values are calculated from the data range first ... last , uses a histogram as density distribution estimate | |
| template<class InputIt> | |
| std::pair< JKQTPViolinplotHorizontalElement *, JKQTPSingleColumnSymbolsGraph * > | jkqtpstatAddHViolinplotHistogramAndOutliers (JKQTBasePlotter *plotter, InputIt first, InputIt last, double violinposY, double minimumQuantile=0.03, double maximumQuantile=0.97, const QString &distBasename=QString("violin plot distribution"), int violinDistSamples=21) |
| add a JKQTPViolinplotHorizontalElement and an outliers graph to the given plotter, where the Violinplot values are calculated from the data range first ... last , uses a histogram as density distribution estimate | |
| template<class InputIt> | |
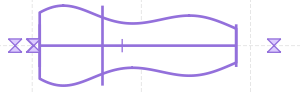
| JKQTPViolinplotHorizontalElement * | jkqtpstatAddHViolinplotKDE (JKQTBasePlotter *plotter, InputIt first, InputIt last, double violinposY, const std::function< double(double)> &kernel=std::function< double(double)>(&jkqtpstatKernel1DGaussian), double bandwidth=-1, const QString &distBasename=QString("violin plot distribution"), int violinDistSamples=100) |
| add a JKQTPViolinplotHorizontalElement to the given plotter, where the Violinplot values are calculated from the data range first ... last , uses a kernel density estimate as density distribution estimate | |
| template<class InputIt> | |
| std::pair< JKQTPViolinplotHorizontalElement *, JKQTPSingleColumnSymbolsGraph * > | jkqtpstatAddHViolinplotKDEAndOutliers (JKQTBasePlotter *plotter, InputIt first, InputIt last, double violinposY, const std::function< double(double)> &kernel=std::function< double(double)>(&jkqtpstatKernel1DGaussian), double bandwidth=-1, double minimumQuantile=0.03, double maximumQuantile=0.97, const QString &distBasename=QString("violin plot distribution"), int violinDistSamples=100) |
| add a JKQTPViolinplotHorizontalElement and an outliers graph to the given plotter, where the Violinplot values are calculated from the data range first ... last , uses a kernel density estimate as density distribution estimate | |
| template<class InputItX, class InputItY> | |
| JKQTPColumnContourPlot * | jkqtpstatAddKDE2DContour (JKQTBasePlotter *plotter, InputItX firstX, InputItX lastX, InputItY firstY, InputItY lastY, size_t xbins=10, size_t ybins=10, const std::function< double(double, double)> &kernel=std::function< double(double, double)>(&jkqtpstatKernel2DGaussian), double bandwidthX=1.0, double bandwidthY=1.0, const QString &kdecolumnBaseName=QString("histogram"), double *oxmin=nullptr, double *oxmax=nullptr, double *oymin=nullptr, double *oymax=nullptr) |
| calculate calculate a 2-dimensional kernel density estimate (KDE) and add a JKQTPColumnContourPlot to the given plotter, where the KDE is calculated from the given data range firstX / firstY ... lastY / lastY | |
| template<class InputItX, class InputItY> | |
| JKQTPColumnMathImage * | jkqtpstatAddKDE2DImage (JKQTBasePlotter *plotter, InputItX firstX, InputItX lastX, InputItY firstY, InputItY lastY, size_t xbins=10, size_t ybins=10, const std::function< double(double, double)> &kernel=std::function< double(double, double)>(&jkqtpstatKernel2DGaussian), double bandwidthX=1.0, double bandwidthY=1.0, const QString &kdecolumnBaseName=QString("histogram"), double *oxmin=nullptr, double *oxmax=nullptr, double *oymin=nullptr, double *oymax=nullptr) |
| calculate calculate a 2-dimensional kernel density estimate (KDE) and add a JKQTPColumnMathImage to the given plotter, where the KDE is calculated from the given data range firstX / firstY ... lastY / lastY | |
| template<class InputItX, class InputItY> | |
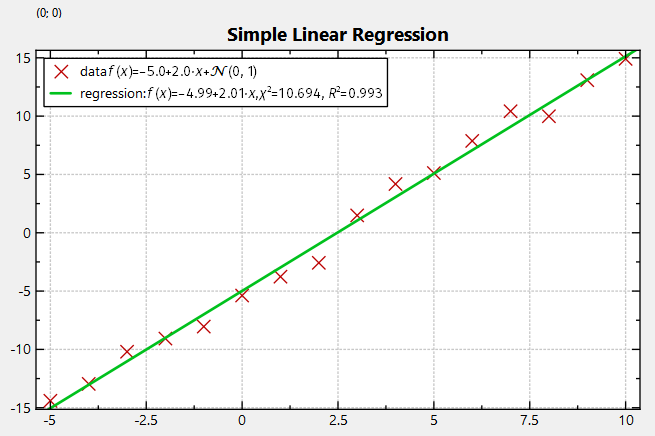
| JKQTPXFunctionLineGraph * | jkqtpstatAddLinearRegression (JKQTBasePlotter *plotter, InputItX firstX, InputItX lastX, InputItY firstY, InputItY lastY, double *coeffA=nullptr, double *coeffB=nullptr, bool fixA=false, bool fixB=false) |
calculate the linear regression coefficients for a given data range firstX / firstY ... lastX / lastY where the model is  | |
| JKQTPLOTTER_LIB_EXPORT JKQTPXFunctionLineGraph * | jkqtpstatAddLinearRegression (JKQTPXYGraph *datagraph, double *coeffA=nullptr, double *coeffB=nullptr, bool fixA=false, bool fixB=false) |
| calculate the linear regression coefficients for a given data data used to draw any JKQTPXYGraph datagraph where the model is | |
| template<class InputItX, class InputItY, class InputItW> | |
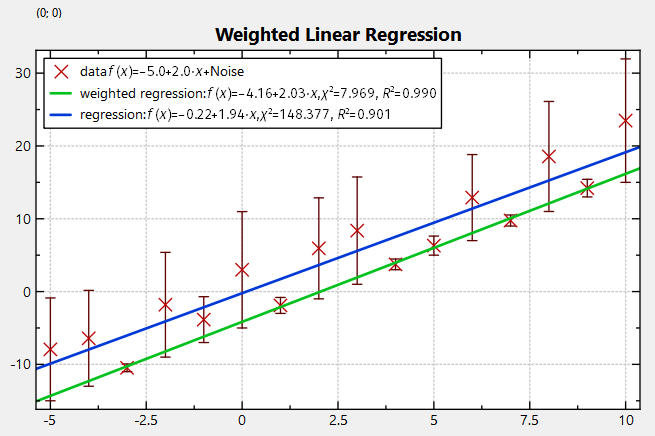
| JKQTPXFunctionLineGraph * | jkqtpstatAddLinearWeightedRegression (JKQTBasePlotter *plotter, InputItX firstX, InputItX lastX, InputItY firstY, InputItY lastY, InputItW firstW, InputItW lastW, double *coeffA=nullptr, double *coeffB=nullptr, bool fixA=false, bool fixB=false, std::function< double(double)> fWeightDataToWi=&jkqtp_identity< double >) |
| calculate the weighted linear regression coefficients for a given for a given data range firstX / firstY / firstW ... lastX / lastY / lastW where the model is | |
| JKQTPLOTTER_LIB_EXPORT JKQTPXFunctionLineGraph * | jkqtpstatAddLinearWeightedRegression (JKQTPXYGraph *datagraph, double *coeffA=nullptr, double *coeffB=nullptr, bool fixA=false, bool fixB=false) |
| calculate the linear weighted regression coefficients for a given data data used to draw any JKQTPXYGraph datagraph , which also implements JKQTPYGraphErrorData and where the model is | |
| template<class InputItX, class InputItY> | |
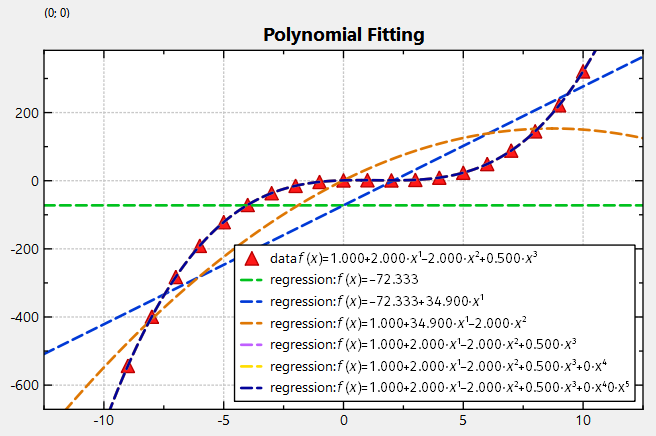
| JKQTPXFunctionLineGraph * | jkqtpstatAddPolyFit (JKQTBasePlotter *plotter, InputItX firstX, InputItX lastX, InputItY firstY, InputItY lastY, size_t P) |
fits (in a least-squares sense) a polynomial   | |
| template<class InputItX, class InputItY, class OutputItP> | |
| JKQTPXFunctionLineGraph * | jkqtpstatAddPolyFit (JKQTBasePlotter *plotter, InputItX firstX, InputItX lastX, InputItY firstY, InputItY lastY, size_t P, OutputItP firstRes) |
| fits (in a least-squares sense) a polynomial | |
| JKQTPLOTTER_LIB_EXPORT JKQTPXFunctionLineGraph * | jkqtpstatAddPolyFit (JKQTPXYGraph *datagraph, size_t P) |
| fits (in a least-squares sense) a polynomial | |
| template<class OutputItP> | |
| JKQTPXFunctionLineGraph * | jkqtpstatAddPolyFit (JKQTPXYGraph *datagraph, size_t P, OutputItP firstRes) |
| fits (in a least-squares sense) a polynomial | |
| template<class InputItX, class InputItY> | |
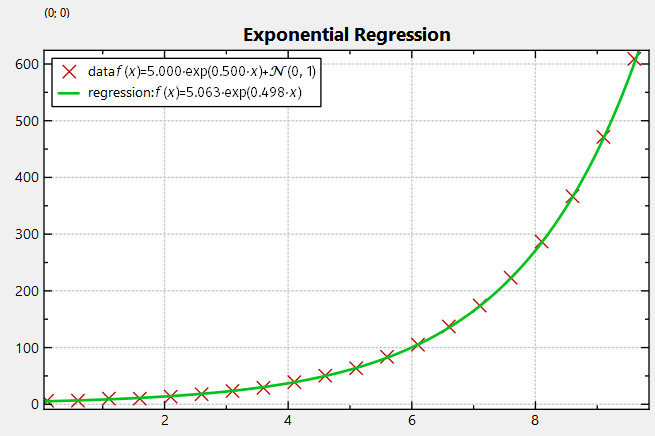
| JKQTPXFunctionLineGraph * | jkqtpstatAddRegression (JKQTBasePlotter *plotter, JKQTPStatRegressionModelType type, InputItX firstX, InputItX lastX, InputItY firstY, InputItY lastY, double *coeffA=nullptr, double *coeffB=nullptr, bool fixA=false, bool fixB=false) |
| calculate the linear regression coefficients for a given data range firstX / firstY ... lastX / lastY where the model is defined by type | |
| template<class InputItX, class InputItY> | |
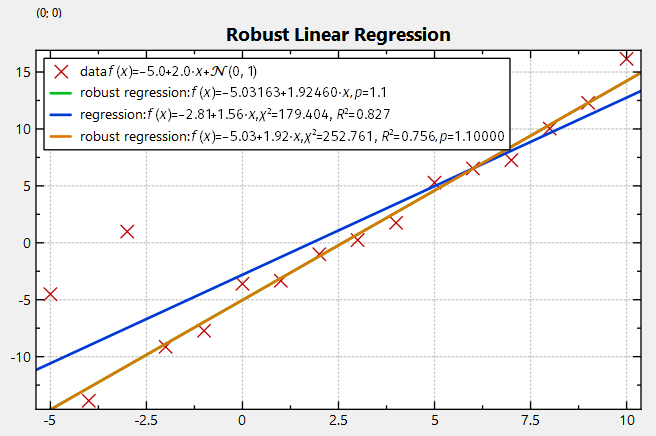
| JKQTPXFunctionLineGraph * | jkqtpstatAddRobustIRLSLinearRegression (JKQTBasePlotter *plotter, InputItX firstX, InputItX lastX, InputItY firstY, InputItY lastY, double *coeffA=nullptr, double *coeffB=nullptr, bool fixA=false, bool fixB=false, double p=1.1, int iterations=100) |
| calculate the (robust) iteratively reweighted least-squares (IRLS) estimate for the parameters of the model | |
| JKQTPLOTTER_LIB_EXPORT JKQTPXFunctionLineGraph * | jkqtpstatAddRobustIRLSLinearRegression (JKQTPXYGraph *datagraph, double *coeffA=nullptr, double *coeffB=nullptr, bool fixA=false, bool fixB=false, double p=1.1, int iterations=100) |
| calculate the (robust) iteratively reweighted least-squares (IRLS) estimate for the parameters of the model | |
| template<class InputItX, class InputItY> | |
| JKQTPXFunctionLineGraph * | jkqtpstatAddRobustIRLSRegression (JKQTBasePlotter *plotter, JKQTPStatRegressionModelType type, InputItX firstX, InputItX lastX, InputItY firstY, InputItY lastY, double *coeffA=nullptr, double *coeffB=nullptr, bool fixA=false, bool fixB=false, double p=1.1, int iterations=100) |
| calculate the (robust) iteratively reweighted least-squares (IRLS) estimate for the parameters where the model is defined by type for a given data range firstX / firstY ... lastX / lastY | |
| JKQTPLOTTER_LIB_EXPORT JKQTPXFunctionLineGraph * | jkqtpstatAddRobustIRLSRegression (JKQTPXYGraph *datagraph, JKQTPStatRegressionModelType type, double *coeffA=nullptr, double *coeffB=nullptr, bool fixA=false, bool fixB=false, double p=1.1, int iterations=100) |
| calculate the (robust) iteratively reweighted least-squares (IRLS) estimate for the parameters where the model is defined by type for a given data range firstX / firstY ... lastX / lastY | |
| template<class InputIt> | |
| JKQTPBoxplotVerticalElement * | jkqtpstatAddVBoxplot (JKQTBasePlotter *plotter, InputIt first, InputIt last, double boxposX, double quantile1Spec=0.25, double quantile2Spec=0.75, double minimumQuantile=0, double maximumQuantile=1.0, JKQTPStat5NumberStatistics *statOutput=nullptr) |
| add a JKQTPBoxplotVerticalElement to the given plotter, where the boxplot values are calculated from the data range first ... last | |
| template<class InputIt> | |
| std::pair< JKQTPBoxplotVerticalElement *, JKQTPSingleColumnSymbolsGraph * > | jkqtpstatAddVBoxplotAndOutliers (JKQTBasePlotter *plotter, InputIt first, InputIt last, double boxposX, double quantile1Spec=0.25, double quantile2Spec=0.75, double minimumQuantile=0.03, double maximumQuantile=0.97, const QString &outliercolumnBaseName=QString("boxplot"), JKQTPStat5NumberStatistics *statOutput=nullptr) |
| add a JKQTPBoxplotVerticalElement and a JKQTPSingleColumnSymbolsGraph for outliers to the given plotter, where the boxplot values are calculated from the data range first ... last | |
| template<class InputCatIt, class InputValueIt> | |
| std::pair< JKQTPBoxplotVerticalGraph *, JKQTPXYLineGraph * > | jkqtpstatAddVBoxplotsAndOutliers (JKQTBasePlotter *plotter, InputCatIt inFirstCat_X, InputCatIt inLastCat_X, InputValueIt inFirstValue_Y, InputValueIt inLastValue_Y, double quantile1Spec=0.25, double quantile2Spec=0.75, double minimumQuantile=0.03, double maximumQuantile=0.97, JKQTPStatGroupDefinitionFunctor1D groupDefFunc=&jkqtpstatGroupingIdentity1D, const QString &columnBaseName=QString("grouped boxplot data")) |
create vertical boxplots of type JKQTPBoxplotVerticalGraph, from the 5-value-summary of groups in the input data, also adds a graph showing the outliers | |
| template<class InputIt, class BinsInputIt> | |
| JKQTPBarHorizontalGraph * | jkqtpstatAddVHistogram1D (JKQTBasePlotter *plotter, InputIt first, InputIt last, BinsInputIt binsFirst, BinsInputIt binsLast, bool normalized=true, bool cummulative=false, const QString &histogramcolumnBaseName=QString("histogram")) |
| calculate an autoranged histogram and add a JKQTPBarHorizontalGraph to the given plotter, where the histogram is calculated from the data range first ... last, bins defined by their width | |
| template<class InputIt> | |
| JKQTPBarHorizontalGraph * | jkqtpstatAddVHistogram1DAutoranged (JKQTBasePlotter *plotter, InputIt first, InputIt last, double binWidth, bool normalized=true, bool cummulative=false, const QString &histogramcolumnBaseName=QString("histogram")) |
| calculate an autoranged histogram and add a JKQTPBarHorizontalGraph to the given plotter, where the histogram is calculated from the data range first ... last, bins defined by their width | |
| template<class InputIt> | |
| JKQTPBarHorizontalGraph * | jkqtpstatAddVHistogram1DAutoranged (JKQTBasePlotter *plotter, InputIt first, InputIt last, int bins=11, bool normalized=true, bool cummulative=false, const QString &histogramcolumnBaseName=QString("histogram")) |
| calculate an autoranged histogram and add a JKQTPBarHorizontalGraph to the given plotter, where the histogram is calculated from the data range first ... last, bins defined by their number | |
| template<class InputIt, class BinsInputIt> | |
| JKQTPXYLineGraph * | jkqtpstatAddVKDE1D (JKQTBasePlotter *plotter, InputIt first, InputIt last, BinsInputIt binsFirst, BinsInputIt binsLast, const std::function< double(double)> &kernel=std::function< double(double)>(&jkqtpstatKernel1DGaussian), double bandwidth=1.0, bool cummulative=false, const QString &KDEcolumnBaseName=QString("KDE")) |
| calculate an autoranged vertical KDE and add a JKQTPXYLineGraph to the given plotter, where the KDE is calculated from the data range first ... last, bins defined by their width | |
| template<class InputIt> | |
| JKQTPXYLineGraph * | jkqtpstatAddVKDE1D (JKQTBasePlotter *plotter, InputIt first, InputIt last, double binXLeft, double binXDelta, double binXRight, const std::function< double(double)> &kernel=std::function< double(double)>(&jkqtpstatKernel1DGaussian), double bandwidth=1.0, bool cummulative=false, const QString &KDEcolumnBaseName=QString("KDE")) |
| calculate an autoranged vertical KDE and add a JKQTPXYLineGraph to the given plotter, where the KDE is calculated from the data range first ... last, evaluation positions are given by the range binXLeft ... binXRight (in steps of binxDelta ) | |
| template<class InputIt> | |
| JKQTPXYLineGraph * | jkqtpstatAddVKDE1DAutoranged (JKQTBasePlotter *plotter, InputIt first, InputIt last, double binWidth, const std::function< double(double)> &kernel=std::function< double(double)>(&jkqtpstatKernel1DGaussian), double bandwidth=1.0, bool cummulative=false, const QString &KDEcolumnBaseName=QString("KDE")) |
| calculate an autoranged vertical KDE and add a JKQTPXYLineGraph to the given plotter, where the KDE is calculated from the data range first ... last, bins defined by their width | |
| template<class InputIt> | |
| JKQTPXYLineGraph * | jkqtpstatAddVKDE1DAutoranged (JKQTBasePlotter *plotter, InputIt first, InputIt last, int Nout=100, const std::function< double(double)> &kernel=std::function< double(double)>(&jkqtpstatKernel1DGaussian), double bandwidth=1.0, bool cummulative=false, const QString &KDEcolumnBaseName=QString("KDE")) |
| calculate an autoranged vertical KDE and add a JKQTPXYLineGraph to the given plotter, where the KDE is calculated from the data range first ... last, bins defined by their number | |
| template<class InputIt> | |
| JKQTPViolinplotVerticalElement * | jkqtpstatAddVViolinplotHistogram (JKQTBasePlotter *plotter, InputIt first, InputIt last, double violinposY, const QString &distBasename=QString("violin plot distribution"), int violinDistSamples=21) |
| add a JKQTPViolinplotVerticalElement to the given plotter, where the Violinplot values are calculated from the data range first ... last , uses a histogram as density distribution estimate | |
| template<class InputIt> | |
| std::pair< JKQTPViolinplotVerticalElement *, JKQTPSingleColumnSymbolsGraph * > | jkqtpstatAddVViolinplotHistogramAndOutliers (JKQTBasePlotter *plotter, InputIt first, InputIt last, double violinposY, double minimumQuantile=0.03, double maximumQuantile=0.97, const QString &distBasename=QString("violin plot distribution"), int violinDistSamples=21) |
| add a JKQTPViolinplotVerticalElement and an outliers graph to the given plotter, where the Violinplot values are calculated from the data range first ... last , uses a histogram as density distribution estimate | |
| template<class InputIt> | |
| JKQTPViolinplotVerticalElement * | jkqtpstatAddVViolinplotKDE (JKQTBasePlotter *plotter, InputIt first, InputIt last, double violinposY, const std::function< double(double)> &kernel=std::function< double(double)>(&jkqtpstatKernel1DGaussian), double bandwidth=-1, const QString &distBasename=QString("violin plot distribution"), int violinDistSamples=100) |
| add a JKQTPViolinplotVerticalElement to the given plotter, where the Violinplot values are calculated from the data range first ... last , uses a kernel density estimate as density distribution estimate | |
| template<class InputIt> | |
| std::pair< JKQTPViolinplotVerticalElement *, JKQTPSingleColumnSymbolsGraph * > | jkqtpstatAddVViolinplotKDEAndOutliers (JKQTBasePlotter *plotter, InputIt first, InputIt last, double violinposY, const std::function< double(double)> &kernel=std::function< double(double)>(&jkqtpstatKernel1DGaussian), double bandwidth=-1, double minimumQuantile=0.03, double maximumQuantile=0.97, const QString &distBasename=QString("violin plot distribution"), int violinDistSamples=100) |
| add a JKQTPViolinplotVerticalElement and an outliers graph to the given plotter, where the Violinplot values are calculated from the data range first ... last , uses a kernel density estimate as density distribution estimate | |
| template<class InputItX, class InputItY, class InputItW> | |
| JKQTPXFunctionLineGraph * | jkqtpstatAddWeightedRegression (JKQTBasePlotter *plotter, JKQTPStatRegressionModelType type, InputItX firstX, InputItX lastX, InputItY firstY, InputItY lastY, InputItW firstW, InputItW lastW, double *coeffA=nullptr, double *coeffB=nullptr, bool fixA=false, bool fixB=false, std::function< double(double)> fWeightDataToWi=&jkqtp_identity< double >) |
| calculate the weighted linear regression coefficients for a given for a given data range firstX / firstY / firstW ... lastX / lastY / lastW where the model is defined by type | |
| JKQTPLOTTER_LIB_EXPORT JKQTPXFunctionLineGraph * | jkqtpstatAddWeightedRegression (JKQTPXYGraph *datagraph, JKQTPStatRegressionModelType type, double *coeffA=nullptr, double *coeffB=nullptr, bool fixA=false, bool fixB=false) |
| calculate the linear weighted regression coefficients for a given data data used to draw any JKQTPXYGraph datagraph , which also implements JKQTPYGraphErrorData and where the model is defined by type | |
| template<class InputCatIt, class InputValueIt> | |
| JKQTPBarHorizontalErrorGraph * | jkqtpstatAddXErrorBarGraph (JKQTBasePlotter *plotter, InputCatIt inFirstCat_Y, InputCatIt inLastCat_Y, InputValueIt inFirstValue_Y, InputValueIt inLastValue_Y, JKQTPStatGroupDefinitionFunctor1D groupDefFunc=&jkqtpstatGroupingIdentity1D, const QString &columnBaseName=QString("grouped data")) |
create a JKQTPBarHorizontalErrorGraph with x-direction error bars, calculated from average +/- stddev of groups in the input data | |
| template<class InputCatIt, class InputValueIt> | |
| JKQTPFilledCurveXErrorGraph * | jkqtpstatAddXErrorFilledCurveGraph (JKQTBasePlotter *plotter, InputCatIt inFirstCat_Y, InputCatIt inLastCat_Y, InputValueIt inFirstValue_Y, InputValueIt inLastValue_Y, JKQTPStatGroupDefinitionFunctor1D groupDefFunc=&jkqtpstatGroupingIdentity1D, const QString &columnBaseName=QString("grouped data")) |
| create a JKQTPFilledCurveXErrorGraph with x-direction error bars, calculated from average +/- stddev of groups in the input data | |
| template<class InputCatIt, class InputValueIt, class TGraph> | |
| TGraph * | jkqtpstatAddXErrorGraph (JKQTBasePlotter *plotter, InputCatIt inFirstCat_Y, InputCatIt inLastCat_Y, InputValueIt inFirstValue_Y, InputValueIt inLastValue_Y, JKQTPStatGroupDefinitionFunctor1D groupDefFunc=&jkqtpstatGroupingIdentity1D, const QString &columnBaseName=QString("grouped data")) |
| create a plot with x-direction error bars, calculated from average +/- stddev of groups in the input data | |
| template<class InputCatIt, class InputValueIt> | |
| JKQTPImpulsesHorizontalErrorGraph * | jkqtpstatAddXErrorImpulsesGraph (JKQTBasePlotter *plotter, InputCatIt inFirstCat_Y, InputCatIt inLastCat_Y, InputValueIt inFirstValue_Y, InputValueIt inLastValue_Y, JKQTPStatGroupDefinitionFunctor1D groupDefFunc=&jkqtpstatGroupingIdentity1D, const QString &columnBaseName=QString("grouped data")) |
create a JKQTPImpulsesHorizontalErrorGraph with x-direction error bars, calculated from average +/- stddev of groups in the input data | |
| template<class InputCatIt, class InputValueIt> | |
| JKQTPXYLineErrorGraph * | jkqtpstatAddXErrorLineGraph (JKQTBasePlotter *plotter, InputCatIt inFirstCat_Y, InputCatIt inLastCat_Y, InputValueIt inFirstValue_Y, InputValueIt inLastValue_Y, JKQTPStatGroupDefinitionFunctor1D groupDefFunc=&jkqtpstatGroupingIdentity1D, const QString &columnBaseName=QString("grouped data")) |
create a JKQTPXYLineErrorGraph with x-direction error bars, calculated from average +/- stddev of groups in the input data | |
| template<class InputCatIt, class InputValueIt> | |
| JKQTPXYParametrizedErrorScatterGraph * | jkqtpstatAddXErrorParametrizedScatterGraph (JKQTBasePlotter *plotter, InputCatIt inFirstCat_Y, InputCatIt inLastCat_Y, InputValueIt inFirstValue_Y, InputValueIt inLastValue_Y, JKQTPStatGroupDefinitionFunctor1D groupDefFunc=&jkqtpstatGroupingIdentity1D, const QString &columnBaseName=QString("grouped data")) |
create a JKQTPXYParametrizedErrorScatterGraph with x-direction error bars, calculated from average +/- stddev of groups in the input data | |
| template<class InputCatIt, class InputValueIt, class TGraph> | |
| TGraph * | jkqtpstatAddXYErrorGraph (JKQTBasePlotter *plotter, InputCatIt inFirstCat_X, InputCatIt inLastCat_X, InputValueIt inFirstValue_Y, InputValueIt inLastValue_Y, JKQTPStatGroupDefinitionFunctor1D groupDefFunc=&jkqtpstatGroupingIdentity1D, const QString &columnBaseName=QString("grouped data")) |
| create a plot with x- and y-direction error bars, calculated from directional average +/- stddev of groups in the input data | |
| template<class InputCatIt, class InputValueIt> | |
| JKQTPXYLineErrorGraph * | jkqtpstatAddXYErrorLineGraph (JKQTBasePlotter *plotter, InputCatIt inFirstCat_X, InputCatIt inLastCat_X, InputValueIt inFirstValue_Y, InputValueIt inLastValue_Y, JKQTPStatGroupDefinitionFunctor1D groupDefFunc=&jkqtpstatGroupingIdentity1D, const QString &columnBaseName=QString("grouped data")) |
create a JKQTPXYLineErrorGraph with y-direction error bars, calculated from average +/- stddev of groups in the input data | |
| template<class InputCatIt, class InputValueIt> | |
| JKQTPXYParametrizedErrorScatterGraph * | jkqtpstatAddXYErrorParametrizedScatterGraph (JKQTBasePlotter *plotter, InputCatIt inFirstCat_X, InputCatIt inLastCat_X, InputValueIt inFirstValue_Y, InputValueIt inLastValue_Y, JKQTPStatGroupDefinitionFunctor1D groupDefFunc=&jkqtpstatGroupingIdentity1D, const QString &columnBaseName=QString("grouped data")) |
create a JKQTPXYParametrizedErrorScatterGraph with y-direction error bars, calculated from average +/- stddev of groups in the input data | |
| template<class InputCatIt, class InputValueIt> | |
| JKQTPBarVerticalErrorGraph * | jkqtpstatAddYErrorBarGraph (JKQTBasePlotter *plotter, InputCatIt inFirstCat_X, InputCatIt inLastCat_X, InputValueIt inFirstValue_Y, InputValueIt inLastValue_Y, JKQTPStatGroupDefinitionFunctor1D groupDefFunc=&jkqtpstatGroupingIdentity1D, const QString &columnBaseName=QString("grouped data")) |
create a JKQTPBarVerticalErrorGraph with y-direction error bars, calculated from average +/- stddev of groups in the input data | |
| template<class InputCatIt, class InputValueIt> | |
| JKQTPFilledCurveYErrorGraph * | jkqtpstatAddYErrorFilledCurveGraph (JKQTBasePlotter *plotter, InputCatIt inFirstCat_X, InputCatIt inLastCat_X, InputValueIt inFirstValue_Y, InputValueIt inLastValue_Y, JKQTPStatGroupDefinitionFunctor1D groupDefFunc=&jkqtpstatGroupingIdentity1D, const QString &columnBaseName=QString("grouped data")) |
create a JKQTPFilledCurveYErrorGraph with y-direction error bars, calculated from average +/- stddev of groups in the input data | |
| template<class InputCatIt, class InputValueIt, class TGraph> | |
| TGraph * | jkqtpstatAddYErrorGraph (JKQTBasePlotter *plotter, InputCatIt inFirstCat_X, InputCatIt inLastCat_X, InputValueIt inFirstValue_Y, InputValueIt inLastValue_Y, JKQTPStatGroupDefinitionFunctor1D groupDefFunc=&jkqtpstatGroupingIdentity1D, const QString &columnBaseName=QString("grouped data")) |
| create a plot with y-direction error bars, calculated from average +/- stddev of groups in the input data | |
| template<class InputCatIt, class InputValueIt> | |
| JKQTPImpulsesVerticalErrorGraph * | jkqtpstatAddYErrorImpulsesGraph (JKQTBasePlotter *plotter, InputCatIt inFirstCat_X, InputCatIt inLastCat_X, InputValueIt inFirstValue_Y, InputValueIt inLastValue_Y, JKQTPStatGroupDefinitionFunctor1D groupDefFunc=&jkqtpstatGroupingIdentity1D, const QString &columnBaseName=QString("grouped data")) |
create a JKQTPImpulsesVerticalErrorGraph with y-direction error bars, calculated from average +/- stddev of groups in the input data | |
| template<class InputCatIt, class InputValueIt> | |
| JKQTPXYLineErrorGraph * | jkqtpstatAddYErrorLineGraph (JKQTBasePlotter *plotter, InputCatIt inFirstCat_X, InputCatIt inLastCat_X, InputValueIt inFirstValue_Y, InputValueIt inLastValue_Y, JKQTPStatGroupDefinitionFunctor1D groupDefFunc=&jkqtpstatGroupingIdentity1D, const QString &columnBaseName=QString("grouped data")) |
create a JKQTPXYLineErrorGraph with y-direction error bars, calculated from average +/- stddev of groups in the input data | |
| template<class InputCatIt, class InputValueIt> | |
| JKQTPXYParametrizedErrorScatterGraph * | jkqtpstatAddYErrorParametrizedScatterGraph (JKQTBasePlotter *plotter, InputCatIt inFirstCat_X, InputCatIt inLastCat_X, InputValueIt inFirstValue_Y, InputValueIt inLastValue_Y, JKQTPStatGroupDefinitionFunctor1D groupDefFunc=&jkqtpstatGroupingIdentity1D, const QString &columnBaseName=QString("grouped data")) |
create a JKQTPXYParametrizedErrorScatterGraph with y-direction error bars, calculated from average +/- stddev of groups in the input data | |
| template<class InputCatIt, class InputValueIt> | |
| JKQTPBoxplotVerticalGraph * | jkqtpstatVAddBoxplots (JKQTBasePlotter *plotter, InputCatIt inFirstCat_Y, InputCatIt inLastCat_Y, InputValueIt inFirstValue_X, InputValueIt inLastValue_X, double quantile1Spec=0.25, double quantile2Spec=0.75, double minimumQuantile=0, double maximumQuantile=1.0, JKQTPStatGroupDefinitionFunctor1D groupDefFunc=&jkqtpstatGroupingIdentity1D, const QString &columnBaseName=QString("grouped boxplot data")) |
create vertical boxplots of type JKQTPBoxplotVerticalGraph, from the 5-value-summary of groups in the input data | |
|
inline |
create horizontal boxplots of type TGraph, from the 5-value-summary of groups in the input data
| TGraph | type of graph that should be added to the plot, has to offer the same interface as JKQTPBoxplotVerticalGraph or JKQTPBoxplotHorizontalGraph |
| InputCatIt | standard iterator type of inFirstCat_Y and inLastCat_Y |
| InputValueIt | standard iterator type of inFirstValue_Y and inLastValue_Y |
| plotter | the plotter to which to add the resulting graph |
| inFirstCat_Y | iterator pointing to the first item in the category dataset to use  |
| inLastCat_Y | iterator pointing behind the last item in the category dataset to use  |
| inFirstValue_Y | iterator pointing to the first item in the category dataset to use  |
| inLastValue_Y | iterator pointing behind the last item in the category dataset to use  |
| quantile1Spec | specifies which quantile to calculate for qantile1 (range: 0..1) |
| quantile2Spec | specifies which quantile to calculate for qantile2 (range: 0..1) |
| minimumQuantile | specifies a quantile for the return value minimum (default is 0 for the real minimum, but you could e.g. use 0.05 for the 5% quantile!) |
| maximumQuantile | specifies a quantile for the return value maximum (default is 1 for the real maximum, but you could e.g. use 0.95 for the 95% quantile!) |
| groupDefFunc | assigns a group   |
| columnBaseName | string component used to build the names of the columns generated by this function |
|
inline |
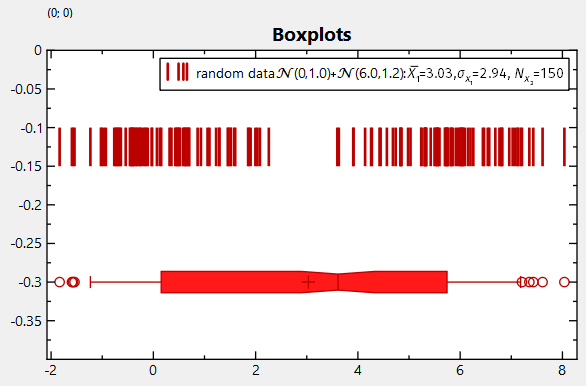
add a JKQTPBoxplotHorizontalElement to the given plotter, where the boxplot values are calculated from the data range first ... last
| InputIt | standard iterator type of first and last. |
| plotter | the plotter to which to add the resulting graph | |
| first | iterator pointing to the first item in the dataset to use  | |
| last | iterator pointing behind the last item in the dataset to use  | |
| boxposY | y-coordinate of the boxplot | |
| quantile1Spec | specifies which quantile to calculate for qantile1 (range: 0..1) | |
| quantile2Spec | specifies which quantile to calculate for qantile2 (range: 0..1) | |
| minimumQuantile | specifies a quantile for the return value minimum (default is 0 for the real minimum, but you could e.g. use 0.05 for the 5% quantile!) | |
| maximumQuantile | specifies a quantile for the return value maximum (default is 1 for the real maximum, but you could e.g. use 0.95 for the 95% quantile!) | |
| [out] | statOutput | optionally returns the internally calculated statistics as a JKQTPStat5NumberStatistics |
Example:
|
inline |
add a JKQTPBoxplotHorizontalElement and a JKQTPSingleColumnSymbolsGraph for outliers to the given plotter, where the boxplot values are calculated from the data range first ... last
| InputIt | standard iterator type of first and last. |
| plotter | the plotter to which to add the resulting graph | |
| first | iterator pointing to the first item in the dataset to use | |
| last | iterator pointing behind the last item in the dataset to use | |
| boxposY | y-coordinate of the outliers (and the boxplot) | |
| quantile1Spec | specifies which quantile to calculate for qantile1 (range: 0..1) | |
| quantile2Spec | specifies which quantile to calculate for qantile2 (range: 0..1) | |
| minimumQuantile | specifies a quantile for the return value minimum (default is 0 for the real minimum, but you could e.g. use 0.05 for the 5% quantile!) | |
| maximumQuantile | specifies a quantile for the return value maximum (default is 1 for the real maximum, but you could e.g. use 0.95 for the 95% quantile!) | |
| outliercolumnBaseName | this string is used in building the column names for the outlier columns | |
| [out] | statOutput | optionally returns the internally calculated statistics as a JKQTPStat5NumberStatistics |
Example:
|
inline |
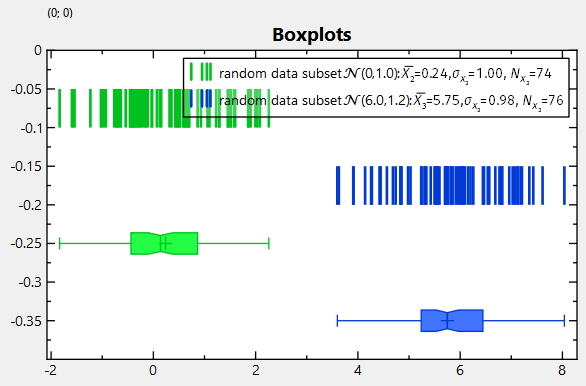
create vertical boxplots of type JKQTPBoxplotHorizontalGraph, from the 5-value-summary of groups in the input data, also adds a graph showing the outliers
| InputCatIt | standard iterator type of inFirstCat_Y and inLastCat_Y |
| InputValueIt | standard iterator type of inFirstValue_X and inLastValue_X |
| plotter | the plotter to which to add the resulting graph |
| inFirstCat_Y | iterator pointing to the first item in the category dataset to use |
| inLastCat_Y | iterator pointing behind the last item in the category dataset to use |
| inFirstValue_X | iterator pointing to the first item in the category dataset to use |
| inLastValue_X | iterator pointing behind the last item in the category dataset to use |
| quantile1Spec | specifies which quantile to calculate for qantile1 (range: 0..1) |
| quantile2Spec | specifies which quantile to calculate for qantile2 (range: 0..1) |
| minimumQuantile | specifies a quantile for the return value minimum (default is 0 for the real minimum, but you could e.g. use 0.05 for the 5% quantile!) |
| maximumQuantile | specifies a quantile for the return value maximum (default is 1 for the real maximum, but you could e.g. use 0.95 for the 95% quantile!) |
| groupDefFunc | assigns a group |
| columnBaseName | string component used to build the names of the columns generated by this function |
|
inline |
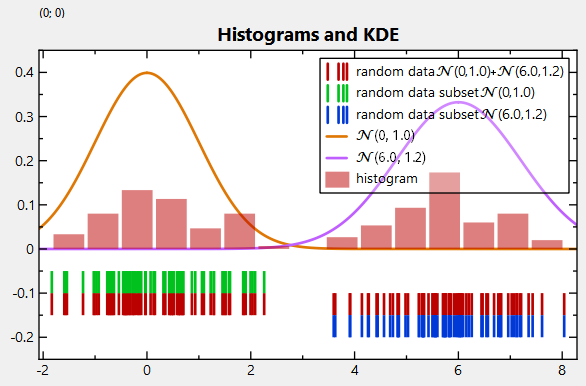
calculate an autoranged histogram and add a JKQTPBarVerticalGraph to the given plotter, where the histogram is calculated from the data range first ... last, bins defined by their width
| InputIt | standard iterator type of first and last. |
| BinsInputIt | standard iterator type of binsFirst and binsLast. |
| plotter | the plotter to which to add the resulting graph |
| first | iterator pointing to the first item in the dataset to use |
| last | iterator pointing behind the last item in the dataset to use |
| binsFirst | iterator pointing to the first item in the set of histogram bins |
| binsLast | iterator pointing behind the last item in the set of histogram bins |
| histogramcolumnBaseName | this string is used in building the column names for the histogram columns |
| normalized | indicates whether the histogram has to be normalized |
| cummulative | if true, a cummulative histogram is calculated |
Example:
|
inline |
calculate an autoranged histogram and add a JKQTPBarVerticalGraph to the given plotter, where the histogram is calculated from the data range first ... last, bins defined by their width
| InputIt | standard iterator type of first and last. |
| plotter | the plotter to which to add the resulting graph |
| first | iterator pointing to the first item in the dataset to use |
| last | iterator pointing behind the last item in the dataset to use |
| binWidth | width of the bins |
| histogramcolumnBaseName | this string is used in building the column names for the histogram columns |
| normalized | indicates whether the histogram has to be normalized |
| cummulative | if true, a cummulative histogram is calculated |
Example:
|
inline |
calculate an autoranged histogram and add a JKQTPBarVerticalGraph to the given plotter, where the histogram is calculated from the data range first ... last, bins defined by their number
| InputIt | standard iterator type of first and last. |
| plotter | the plotter to which to add the resulting graph |
| first | iterator pointing to the first item in the dataset to use |
| last | iterator pointing behind the last item in the dataset to use |
| bins | number of bins in the resulting histogram |
| histogramcolumnBaseName | this string is used in building the column names for the outlier columns |
| normalized | indicates whether the histogram has to be normalized |
| cummulative | if true, a cummulative histogram is calculated |
Example:
|
inline |
calculate calculate a 2-dimensional histogram and add a JKQTPColumnContourPlot to the given plotter, where the histogram is calculated from the given data range firstX / firstY ... lastY / lastY
| InputItX | standard iterator type of firstX and lastX. |
| InputItY | standard iterator type of firstY and lastY. |
| plotter | the plotter to which to add the resulting graph | |
| firstX | iterator pointing to the first x-position item in the dataset to use | |
| lastX | iterator pointing behind the last x-position item in the dataset to use | |
| firstY | iterator pointing to the first y-position item in the dataset to use  | |
| lastY | iterator pointing behind the last y-position item in the dataset to use  | |
| xbinwidth | width of bins in x-direction | |
| ybinwidth | width of bins in y-direction | |
| normalized | indicates whether the histogram has to be normalized | |
| histogramcolumnBaseName | this string is used in building the column names for the histogram data columns | |
| [out] | oxmin | position of the first histogram bin in x-direction |
| [out] | oxmax | position of the last histogram bin in x-direction |
| [out] | oymin | position of the first histogram bin in y-direction |
| [out] | oymax | position of the last histogram bin in y-direction |
JKQTPColumnContourPlot ) displaying the histogram data as a contour plot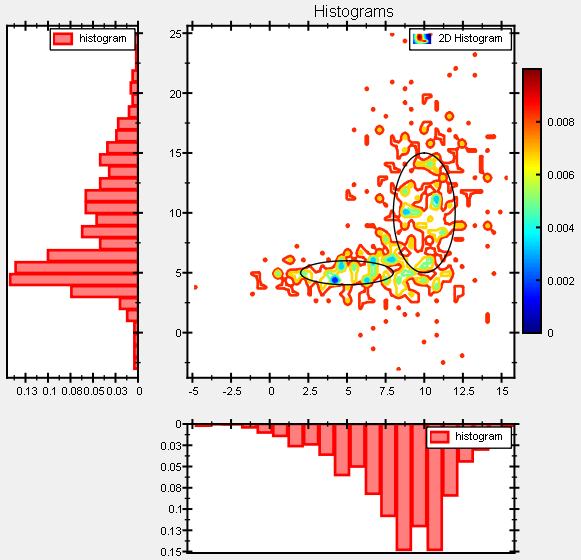
|
inline |
calculate calculate a 2-dimensional histogram and add a JKQTPColumnContourPlot to the given plotter, where the histogram is calculated from the given data range firstX / firstY ... lastY / lastY
| InputItX | standard iterator type of firstX and lastX. |
| InputItY | standard iterator type of firstY and lastY. |
| plotter | the plotter to which to add the resulting graph | |
| firstX | iterator pointing to the first x-position item in the dataset to use | |
| lastX | iterator pointing behind the last x-position item in the dataset to use | |
| firstY | iterator pointing to the first y-position item in the dataset to use | |
| lastY | iterator pointing behind the last y-position item in the dataset to use | |
| xbins | number of bins in x-direction | |
| ybins | number of bins in y-direction | |
| normalized | indicates whether the histogram has to be normalized | |
| histogramcolumnBaseName | this string is used in building the column names for the histogram data columns | |
| [out] | oxmin | position of the first histogram bin in x-direction |
| [out] | oxmax | position of the last histogram bin in x-direction |
| [out] | oymin | position of the first histogram bin in y-direction |
| [out] | oymax | position of the last histogram bin in y-direction |
JKQTPColumnContourPlot ) displaying the histogram data as a contour plot
|
inline |
calculate calculate a 2-dimensional histogram and add a JKQTPColumnMathImage to the given plotter, where the histogram is calculated from the given data range firstX / firstY ... lastY / lastY
| InputItX | standard iterator type of firstX and lastX. |
| InputItY | standard iterator type of firstY and lastY. |
| plotter | the plotter to which to add the resulting graph | |
| firstX | iterator pointing to the first x-position item in the dataset to use | |
| lastX | iterator pointing behind the last x-position item in the dataset to use | |
| firstY | iterator pointing to the first y-position item in the dataset to use | |
| lastY | iterator pointing behind the last y-position item in the dataset to use | |
| xbinwidth | width of bins in x-direction | |
| ybinwidth | width of bins in y-direction | |
| normalized | indicates whether the histogram has to be normalized | |
| histogramcolumnBaseName | this string is used in building the column names for the histogram data columns | |
| [out] | oxmin | position of the first histogram bin in x-direction |
| [out] | oxmax | position of the last histogram bin in x-direction |
| [out] | oymin | position of the first histogram bin in y-direction |
| [out] | oymax | position of the last histogram bin in y-direction |
JKQTPColumnMathImage ) displaying the histogram data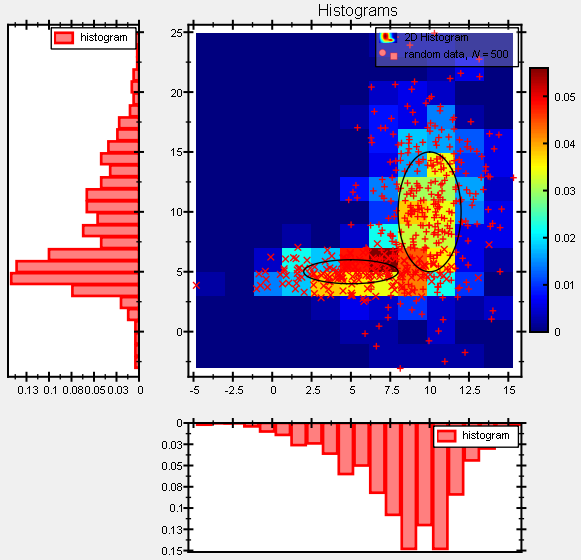
|
inline |
calculate calculate a 2-dimensional histogram and add a JKQTPColumnMathImage to the given plotter, where the histogram is calculated from the given data range firstX / firstY ... lastY / lastY
| InputItX | standard iterator type of firstX and lastX. |
| InputItY | standard iterator type of firstY and lastY. |
| plotter | the plotter to which to add the resulting graph | |
| firstX | iterator pointing to the first x-position item in the dataset to use | |
| lastX | iterator pointing behind the last x-position item in the dataset to use | |
| firstY | iterator pointing to the first y-position item in the dataset to use | |
| lastY | iterator pointing behind the last y-position item in the dataset to use | |
| xbins | number of bins in x-direction | |
| ybins | number of bins in y-direction | |
| normalized | indicates whether the histogram has to be normalized | |
| histogramcolumnBaseName | this string is used in building the column names for the histogram data columns | |
| [out] | oxmin | position of the first histogram bin in x-direction |
| [out] | oxmax | position of the last histogram bin in x-direction |
| [out] | oymin | position of the first histogram bin in y-direction |
| [out] | oymax | position of the last histogram bin in y-direction |
JKQTPColumnMathImage ) displaying the histogram data
|
inline |
calculate an autoranged KDE and add a JKQTPXYLineGraph to the given plotter, where the KDE is calculated from the data range first ... last, bins defined by their width
| InputIt | standard iterator type of first and last. |
| BinsInputIt | standard iterator type of binsFirst and binsLast. |
| plotter | the plotter to which to add the resulting graph |
| first | iterator pointing to the first item in the dataset to use |
| last | iterator pointing behind the last item in the dataset to use |
| binsFirst | iterator pointing to the first item in the set of KDE bins |
| binsLast | iterator pointing behind the last item in the set of KDE bins |
| kernel | the kernel function to use (e.g. jkqtpstatKernel1DGaussian() ) |
| bandwidth | bandwidth used for the KDE |
| cummulative | if true, a cummulative KDE is calculated |
| KDEcolumnBaseName | this string is used in building the column names for the KDE data columns |
Example:
|
inline |
calculate an autoranged KDE and add a JKQTPXYLineGraph to the given plotter, where the KDE is calculated from the data range first ... last, evaluation positions are given by the range binXLeft ... binXRight (in steps of binxDelta )
| InputIt | standard iterator type of first and last. |
| plotter | the plotter to which to add the resulting graph |
| first | iterator pointing to the first item in the dataset to use |
| last | iterator pointing behind the last item in the dataset to use |
| binXLeft | first x-position, where to evaluate the KDE |
| binXDelta | distance between two x-positions at which the KDE is evaluated |
| binXRight | last x-position, where to evaluate the KDE |
| kernel | the kernel function to use (e.g. jkqtpstatKernel1DGaussian() ) |
| bandwidth | bandwidth used for the KDE |
| cummulative | if true, a cummulative KDE is calculated |
| KDEcolumnBaseName | this string is used in building the column names for the KDE data columns |
Example:
|
inline |
calculate an autoranged KDE and add a JKQTPXYLineGraph to the given plotter, where the KDE is calculated from the data range first ... last, bins defined by their width
| InputIt | standard iterator type of first and last. |
| plotter | the plotter to which to add the resulting graph |
| first | iterator pointing to the first item in the dataset to use |
| last | iterator pointing behind the last item in the dataset to use |
| binWidth | width of the bins |
| kernel | the kernel function to use (e.g. jkqtpstatKernel1DGaussian() ) |
| bandwidth | bandwidth used for the KDE |
| cummulative | if true, a cummulative KDE is calculated |
| KDEcolumnBaseName | this string is used in building the column names for the KDE data columns |
Example:
|
inline |
calculate an autoranged KDE and add a JKQTPXYLineGraph to the given plotter, where the KDE is calculated from the data range first ... last, bins defined by their number
| InputIt | standard iterator type of first and last. |
| plotter | the plotter to which to add the resulting graph |
| first | iterator pointing to the first item in the dataset to use |
| last | iterator pointing behind the last item in the dataset to use |
| Nout | number of points in the resulting KDE |
| kernel | the kernel function to use (e.g. jkqtpstatKernel1DGaussian() ) |
| bandwidth | bandwidth used for the KDE |
| cummulative | if true, a cummulative KDE is calculated |
| KDEcolumnBaseName | this string is used in building the column names for the KDE data columns |
Example:
|
inline |
add a JKQTPViolinplotHorizontalElement to the given plotter, where the Violinplot values are calculated from the data range first ... last , uses a histogram as density distribution estimate
| InputIt | standard iterator type of first and last. |
| plotter | the plotter to which to add the resulting graph |
| first | iterator pointing to the first item in the dataset to use |
| last | iterator pointing behind the last item in the dataset to use |
| violinposY | y-coordinate of the Violinplot |
| distBasename | name basing for added columns |
| violinDistSamples | number of bin of the distribution (between min and max) |
Example:
|
inline |
add a JKQTPViolinplotHorizontalElement and an outliers graph to the given plotter, where the Violinplot values are calculated from the data range first ... last , uses a histogram as density distribution estimate
| InputIt | standard iterator type of first and last. |
| plotter | the plotter to which to add the resulting graph |
| first | iterator pointing to the first item in the dataset to use |
| last | iterator pointing behind the last item in the dataset to use |
| violinposY | y-coordinate of the Violinplot |
| minimumQuantile | specifies a quantile for the return value minimum (default is 0 for the real minimum, but you could e.g. use 0.05 for the 5% quantile!) |
| maximumQuantile | specifies a quantile for the return value maximum (default is 1 for the real maximum, but you could e.g. use 0.95 for the 95% quantile!) |
| distBasename | name basing for added columns |
| violinDistSamples | number of samples of the distribution (between min and max) |
Example:
|
inline |
add a JKQTPViolinplotHorizontalElement to the given plotter, where the Violinplot values are calculated from the data range first ... last , uses a kernel density estimate as density distribution estimate
| InputIt | standard iterator type of first and last. |
| plotter | the plotter to which to add the resulting graph |
| first | iterator pointing to the first item in the dataset to use |
| last | iterator pointing behind the last item in the dataset to use |
| violinposY | y-coordinate of the Violinplot |
| kernel | the kernel function to use (e.g. jkqtpstatKernel1DGaussian() ) |
| bandwidth | bandwidth used for the KDE, if <0 then jkqtpstatEstimateKDEBandwidth(first,last) is called |
| distBasename | name basing for added columns |
| violinDistSamples | number of samples of the distribution (between min and max) |
Example:
|
inline |
add a JKQTPViolinplotHorizontalElement and an outliers graph to the given plotter, where the Violinplot values are calculated from the data range first ... last , uses a kernel density estimate as density distribution estimate
| InputIt | standard iterator type of first and last. |
| plotter | the plotter to which to add the resulting graph |
| first | iterator pointing to the first item in the dataset to use |
| last | iterator pointing behind the last item in the dataset to use |
| violinposY | y-coordinate of the Violinplot |
| kernel | the kernel function to use (e.g. jkqtpstatKernel1DGaussian() ) |
| bandwidth | bandwidth used for the KDE, if <0 then jkqtpstatEstimateKDEBandwidth(first,last) is called |
| minimumQuantile | specifies a quantile for the return value minimum (default is 0 for the real minimum, but you could e.g. use 0.05 for the 5% quantile!) |
| maximumQuantile | specifies a quantile for the return value maximum (default is 1 for the real maximum, but you could e.g. use 0.95 for the 95% quantile!) |
| distBasename | name basing for added columns |
| violinDistSamples | number of samples of the distribution (between min and max) |
Example:
|
inline |
calculate calculate a 2-dimensional kernel density estimate (KDE) and add a JKQTPColumnContourPlot to the given plotter, where the KDE is calculated from the given data range firstX / firstY ... lastY / lastY
| InputItX | standard iterator type of firstX and lastX. |
| InputItY | standard iterator type of firstY and lastY. |
| plotter | the plotter to which to add the resulting graph | |
| firstX | iterator pointing to the first x-position item in the dataset to use | |
| lastX | iterator pointing behind the last x-position item in the dataset to use | |
| firstY | iterator pointing to the first y-position item in the dataset to use | |
| lastY | iterator pointing behind the last y-position item in the dataset to use | |
| xbins | number of bins in x-direction (i.e. width of the output KDE) | |
| ybins | number of bins in y-direction (i.e. height of the output KDE) | |
| kernel | the kernel function to use (e.g. jkqtpstatKernel2DGaussian() ) | |
| bandwidthX | x-bandwidth used for the KDE | |
| bandwidthY | y-bandwidth used for the KDE | |
| kdecolumnBaseName | this string is used in building the column names for the KDE data columns | |
| [out] | oxmin | position of the first KDE bin in x-direction |
| [out] | oxmax | position of the last KDE bin in x-direction |
| [out] | oymin | position of the first KDE bin in y-direction |
| [out] | oymax | position of the last KDE bin in y-direction |
JKQTPColumnContourPlot ) displaying the KDE data as a contour plot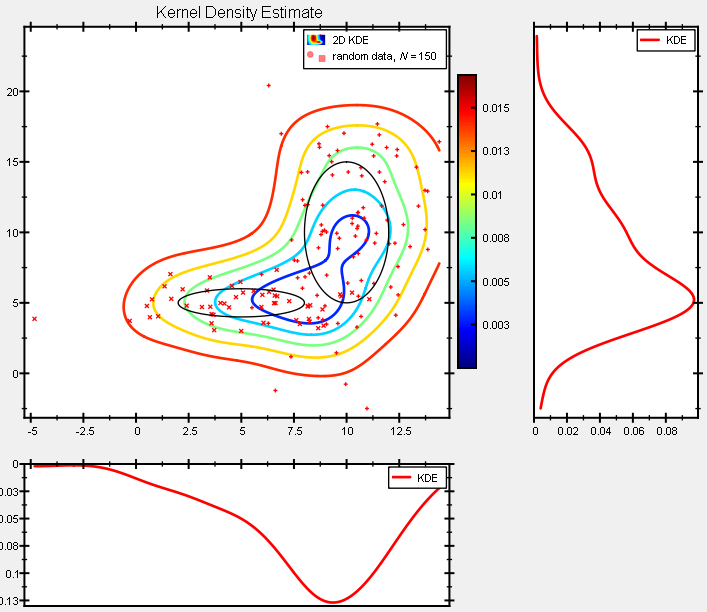
|
inline |
calculate calculate a 2-dimensional kernel density estimate (KDE) and add a JKQTPColumnMathImage to the given plotter, where the KDE is calculated from the given data range firstX / firstY ... lastY / lastY
| InputItX | standard iterator type of firstX and lastX. |
| InputItY | standard iterator type of firstY and lastY. |
| plotter | the plotter to which to add the resulting graph | |
| firstX | iterator pointing to the first x-position item in the dataset to use | |
| lastX | iterator pointing behind the last x-position item in the dataset to use | |
| firstY | iterator pointing to the first y-position item in the dataset to use | |
| lastY | iterator pointing behind the last y-position item in the dataset to use | |
| xbins | number of bins in x-direction (i.e. width of the output KDE) | |
| ybins | number of bins in y-direction (i.e. height of the output KDE) | |
| kernel | the kernel function to use (e.g. jkqtpstatKernel2DGaussian() ) | |
| bandwidthX | x-bandwidth used for the KDE | |
| bandwidthY | y-bandwidth used for the KDE | |
| kdecolumnBaseName | this string is used in building the column names for the KDE data columns | |
| [out] | oxmin | position of the first KDE bin in x-direction |
| [out] | oxmax | position of the last KDE bin in x-direction |
| [out] | oymin | position of the first KDE bin in y-direction |
| [out] | oymax | position of the last KDE bin in y-direction |
JKQTPColumnMathImage ) displaying the KDE data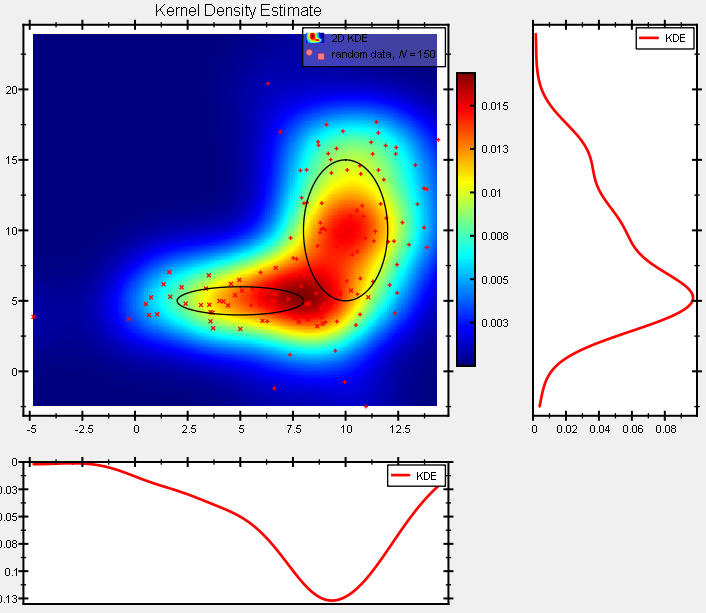
|
inline |
calculate the linear regression coefficients for a given data range firstX / firstY ... lastX / lastY where the model is
| InputItX | standard iterator type of firstX and lastX. |
| InputItY | standard iterator type of firstY and lastY. |
| plotter | the plotter to which to add the resulting graph | |
| firstX | iterator pointing to the first item in the x-dataset to use  | |
| lastX | iterator pointing behind the last item in the x-dataset to use  | |
| firstY | iterator pointing to the first item in the y-dataset to use  | |
| lastY | iterator pointing behind the last item in the y-dataset to use  | |
| [in,out] | coeffA | returns the offset of the linear model |
| [in,out] | coeffB | returns the slope of the linear model |
| fixA | if true, the offset coefficient  |
==true, You need to provide a value for A in coeffA | fixB | if true, the slope coefficient  |
==true, You need to provide a value for B in coeffB Example:
| JKQTPLOTTER_LIB_EXPORT JKQTPXFunctionLineGraph * jkqtpstatAddLinearRegression | ( | JKQTPXYGraph * | datagraph, |
| double * | coeffA = nullptr, | ||
| double * | coeffB = nullptr, | ||
| bool | fixA = false, | ||
| bool | fixB = false ) |
calculate the linear regression coefficients for a given data data used to draw any JKQTPXYGraph datagraph where the model is
| datagraph | graph representing the (x,y) datapairs to which to fit the regression line | |
| [in,out] | coeffA | returns the offset of the linear model |
| [in,out] | coeffB | returns the slope of the linear model |
| fixA | if true, the offset coefficient |
==true, You need to provide a value for A in coeffA | fixB | if true, the slope coefficient |
==true, You need to provide a value for B in coeffB Example:
|
inline |
calculate the weighted linear regression coefficients for a given for a given data range firstX / firstY / firstW ... lastX / lastY / lastW where the model is
| InputItX | standard iterator type of firstX and lastX. |
| InputItY | standard iterator type of firstY and lastY. |
| InputItW | standard iterator type of firstW and lastW. |
| plotter | the plotter to which to add the resulting graph | |
| firstX | iterator pointing to the first item in the x-dataset to use | |
| lastX | iterator pointing behind the last item in the x-dataset to use | |
| firstY | iterator pointing to the first item in the y-dataset to use | |
| lastY | iterator pointing behind the last item in the y-dataset to use | |
| firstW | iterator pointing to the first item in the weight-dataset to use  | |
| lastW | iterator pointing behind the last item in the weight-dataset to use  | |
| [in,out] | coeffA | returns the offset of the linear model |
| [in,out] | coeffB | returns the slope of the linear model |
| fixA | if true, the offset coefficient |
==true, You need to provide a value for A in coeffA | fixB | if true, the slope coefficient |
==true, You need to provide a value for B in coeffB | fWeightDataToWi | an optional function, which is applied to the data from firstW ... lastW to convert them to weight, i.e. wi=fWeightDataToWi(*itW) e.g. if you use data used to draw error bars, you can use jkqtp_inversePropSaveDefault(). The default is jkqtp_identity(), which just returns the values. In the case of jkqtp_inversePropSaveDefault(), a datapoint x,y, has a large weight, if it's error is small and in the case if jkqtp_identity() it's weight is directly proportional to the given value. |
Example:
| JKQTPLOTTER_LIB_EXPORT JKQTPXFunctionLineGraph * jkqtpstatAddLinearWeightedRegression | ( | JKQTPXYGraph * | datagraph, |
| double * | coeffA = nullptr, | ||
| double * | coeffB = nullptr, | ||
| bool | fixA = false, | ||
| bool | fixB = false ) |
calculate the linear weighted regression coefficients for a given data data used to draw any JKQTPXYGraph datagraph , which also implements JKQTPYGraphErrorData and where the model is
| datagraph | graph representing the (x,y,error) data triples to which to fit the regression line The errors are used as iverse weights! | |
| [in,out] | coeffA | returns the offset of the linear model |
| [in,out] | coeffB | returns the slope of the linear model |
| fixA | if true, the offset coefficient |
==true, You need to provide a value for A in coeffA | fixB | if true, the slope coefficient |
==true, You need to provide a value for B in coeffB Example:
|
inline |
fits (in a least-squares sense) a polynomial
| InputItX | standard iterator type of firstX and lastX. |
| InputItY | standard iterator type of firstY and lastY. |
| plotter | the plotter to which to add the resulting graph |
| firstX | iterator pointing to the first item in the x-dataset to use |
| lastX | iterator pointing behind the last item in the x-dataset to use |
| firstY | iterator pointing to the first item in the y-dataset to use |
| lastY | iterator pointing behind the last item in the y-dataset to use |
| P | degree of the polynomial (P>=N !!!) |
Example:
|
inline |
fits (in a least-squares sense) a polynomial
| InputItX | standard iterator type of firstX and lastX. |
| InputItY | standard iterator type of firstY and lastY. |
| OutputItP | output iterator for the polynomial coefficients |
| plotter | the plotter to which to add the resulting graph | |
| firstX | iterator pointing to the first item in the x-dataset to use | |
| lastX | iterator pointing behind the last item in the x-dataset to use | |
| firstY | iterator pointing to the first item in the y-dataset to use | |
| lastY | iterator pointing behind the last item in the y-dataset to use | |
| P | degree of the polynomial (P>=N !!!) | |
| [out] | firstRes | Iterator (of type OutputItP ), which receives the (P+1)-entry vector with the polynomial coefficients  |
Example:
| JKQTPLOTTER_LIB_EXPORT JKQTPXFunctionLineGraph * jkqtpstatAddPolyFit | ( | JKQTPXYGraph * | datagraph, |
| size_t | P ) |
fits (in a least-squares sense) a polynomial
| datagraph | graph representing the (x,y) datapairs to which to fit the regression line |
| P | degree of the polynomial (P>=N !!!) |
Example:
|
inline |
fits (in a least-squares sense) a polynomial
| OutputItP | output iterator for the polynomial coefficients |
| datagraph | graph representing the (x,y) datapairs to which to fit the regression line | |
| P | degree of the polynomial (P>=N !!!) | |
| [out] | firstRes | Iterator (of type OutputItP ), which receives the (P+1)-entry vector with the polynomial coefficients |
Example:
|
inline |
calculate the linear regression coefficients for a given data range firstX / firstY ... lastX / lastY where the model is defined by type
| InputItX | standard iterator type of firstX and lastX. |
| InputItY | standard iterator type of firstY and lastY. |
| plotter | the plotter to which to add the resulting graph | |
| type | model to be fitted | |
| firstX | iterator pointing to the first item in the x-dataset to use | |
| lastX | iterator pointing behind the last item in the x-dataset to use | |
| firstY | iterator pointing to the first item in the y-dataset to use | |
| lastY | iterator pointing behind the last item in the y-dataset to use | |
| [in,out] | coeffA | returns the offset of the linear model |
| [in,out] | coeffB | returns the slope of the linear model |
| fixA | if true, the offset coefficient |
==true, You need to provide a value for A in coeffA | fixB | if true, the slope coefficient |
==true, You need to provide a value for B in coeffB Example:
|
inline |
calculate the (robust) iteratively reweighted least-squares (IRLS) estimate for the parameters of the model
| InputItX | standard iterator type of firstX and lastX. |
| InputItY | standard iterator type of firstY and lastY. |
| plotter | the plotter to which to add the resulting graph | |
| firstX | iterator pointing to the first item in the x-dataset to use | |
| lastX | iterator pointing behind the last item in the x-dataset to use | |
| firstY | iterator pointing to the first item in the y-dataset to use | |
| lastY | iterator pointing behind the last item in the y-dataset to use | |
| [in,out] | coeffA | returns the offset of the linear model |
| [in,out] | coeffB | returns the slope of the linear model |
| fixA | if true, the offset coefficient |
==true, You need to provide a value for A in coeffA | fixB | if true, the slope coefficient |
==true, You need to provide a value for B in coeffB | p | regularization parameter, the optimization problem is formulated in the  |
| iterations | the number of iterations the IRLS algorithm performs |
Example:
| JKQTPLOTTER_LIB_EXPORT JKQTPXFunctionLineGraph * jkqtpstatAddRobustIRLSLinearRegression | ( | JKQTPXYGraph * | datagraph, |
| double * | coeffA = nullptr, | ||
| double * | coeffB = nullptr, | ||
| bool | fixA = false, | ||
| bool | fixB = false, | ||
| double | p = 1.1, | ||
| int | iterations = 100 ) |
calculate the (robust) iteratively reweighted least-squares (IRLS) estimate for the parameters of the model
| datagraph | graph representing the (x,y) datapairs to which to fit the regression line | |
| [in,out] | coeffA | returns the offset of the linear model |
| [in,out] | coeffB | returns the slope of the linear model |
| fixA | if true, the offset coefficient |
==true, You need to provide a value for A in coeffA | fixB | if true, the slope coefficient |
==true, You need to provide a value for B in coeffB | p | regularization parameter, the optimization problem is formulated in the |
| iterations | the number of iterations the IRLS algorithm performs |
Example:
|
inline |
calculate the (robust) iteratively reweighted least-squares (IRLS) estimate for the parameters where the model is defined by type for a given data range firstX / firstY ... lastX / lastY
| InputItX | standard iterator type of firstX and lastX. |
| InputItY | standard iterator type of firstY and lastY. |
| plotter | the plotter to which to add the resulting graph | |
| type | model to be fitted | |
| firstX | iterator pointing to the first item in the x-dataset to use | |
| lastX | iterator pointing behind the last item in the x-dataset to use | |
| firstY | iterator pointing to the first item in the y-dataset to use | |
| lastY | iterator pointing behind the last item in the y-dataset to use | |
| [in,out] | coeffA | returns the offset of the linear model |
| [in,out] | coeffB | returns the slope of the linear model |
| fixA | if true, the offset coefficient |
==true, You need to provide a value for A in coeffA | fixB | if true, the slope coefficient |
==true, You need to provide a value for B in coeffB | p | regularization parameter, the optimization problem is formulated in the |
| iterations | the number of iterations the IRLS algorithm performs |
Example:
| JKQTPLOTTER_LIB_EXPORT JKQTPXFunctionLineGraph * jkqtpstatAddRobustIRLSRegression | ( | JKQTPXYGraph * | datagraph, |
| JKQTPStatRegressionModelType | type, | ||
| double * | coeffA = nullptr, | ||
| double * | coeffB = nullptr, | ||
| bool | fixA = false, | ||
| bool | fixB = false, | ||
| double | p = 1.1, | ||
| int | iterations = 100 ) |
calculate the (robust) iteratively reweighted least-squares (IRLS) estimate for the parameters where the model is defined by type for a given data range firstX / firstY ... lastX / lastY
| datagraph | graph representing the (x,y) datapairs to which to fit the regression line | |
| type | model to be fitted | |
| [in,out] | coeffA | returns the offset of the linear model |
| [in,out] | coeffB | returns the slope of the linear model |
| fixA | if true, the offset coefficient |
==true, You need to provide a value for A in coeffA | fixB | if true, the slope coefficient |
==true, You need to provide a value for B in coeffB | p | regularization parameter, the optimization problem is formulated in the |
| iterations | the number of iterations the IRLS algorithm performs |
Example:
|
inline |
add a JKQTPBoxplotVerticalElement to the given plotter, where the boxplot values are calculated from the data range first ... last
| InputIt | standard iterator type of first and last. |
| plotter | the plotter to which to add the resulting graph | |
| first | iterator pointing to the first item in the dataset to use | |
| last | iterator pointing behind the last item in the dataset to use | |
| boxposX | x-coordinate of the boxplot | |
| quantile1Spec | specifies which quantile to calculate for qantile1 (range: 0..1) | |
| quantile2Spec | specifies which quantile to calculate for qantile2 (range: 0..1) | |
| minimumQuantile | specifies a quantile for the return value minimum (default is 0 for the real minimum, but you could e.g. use 0.05 for the 5% quantile!) | |
| maximumQuantile | specifies a quantile for the return value maximum (default is 1 for the real maximum, but you could e.g. use 0.95 for the 95% quantile!) | |
| [out] | statOutput | optionally returns the internally calculated statistics as a JKQTPStat5NumberStatistics |
Example:
|
inline |
add a JKQTPBoxplotVerticalElement and a JKQTPSingleColumnSymbolsGraph for outliers to the given plotter, where the boxplot values are calculated from the data range first ... last
| InputIt | standard iterator type of first and last. |
| plotter | the plotter to which to add the resulting graph | |
| first | iterator pointing to the first item in the dataset to use | |
| last | iterator pointing behind the last item in the dataset to use | |
| boxposX | x-coordinate of the outliers (and the boxplot) | |
| quantile1Spec | specifies which quantile to calculate for qantile1 (range: 0..1) | |
| quantile2Spec | specifies which quantile to calculate for qantile2 (range: 0..1) | |
| minimumQuantile | specifies a quantile for the return value minimum (default is 0.03, i.e. the 3% quantile!) | |
| maximumQuantile | specifies a quantile for the return value maximum (default is 0.97, i.e. the 97% quantile!) | |
| outliercolumnBaseName | this string is used in building the column names for the outlier columns | |
| [out] | statOutput | optionally returns the internally calculated statistics as a JKQTPStat5NumberStatistics |
Example:
|
inline |
create vertical boxplots of type JKQTPBoxplotVerticalGraph, from the 5-value-summary of groups in the input data, also adds a graph showing the outliers
| InputCatIt | standard iterator type of inFirstCat_X and inLastCat_X |
| InputValueIt | standard iterator type of inFirstValue_Y and inLastValue_Y |
| plotter | the plotter to which to add the resulting graph |
| inFirstCat_X | iterator pointing to the first item in the category dataset to use |
| inLastCat_X | iterator pointing behind the last item in the category dataset to use |
| inFirstValue_Y | iterator pointing to the first item in the category dataset to use |
| inLastValue_Y | iterator pointing behind the last item in the category dataset to use |
| quantile1Spec | specifies which quantile to calculate for qantile1 (range: 0..1) |
| quantile2Spec | specifies which quantile to calculate for qantile2 (range: 0..1) |
| minimumQuantile | specifies a quantile for the return value minimum (default is 0 for the real minimum, but you could e.g. use 0.05 for the 5% quantile!) |
| maximumQuantile | specifies a quantile for the return value maximum (default is 1 for the real maximum, but you could e.g. use 0.95 for the 95% quantile!) |
| groupDefFunc | assigns a group |
| columnBaseName | string component used to build the names of the columns generated by this function |
|
inline |
calculate an autoranged histogram and add a JKQTPBarHorizontalGraph to the given plotter, where the histogram is calculated from the data range first ... last, bins defined by their width
| InputIt | standard iterator type of first and last. |
| BinsInputIt | standard iterator type of binsFirst and binsLast. |
| plotter | the plotter to which to add the resulting graph |
| first | iterator pointing to the first item in the dataset to use |
| last | iterator pointing behind the last item in the dataset to use |
| binsFirst | iterator pointing to the first item in the set of histogram bins |
| binsLast | iterator pointing behind the last item in the set of histogram bins |
| histogramcolumnBaseName | this string is used in building the column names for the histogram columns |
| normalized | indicates whether the histogram has to be normalized |
| cummulative | if true, a cummulative histogram is calculated |
Example:
|
inline |
calculate an autoranged histogram and add a JKQTPBarHorizontalGraph to the given plotter, where the histogram is calculated from the data range first ... last, bins defined by their width
| InputIt | standard iterator type of first and last. |
| plotter | the plotter to which to add the resulting graph |
| first | iterator pointing to the first item in the dataset to use |
| last | iterator pointing behind the last item in the dataset to use |
| binWidth | width of the bins |
| histogramcolumnBaseName | this string is used in building the column names for the histogram columns |
| normalized | indicates whether the histogram has to be normalized |
| cummulative | if true, a cummulative histogram is calculated |
Example:
|
inline |
calculate an autoranged histogram and add a JKQTPBarHorizontalGraph to the given plotter, where the histogram is calculated from the data range first ... last, bins defined by their number
| InputIt | standard iterator type of first and last. |
| plotter | the plotter to which to add the resulting graph |
| first | iterator pointing to the first item in the dataset to use |
| last | iterator pointing behind the last item in the dataset to use |
| bins | number of bins in the resulting histogram |
| histogramcolumnBaseName | this string is used in building the column names for the histogram columns |
| normalized | indicates whether the histogram has to be normalized |
| cummulative | if true, a cummulative histogram is calculated |
Example:
|
inline |
calculate an autoranged vertical KDE and add a JKQTPXYLineGraph to the given plotter, where the KDE is calculated from the data range first ... last, bins defined by their width
| InputIt | standard iterator type of first and last. |
| BinsInputIt | standard iterator type of binsFirst and binsLast. |
| plotter | the plotter to which to add the resulting graph |
| first | iterator pointing to the first item in the dataset to use |
| last | iterator pointing behind the last item in the dataset to use |
| binsFirst | iterator pointing to the first item in the set of KDE bins |
| binsLast | iterator pointing behind the last item in the set of KDE bins |
| kernel | the kernel function to use (e.g. jkqtpstatKernel1DGaussian() ) |
| bandwidth | bandwidth used for the KDE |
| cummulative | if true, a cummulative KDE is calculated |
| KDEcolumnBaseName | this string is used in building the column names for the KDE data columns |
Example:
|
inline |
calculate an autoranged vertical KDE and add a JKQTPXYLineGraph to the given plotter, where the KDE is calculated from the data range first ... last, evaluation positions are given by the range binXLeft ... binXRight (in steps of binxDelta )
| InputIt | standard iterator type of first and last. |
| plotter | the plotter to which to add the resulting graph |
| first | iterator pointing to the first item in the dataset to use |
| last | iterator pointing behind the last item in the dataset to use |
| binXLeft | first x-position, where to evaluate the KDE |
| binXDelta | distance between two x-positions at which the KDE is evaluated |
| binXRight | last x-position, where to evaluate the KDE |
| kernel | the kernel function to use (e.g. jkqtpstatKernel1DGaussian() ) |
| bandwidth | bandwidth used for the KDE |
| cummulative | if true, a cummulative KDE is calculated |
| KDEcolumnBaseName | this string is used in building the column names for the KDE data columns |
Example:
|
inline |
calculate an autoranged vertical KDE and add a JKQTPXYLineGraph to the given plotter, where the KDE is calculated from the data range first ... last, bins defined by their width
| InputIt | standard iterator type of first and last. |
| plotter | the plotter to which to add the resulting graph |
| first | iterator pointing to the first item in the dataset to use |
| last | iterator pointing behind the last item in the dataset to use |
| binWidth | width of the bins |
| kernel | the kernel function to use (e.g. jkqtpstatKernel1DGaussian() ) |
| bandwidth | bandwidth used for the KDE |
| cummulative | if true, a cummulative KDE is calculated |
| KDEcolumnBaseName | this string is used in building the column names for the KDE data columns |
Example:
|
inline |
calculate an autoranged vertical KDE and add a JKQTPXYLineGraph to the given plotter, where the KDE is calculated from the data range first ... last, bins defined by their number
| InputIt | standard iterator type of first and last. |
| plotter | the plotter to which to add the resulting graph |
| first | iterator pointing to the first item in the dataset to use |
| last | iterator pointing behind the last item in the dataset to use |
| Nout | number of points in the resulting KDE |
| kernel | the kernel function to use (e.g. jkqtpstatKernel1DGaussian() ) |
| bandwidth | bandwidth used for the KDE |
| cummulative | if true, a cummulative KDE is calculated |
| KDEcolumnBaseName | this string is used in building the column names for the KDE data columns |
Example:
|
inline |
add a JKQTPViolinplotVerticalElement to the given plotter, where the Violinplot values are calculated from the data range first ... last , uses a histogram as density distribution estimate
| InputIt | standard iterator type of first and last. |
| plotter | the plotter to which to add the resulting graph |
| first | iterator pointing to the first item in the dataset to use |
| last | iterator pointing behind the last item in the dataset to use |
| violinposY | y-coordinate of the Violinplot |
| distBasename | name basing for added columns |
| violinDistSamples | number of bin of the distribution (between min and max) |
Example:

|
inline |
add a JKQTPViolinplotVerticalElement and an outliers graph to the given plotter, where the Violinplot values are calculated from the data range first ... last , uses a histogram as density distribution estimate
| InputIt | standard iterator type of first and last. |
| plotter | the plotter to which to add the resulting graph |
| first | iterator pointing to the first item in the dataset to use |
| last | iterator pointing behind the last item in the dataset to use |
| violinposY | y-coordinate of the Violinplot |
| minimumQuantile | specifies a quantile for the return value minimum (default is 0 for the real minimum, but you could e.g. use 0.05 for the 5% quantile!) |
| maximumQuantile | specifies a quantile for the return value maximum (default is 1 for the real maximum, but you could e.g. use 0.95 for the 95% quantile!) |
| distBasename | name basing for added columns |
| violinDistSamples | number of samples of the distribution (between min and max) |
Example:

|
inline |
add a JKQTPViolinplotVerticalElement to the given plotter, where the Violinplot values are calculated from the data range first ... last , uses a kernel density estimate as density distribution estimate
| InputIt | standard iterator type of first and last. |
| plotter | the plotter to which to add the resulting graph |
| first | iterator pointing to the first item in the dataset to use |
| last | iterator pointing behind the last item in the dataset to use |
| violinposY | y-coordinate of the Violinplot |
| kernel | the kernel function to use (e.g. jkqtpstatKernel1DGaussian() ) |
| bandwidth | bandwidth used for the KDE, if <0 then jkqtpstatEstimateKDEBandwidth(first,last) is called |
| distBasename | name basing for added columns |
| violinDistSamples | number of samples of the distribution (between min and max) |
Example:
|
inline |
add a JKQTPViolinplotVerticalElement and an outliers graph to the given plotter, where the Violinplot values are calculated from the data range first ... last , uses a kernel density estimate as density distribution estimate
| InputIt | standard iterator type of first and last. |
| plotter | the plotter to which to add the resulting graph |
| first | iterator pointing to the first item in the dataset to use |
| last | iterator pointing behind the last item in the dataset to use |
| violinposY | y-coordinate of the Violinplot |
| kernel | the kernel function to use (e.g. jkqtpstatKernel1DGaussian() ) |
| bandwidth | bandwidth used for the KDE, if <0 then jkqtpstatEstimateKDEBandwidth(first,last) is called |
| minimumQuantile | specifies a quantile for the return value minimum (default is 0 for the real minimum, but you could e.g. use 0.05 for the 5% quantile!) |
| maximumQuantile | specifies a quantile for the return value maximum (default is 1 for the real maximum, but you could e.g. use 0.95 for the 95% quantile!) |
| distBasename | name basing for added columns |
| violinDistSamples | number of samples of the distribution (between min and max) |
Example:

|
inline |
calculate the weighted linear regression coefficients for a given for a given data range firstX / firstY / firstW ... lastX / lastY / lastW where the model is defined by type
| InputItX | standard iterator type of firstX and lastX. |
| InputItY | standard iterator type of firstY and lastY. |
| InputItW | standard iterator type of firstW and lastW. |
| plotter | the plotter to which to add the resulting graph | |
| type | model to be fitted | |
| firstX | iterator pointing to the first item in the x-dataset to use | |
| lastX | iterator pointing behind the last item in the x-dataset to use | |
| firstY | iterator pointing to the first item in the y-dataset to use | |
| lastY | iterator pointing behind the last item in the y-dataset to use | |
| firstW | iterator pointing to the first item in the weight-dataset to use | |
| lastW | iterator pointing behind the last item in the weight-dataset to use | |
| [in,out] | coeffA | returns the offset of the linear model |
| [in,out] | coeffB | returns the slope of the linear model |
| fixA | if true, the offset coefficient |
==true, You need to provide a value for A in coeffA | fixB | if true, the slope coefficient |
==true, You need to provide a value for B in coeffB | fWeightDataToWi | an optional function, which is applied to the data from firstW ... lastW to convert them to weight, i.e. wi=fWeightDataToWi(*itW) e.g. if you use data used to draw error bars, you can use jkqtp_inversePropSaveDefault(). The default is jkqtp_identity(), which just returns the values. In the case of jkqtp_inversePropSaveDefault(), a datapoint x,y, has a large weight, if it's error is small and in the case if jkqtp_identity() it's weight is directly proportional to the given value. |
Example:
| JKQTPLOTTER_LIB_EXPORT JKQTPXFunctionLineGraph * jkqtpstatAddWeightedRegression | ( | JKQTPXYGraph * | datagraph, |
| JKQTPStatRegressionModelType | type, | ||
| double * | coeffA = nullptr, | ||
| double * | coeffB = nullptr, | ||
| bool | fixA = false, | ||
| bool | fixB = false ) |
calculate the linear weighted regression coefficients for a given data data used to draw any JKQTPXYGraph datagraph , which also implements JKQTPYGraphErrorData and where the model is defined by type
| datagraph | graph representing the (x,y,error) data triples to which to fit the regression line The errors are used as iverse weights! | |
| type | model to be fitted | |
| [in,out] | coeffA | returns the offset of the linear model |
| [in,out] | coeffB | returns the slope of the linear model |
| fixA | if true, the offset coefficient |
==true, You need to provide a value for A in coeffA | fixB | if true, the slope coefficient |
==true, You need to provide a value for B in coeffB Example:
|
inline |
create a JKQTPBarHorizontalErrorGraph with x-direction error bars, calculated from average +/- stddev of groups in the input data
| InputCatIt | standard iterator type of inFirstCat_Y and inLastCat_Y |
| InputValueIt | standard iterator type of inFirstValue_Y and inLastValue_Y |
| plotter | the plotter to which to add the resulting graph |
| inFirstCat_Y | iterator pointing to the first item in the category dataset to use |
| inLastCat_Y | iterator pointing behind the last item in the category dataset to use |
| inFirstValue_Y | iterator pointing to the first item in the category dataset to use |
| inLastValue_Y | iterator pointing behind the last item in the category dataset to use |
| groupDefFunc | assigns a group |
| columnBaseName | string component used to build the names of the columns generated by this function |

|
inline |
create a JKQTPFilledCurveXErrorGraph with x-direction error bars, calculated from average +/- stddev of groups in the input data
| InputCatIt | standard iterator type of inFirstCat_Y and inLastCat_Y |
| InputValueIt | standard iterator type of inFirstValue_Y and inLastValue_Y |
| plotter | the plotter to which to add the resulting graph |
| inFirstCat_Y | iterator pointing to the first item in the category dataset to use |
| inLastCat_Y | iterator pointing behind the last item in the category dataset to use |
| inFirstValue_Y | iterator pointing to the first item in the category dataset to use |
| inLastValue_Y | iterator pointing behind the last item in the category dataset to use |
| groupDefFunc | assigns a group |
| columnBaseName | string component used to build the names of the columns generated by this function |
|
inline |
create a plot with x-direction error bars, calculated from average +/- stddev of groups in the input data
| TGraph | type of graph that should be added to the plot |
| InputCatIt | standard iterator type of inFirstCat_Y and inLastCat_Y |
| InputValueIt | standard iterator type of inFirstValue_Y and inLastValue_Y |
| plotter | the plotter to which to add the resulting graph |
| inFirstCat_Y | iterator pointing to the first item in the category dataset to use |
| inLastCat_Y | iterator pointing behind the last item in the category dataset to use |
| inFirstValue_Y | iterator pointing to the first item in the category dataset to use |
| inLastValue_Y | iterator pointing behind the last item in the category dataset to use |
| groupDefFunc | assigns a group |
| columnBaseName | string component used to build the names of the columns generated by this function |
|
inline |
create a JKQTPImpulsesHorizontalErrorGraph with x-direction error bars, calculated from average +/- stddev of groups in the input data
| InputCatIt | standard iterator type of inFirstCat_Y and inLastCat_Y |
| InputValueIt | standard iterator type of inFirstValue_Y and inLastValue_Y |
| plotter | the plotter to which to add the resulting graph |
| inFirstCat_Y | iterator pointing to the first item in the category dataset to use |
| inLastCat_Y | iterator pointing behind the last item in the category dataset to use |
| inFirstValue_Y | iterator pointing to the first item in the category dataset to use |
| inLastValue_Y | iterator pointing behind the last item in the category dataset to use |
| groupDefFunc | assigns a group |
| columnBaseName | string component used to build the names of the columns generated by this function |
|
inline |
create a JKQTPXYLineErrorGraph with x-direction error bars, calculated from average +/- stddev of groups in the input data
| InputCatIt | standard iterator type of inFirstCat_Y and inLastCat_Y |
| InputValueIt | standard iterator type of inFirstValue_Y and inLastValue_Y |
| plotter | the plotter to which to add the resulting graph |
| inFirstCat_Y | iterator pointing to the first item in the category dataset to use |
| inLastCat_Y | iterator pointing behind the last item in the category dataset to use |
| inFirstValue_Y | iterator pointing to the first item in the category dataset to use |
| inLastValue_Y | iterator pointing behind the last item in the category dataset to use |
| groupDefFunc | assigns a group |
| columnBaseName | string component used to build the names of the columns generated by this function |
|
inline |
create a JKQTPXYParametrizedErrorScatterGraph with x-direction error bars, calculated from average +/- stddev of groups in the input data
| InputCatIt | standard iterator type of inFirstCat_Y and inLastCat_Y |
| InputValueIt | standard iterator type of inFirstValue_Y and inLastValue_Y |
| plotter | the plotter to which to add the resulting graph |
| inFirstCat_Y | iterator pointing to the first item in the category dataset to use |
| inLastCat_Y | iterator pointing behind the last item in the category dataset to use |
| inFirstValue_Y | iterator pointing to the first item in the category dataset to use |
| inLastValue_Y | iterator pointing behind the last item in the category dataset to use |
| groupDefFunc | assigns a group |
| columnBaseName | string component used to build the names of the columns generated by this function |
|
inline |
create a plot with x- and y-direction error bars, calculated from directional average +/- stddev of groups in the input data
| TGraph | type of graph that should be added to the plot |
| InputCatIt | standard iterator type of inFirstCat_X and inLastCat_X |
| InputValueIt | standard iterator type of inFirstValue_Y and inLastValue_Y |
| plotter | the plotter to which to add the resulting graph |
| inFirstCat_X | iterator pointing to the first item in the category dataset to use |
| inLastCat_X | iterator pointing behind the last item in the category dataset to use |
| inFirstValue_Y | iterator pointing to the first item in the category dataset to use |
| inLastValue_Y | iterator pointing behind the last item in the category dataset to use |
| groupDefFunc | assigns a group |
| columnBaseName | string component used to build the names of the columns generated by this function |
|
inline |
create a JKQTPXYLineErrorGraph with y-direction error bars, calculated from average +/- stddev of groups in the input data
| InputCatIt | standard iterator type of inFirstCat_X and inLastCat_X |
| InputValueIt | standard iterator type of inFirstValue_Y and inLastValue_Y |
| plotter | the plotter to which to add the resulting graph |
| inFirstCat_X | iterator pointing to the first item in the category dataset to use |
| inLastCat_X | iterator pointing behind the last item in the category dataset to use |
| inFirstValue_Y | iterator pointing to the first item in the category dataset to use |
| inLastValue_Y | iterator pointing behind the last item in the category dataset to use |
| groupDefFunc | assigns a group |
| columnBaseName | string component used to build the names of the columns generated by this function |
|
inline |
create a JKQTPXYParametrizedErrorScatterGraph with y-direction error bars, calculated from average +/- stddev of groups in the input data
| InputCatIt | standard iterator type of inFirstCat_X and inLastCat_X |
| InputValueIt | standard iterator type of inFirstValue_Y and inLastValue_Y |
| plotter | the plotter to which to add the resulting graph |
| inFirstCat_X | iterator pointing to the first item in the category dataset to use |
| inLastCat_X | iterator pointing behind the last item in the category dataset to use |
| inFirstValue_Y | iterator pointing to the first item in the category dataset to use |
| inLastValue_Y | iterator pointing behind the last item in the category dataset to use |
| groupDefFunc | assigns a group |
| columnBaseName | string component used to build the names of the columns generated by this function |
|
inline |
create a JKQTPBarVerticalErrorGraph with y-direction error bars, calculated from average +/- stddev of groups in the input data
| InputCatIt | standard iterator type of inFirstCat_X and inLastCat_X |
| InputValueIt | standard iterator type of inFirstValue_Y and inLastValue_Y |
| plotter | the plotter to which to add the resulting graph |
| inFirstCat_X | iterator pointing to the first item in the category dataset to use |
| inLastCat_X | iterator pointing behind the last item in the category dataset to use |
| inFirstValue_Y | iterator pointing to the first item in the category dataset to use |
| inLastValue_Y | iterator pointing behind the last item in the category dataset to use |
| groupDefFunc | assigns a group |
| columnBaseName | string component used to build the names of the columns generated by this function |
|
inline |
create a JKQTPFilledCurveYErrorGraph with y-direction error bars, calculated from average +/- stddev of groups in the input data
| InputCatIt | standard iterator type of inFirstCat_X and inLastCat_X |
| InputValueIt | standard iterator type of inFirstValue_Y and inLastValue_Y |
| plotter | the plotter to which to add the resulting graph |
| inFirstCat_X | iterator pointing to the first item in the category dataset to use |
| inLastCat_X | iterator pointing behind the last item in the category dataset to use |
| inFirstValue_Y | iterator pointing to the first item in the category dataset to use |
| inLastValue_Y | iterator pointing behind the last item in the category dataset to use |
| groupDefFunc | assigns a group |
| columnBaseName | string component used to build the names of the columns generated by this function |
|
inline |
create a plot with y-direction error bars, calculated from average +/- stddev of groups in the input data
| TGraph | type of graph that should be added to the plot |
| InputCatIt | standard iterator type of inFirstCat_X and inLastCat_X |
| InputValueIt | standard iterator type of inFirstValue_Y and inLastValue_Y |
| plotter | the plotter to which to add the resulting graph |
| inFirstCat_X | iterator pointing to the first item in the category dataset to use |
| inLastCat_X | iterator pointing behind the last item in the category dataset to use |
| inFirstValue_Y | iterator pointing to the first item in the category dataset to use |
| inLastValue_Y | iterator pointing behind the last item in the category dataset to use |
| groupDefFunc | assigns a group |
| columnBaseName | string component used to build the names of the columns generated by this function |
|
inline |
create a JKQTPImpulsesVerticalErrorGraph with y-direction error bars, calculated from average +/- stddev of groups in the input data
| InputCatIt | standard iterator type of inFirstCat_X and inLastCat_X |
| InputValueIt | standard iterator type of inFirstValue_Y and inLastValue_Y |
| plotter | the plotter to which to add the resulting graph |
| inFirstCat_X | iterator pointing to the first item in the category dataset to use |
| inLastCat_X | iterator pointing behind the last item in the category dataset to use |
| inFirstValue_Y | iterator pointing to the first item in the category dataset to use |
| inLastValue_Y | iterator pointing behind the last item in the category dataset to use |
| groupDefFunc | assigns a group |
| columnBaseName | string component used to build the names of the columns generated by this function |
|
inline |
create a JKQTPXYLineErrorGraph with y-direction error bars, calculated from average +/- stddev of groups in the input data
| InputCatIt | standard iterator type of inFirstCat_X and inLastCat_X |
| InputValueIt | standard iterator type of inFirstValue_Y and inLastValue_Y |
| plotter | the plotter to which to add the resulting graph |
| inFirstCat_X | iterator pointing to the first item in the category dataset to use |
| inLastCat_X | iterator pointing behind the last item in the category dataset to use |
| inFirstValue_Y | iterator pointing to the first item in the category dataset to use |
| inLastValue_Y | iterator pointing behind the last item in the category dataset to use |
| groupDefFunc | assigns a group |
| columnBaseName | string component used to build the names of the columns generated by this function |
|
inline |
create a JKQTPXYParametrizedErrorScatterGraph with y-direction error bars, calculated from average +/- stddev of groups in the input data
| InputCatIt | standard iterator type of inFirstCat_X and inLastCat_X |
| InputValueIt | standard iterator type of inFirstValue_Y and inLastValue_Y |
| plotter | the plotter to which to add the resulting graph |
| inFirstCat_X | iterator pointing to the first item in the category dataset to use |
| inLastCat_X | iterator pointing behind the last item in the category dataset to use |
| inFirstValue_Y | iterator pointing to the first item in the category dataset to use |
| inLastValue_Y | iterator pointing behind the last item in the category dataset to use |
| groupDefFunc | assigns a group |
| columnBaseName | string component used to build the names of the columns generated by this function |
|
inline |
create vertical boxplots of type JKQTPBoxplotVerticalGraph, from the 5-value-summary of groups in the input data
| InputCatIt | standard iterator type of inFirstCat_Y and inLastCat_Y |
| InputValueIt | standard iterator type of inFirstValue_X and inLastValue_X |
| plotter | the plotter to which to add the resulting graph |
| inFirstCat_Y | iterator pointing to the first item in the category dataset to use |
| inLastCat_Y | iterator pointing behind the last item in the category dataset to use |
| inFirstValue_X | iterator pointing to the first item in the category dataset to use |
| inLastValue_X | iterator pointing behind the last item in the category dataset to use |
| quantile1Spec | specifies which quantile to calculate for qantile1 (range: 0..1) |
| quantile2Spec | specifies which quantile to calculate for qantile2 (range: 0..1) |
| minimumQuantile | specifies a quantile for the return value minimum (default is 0 for the real minimum, but you could e.g. use 0.05 for the 5% quantile!) |
| maximumQuantile | specifies a quantile for the return value maximum (default is 1 for the real maximum, but you could e.g. use 0.95 for the 95% quantile!) |
| groupDefFunc | assigns a group |
| columnBaseName | string component used to build the names of the columns generated by this function |