JKQTPlotter trunk/v5.0.0
an extensive Qt5+Qt6 Plotter framework (including a feature-richt plotter widget, a speed-optimized, but limited variant and a LaTeX equation renderer!), written fully in C/C++ and without external dependencies
Loading...
Searching...
No Matches
Example (JKQTPlotter): Violin Plots

This project (see violinplot demonstrates how to use JKQTPlotter to draw violin plots using the classes JKQTPViolinplotVerticalElement and JKQTPViolinplotHorizontalElement. Violin plots can be thought of as an extension to box plots, as they are also used to represent the distribution of a random variable, but contain more info than the "simple" 5-number statistics used for boxplots: Violin Plots show an estimate of the desnsity distribution of the random vriable, e.g. calculated as a kernel density estimate, or as a simple histogram. The Plotting classes themselves do not calculate these estimates, but only draw them into the plot. The density estimates are calculated by functions from the JKQTPlotter Statistics Library.

The source code of the main application is (see violinplot.cpp.

Generating a test Dataset

First we generate some random numbers from a bimodal distribution (and as a by-product also from two single-distributions that form the bimodal):

size_t randomdatacol1=datastore1->addColumn("random data N(1,1)+N(6,2)");
size_t randomdatacol2=datastore1->addColumn("random data N(1,1)");
size_t randomdatacol3=datastore1->addColumn("random data N(6,2)");
std::random_device rd; // random number generators:
std::mt19937 gen{rd()};
std::uniform_int_distribution<> ddecide(0,1);
std::normal_distribution<> d1{1,1};
std::normal_distribution<> d2{6,2};
for (size_t i=0; i<50; i++) {
double v=0;
if (i%2==0) {
v=d1(gen);
datastore1->appendToColumn(randomdatacol2, v);
} else {
v=d2(gen);
datastore1->appendToColumn(randomdatacol3, v);
}
datastore1->appendToColumn(randomdatacol1, v);
}

Visualizing data as a Rug Plot

Samples from the bimodal (built from two gaussian distributions d1 and d2) are collected in randomdatacol1, whereas randomdatacol2 and randomdatacol3 collect those numbers that were drawn from d1 or d2 respectively.

Such data can be visualized by JKQTPSingleColumnSymbolsGraph, here using a rug plot (using gData1->setPositionScatterStyle(JKQTPSingleColumnSymbolsGraph::RugPlot); ... but also e.g. a ee swarm plot would be possible):

plot->addGraph(gData1=new JKQTPSingleColumnSymbolsGraph(plot));
gData1->setPosition(0);
gData1->setDataColumn(randomdatacol1);
void setDataColumn(int __value)
the column that contains the datapoints
@ Y
the data for a JKQTPSingleColumnGraph is data belonging to the y-axis of the plot
void setDataDirection(DataDirection __value)
interpret the data from dataColumn either as X- or Y-data
plots a 1-column set of data-values with symbols onto a JKQtPlotter/JKQtBasePlotter....
Definition jkqtpsinglecolumnsymbols.h:53
@ RugPlot
like NoScatter but draws each data-point as a horzintal/vertical line, centered around position,...
Definition jkqtpsinglecolumnsymbols.h:59
void setPosition(double __value)
missing coordinate, i.e. if the data from dataColumn is interpreted as x-values, this is the y-positi...
void setPositionScatterStyle(ScatterStyle __value)
how to distribute the datapoints from dataColumn at the location position

Drawing the (vertical) Violin Plot

Now we need to calculate the kernel density estimate from the data in randomdatacol1 and store the result in two new columns cViol1Cat and cViol1Freq:

size_t cViol1Cat=datastore1->addColumn("violin 1, cat");
size_t cViol1Freq=datastore1->addColumn("violin 1, KDE");
jkqtpstatKDE1DAutoranged(datastore1->begin(randomdatacol1), datastore1->end(randomdatacol1),
datastore1->backInserter(cViol1Cat), datastore1->backInserter(cViol1Freq),
jkqtpstatEstimateKDEBandwidth(datastore1->begin(randomdatacol1), datastore1->end(randomdatacol1)));
double jkqtpstatKernel1DEpanechnikov(double t)
a 1D Epanechnikov kernel function, e.g. for Kernel Density Estimation
Definition jkqtpstatkde.h:77
void jkqtpstatKDE1DAutoranged(InputIt first, InputIt last, OutputIt KDEXOut, OutputIt KDEYOut, int Nout=100, const std::function< double(double)> &kernel=std::function< double(double)>(&jkqtpstatKernel1DGaussian), double bandwidth=1.0, bool cummulative=false)
calculate an autoranged 1-dimensional Kernel Density Estimation (KDE) from the given data range first...
Definition jkqtpstatkde.h:255
double jkqtpstatEstimateKDEBandwidth(InputIt first, InputIt last)
estimates a bandwidth for a Kernel Density Estimator (KDE) of the given data first ....
Definition jkqtpstatkde.h:192

Finally we can add a JKQTPViolinplotVerticalElement to the plot and provide it with the kernel density estimate from above and with some additional statistical properties (minimum, maximum, average and median) of the dataset:

plot->addGraph(gViol1=new JKQTPViolinplotVerticalElement(plot));
gViol1->setPos(2);
gViol1->setMin(jkqtpstatMinimum(datastore1->begin(randomdatacol1), datastore1->end(randomdatacol1)));
gViol1->setMax(jkqtpstatMaximum(datastore1->begin(randomdatacol1), datastore1->end(randomdatacol1)));
gViol1->setMean(jkqtpstatAverage(datastore1->begin(randomdatacol1), datastore1->end(randomdatacol1)));
gViol1->setMedian(jkqtpstatMedian(datastore1->begin(randomdatacol1), datastore1->end(randomdatacol1)));
gViol1->setViolinPositionColumn(cViol1Cat);
gViol1->setViolinFrequencyColumn(cViol1Freq);
gViol1->setColor(gData1->getSymbolColor());
QColor getSymbolColor() const
set the color of the graph symbols
@ SmoothViolin
connect all violin points by lines, resulting in a (nearly) smooth curve
Definition jkqtpviolinplotstylingmixins.h:304
void setViolinStyle(ViolinStyle style)
set the style of the violin plot
@ ViolinBoth
draw violin on the left+right or top+bottom side
Definition jkqtpviolinplotstylingmixins.h:320
void setViolinPositionMode(ViolinPositionMode positionMode)
set the position mode of the violin plot
void setMax(double __value)
the maximum value to be used for the boxplot
void setPos(double __value)
the position of the boxplot on the "other" axis
void setViolinPositionColumn(int __value)
column with data for the violin outline: category values (along min-max-axis)
void setMin(double __value)
the minimum value to be used for the boxplot
virtual void setColor(QColor c)
set the color of the graph (colors all elements, based on the given color c )
void setMedian(double __value)
the median value to be used for the boxplot
void setMean(double __value)
the mean value to be used for the boxplot
void setViolinFrequencyColumn(int __value)
column with data for the violin outline: frequency values (perpendicular to min-max-axis)
This implements a single vertical Violin Plot as a "geometric element".
Definition jkqtpviolinplot.h:166
double jkqtpstatMedian(InputIt first, InputIt last, size_t *Noutput=nullptr)
calculates the median of a given data range first ... last
Definition jkqtpstatbasics.h:868
double jkqtpstatAverage(InputIt first, InputIt last, size_t *Noutput=nullptr)
calculates the average of a given data range first ... last
Definition jkqtpstatbasics.h:62
double jkqtpstatMaximum(InputIt first, InputIt last, InputIt *maxPos=nullptr, size_t *Noutput=nullptr)
calculates the maximum value in the given data range first ... last
Definition jkqtpstatbasics.h:265
double jkqtpstatMinimum(InputIt first, InputIt last, InputIt *minPos=nullptr, size_t *Noutput=nullptr)
calculates the minimum value in the given data range first ... last
Definition jkqtpstatbasics.h:223

The center of the gData1 was set to 0 and the center of the violin plot is set to 2. With JKQTPViolinplotVerticalElement::setViolinStyle() you can choose the style of the violin plot and with JKQTPViolinplotVerticalElement::setViolinPositionMode() you can select whether the density estimate should be displayed on the left, the right or on both sides of the center-line.

The result looks like this, if we use the same method as above to calculate also the violin plots for randomdatacol2 and randomdatacol3:

violinplot_vert

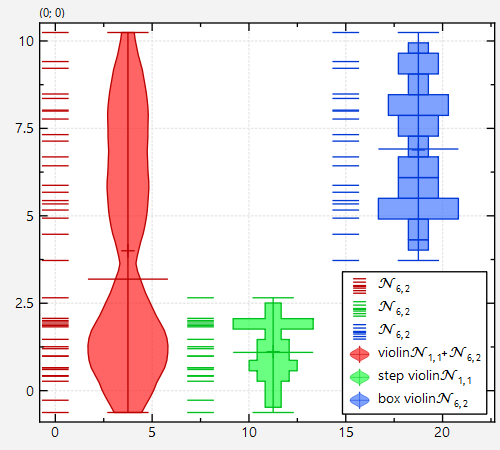
Note that we set different styles for the three plots with:

gViol2->setViolinStyle(JKQTPGraphViolinplotStyleMixin::StepViolin); // green plot
gViol3->setViolinStyle(JKQTPGraphViolinplotStyleMixin::BoxViolin); // blue plot
@ StepViolin
connect violin points by a steped line, but fully filled
Definition jkqtpviolinplotstylingmixins.h:305
@ BoxViolin
violin datapoints are drawn like a boxplot
Definition jkqtpviolinplotstylingmixins.h:306

Also for the green and blue plot, we did not calculate a kernel density estimate, but rather a simple histogram:

size_t cViol2Cat=datastore1->addColumn("violin 2, cat");
size_t cViol2Freq=datastore1->addColumn("violin 2, Histogram");
jkqtpstatHistogram1DAutoranged(datastore1->begin(randomdatacol2), datastore1->end(randomdatacol2),
datastore1->backInserter(cViol2Cat), datastore1->backInserter(cViol2Freq),
void jkqtpstatHistogram1DAutoranged(InputIt first, InputIt last, OutputIt histogramXOut, OutputIt histogramYOut, int bins=11, bool normalized=true, bool cummulative=false, JKQTPStatHistogramBinXMode binXMode=JKQTPStatHistogramBinXMode::XIsLeft)
calculate an autoranged 1-dimensional histogram from the given data range first .....
Definition jkqtpstathistogram.h:73
@ XIsMid
x-location is the middle of the bin

Drawing a horizontal Violin Plot

Finally note that if you use JKQTPViolinplotHorizontalElement instead of the JKQTPViolinplotVerticalElement used above, you can also draw horizontal violin plots:

violinplot_hor

Adapters as shortcuts to drawing Violin Plots

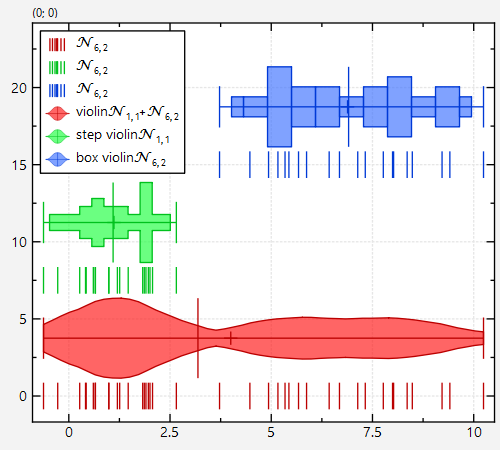
Note that there also exist "adapters" that allow to draw violin plots in one line of code:

jkqtpstatAddVViolinplotHistogramAndOutliers(plot->getPlotter(), datastore1->begin(randomdatacol1), datastore1->end(randomdatacol1), -5);
jkqtpstatAddHViolinplotHistogramAndOutliers(plot->getPlotter(), datastore1->begin(randomdatacol1), datastore1->end(randomdatacol1), -5);
jkqtpstatAddVViolinplotHistogram(plot->getPlotter(), datastore1->begin(randomdatacol1), datastore1->end(randomdatacol1), -10);
jkqtpstatAddHViolinplotHistogram(plot->getPlotter(), datastore1->begin(randomdatacol1), datastore1->end(randomdatacol1), -10);
jkqtpstatAddVViolinplotKDEAndOutliers(plot->getPlotter(), datastore1->begin(randomdatacol1), datastore1->end(randomdatacol1), -15);
jkqtpstatAddHViolinplotKDEAndOutliers(plot->getPlotter(), datastore1->begin(randomdatacol1), datastore1->end(randomdatacol1), -15);
jkqtpstatAddVViolinplotKDE(plot->getPlotter(), datastore1->begin(randomdatacol1), datastore1->end(randomdatacol1), -20);
jkqtpstatAddHViolinplotKDE(plot->getPlotter(), datastore1->begin(randomdatacol1), datastore1->end(randomdatacol1), -20);
std::pair< JKQTPViolinplotHorizontalElement *, JKQTPSingleColumnSymbolsGraph * > jkqtpstatAddHViolinplotKDEAndOutliers(JKQTBasePlotter *plotter, InputIt first, InputIt last, double violinposY, const std::function< double(double)> &kernel=std::function< double(double)>(&jkqtpstatKernel1DGaussian), double bandwidth=-1, double minimumQuantile=0.03, double maximumQuantile=0.97, const QString &distBasename=QString("violin plot distribution"), int violinDistSamples=100)
add a JKQTPViolinplotHorizontalElement and an outliers graph to the given plotter,...
Definition jkqtpstatisticsadaptors.h:490
std::pair< JKQTPViolinplotVerticalElement *, JKQTPSingleColumnSymbolsGraph * > jkqtpstatAddVViolinplotHistogramAndOutliers(JKQTBasePlotter *plotter, InputIt first, InputIt last, double violinposY, double minimumQuantile=0.03, double maximumQuantile=0.97, const QString &distBasename=QString("violin plot distribution"), int violinDistSamples=21)
add a JKQTPViolinplotVerticalElement and an outliers graph to the given plotter, where the Violinplot...
Definition jkqtpstatisticsadaptors.h:744
JKQTPViolinplotHorizontalElement * jkqtpstatAddHViolinplotHistogram(JKQTBasePlotter *plotter, InputIt first, InputIt last, double violinposY, const QString &distBasename=QString("violin plot distribution"), int violinDistSamples=21)
add a JKQTPViolinplotHorizontalElement to the given plotter, where the Violinplot values are calculat...
Definition jkqtpstatisticsadaptors.h:334
JKQTPViolinplotVerticalElement * jkqtpstatAddVViolinplotKDE(JKQTBasePlotter *plotter, InputIt first, InputIt last, double violinposY, const std::function< double(double)> &kernel=std::function< double(double)>(&jkqtpstatKernel1DGaussian), double bandwidth=-1, const QString &distBasename=QString("violin plot distribution"), int violinDistSamples=100)
add a JKQTPViolinplotVerticalElement to the given plotter, where the Violinplot values are calculated...
Definition jkqtpstatisticsadaptors.h:384
JKQTPViolinplotHorizontalElement * jkqtpstatAddHViolinplotKDE(JKQTBasePlotter *plotter, InputIt first, InputIt last, double violinposY, const std::function< double(double)> &kernel=std::function< double(double)>(&jkqtpstatKernel1DGaussian), double bandwidth=-1, const QString &distBasename=QString("violin plot distribution"), int violinDistSamples=100)
add a JKQTPViolinplotHorizontalElement to the given plotter, where the Violinplot values are calculat...
Definition jkqtpstatisticsadaptors.h:286
JKQTPViolinplotVerticalElement * jkqtpstatAddVViolinplotHistogram(JKQTBasePlotter *plotter, InputIt first, InputIt last, double violinposY, const QString &distBasename=QString("violin plot distribution"), int violinDistSamples=21)
add a JKQTPViolinplotVerticalElement to the given plotter, where the Violinplot values are calculated...
Definition jkqtpstatisticsadaptors.h:432
std::pair< JKQTPViolinplotVerticalElement *, JKQTPSingleColumnSymbolsGraph * > jkqtpstatAddVViolinplotKDEAndOutliers(JKQTBasePlotter *plotter, InputIt first, InputIt last, double violinposY, const std::function< double(double)> &kernel=std::function< double(double)>(&jkqtpstatKernel1DGaussian), double bandwidth=-1, double minimumQuantile=0.03, double maximumQuantile=0.97, const QString &distBasename=QString("violin plot distribution"), int violinDistSamples=100)
add a JKQTPViolinplotVerticalElement and an outliers graph to the given plotter, where the Violinplot...
Definition jkqtpstatisticsadaptors.h:661
std::pair< JKQTPViolinplotHorizontalElement *, JKQTPSingleColumnSymbolsGraph * > jkqtpstatAddHViolinplotHistogramAndOutliers(JKQTBasePlotter *plotter, InputIt first, InputIt last, double violinposY, double minimumQuantile=0.03, double maximumQuantile=0.97, const QString &distBasename=QString("violin plot distribution"), int violinDistSamples=21)
add a JKQTPViolinplotHorizontalElement and an outliers graph to the given plotter,...
Definition jkqtpstatisticsadaptors.h:573