|
JKQTPlotter trunk/v5.0.0
an extensive Qt5+Qt6 Plotter framework (including a feature-richt plotter widget, a speed-optimized, but limited variant and a LaTeX equation renderer!), written fully in C/C++ and without external dependencies
|
|
JKQTPlotter trunk/v5.0.0
an extensive Qt5+Qt6 Plotter framework (including a feature-richt plotter widget, a speed-optimized, but limited variant and a LaTeX equation renderer!), written fully in C/C++ and without external dependencies
|
This tutorial project (see ./examples/datastore_statistics/) explains several advanced functions of JKQTPDatastore in combination with the [JKQTPlotter Statistics Library] conatined in JKQTPlotter.
Note that there are additional tutorial explaining other aspects of data mangement in JKQTPDatastore:
The source code of the main application can be found in datastore_statistics.cpp. This tutorial cites only parts of this code to demonstrate different ways of working with data for the graphs.
The code segments below will fill four instances of JKQTPlotter with different statistical plots. All these plots are based on three sets of random numbers generated as shown here:
The column randomdatacol1 will contain 150 random numbers. Each one is drawn either from a normal dirstribution N(0,1) (d1) or N(6,1.2) (d2). the decision, which of the two to use is based on the result of a third random distribution ddecide, which only returns 0 or 1. The two columns randomdatacol2 and randomdatacol3 only collect the random numbers drawn from d1 or d2 respectively. The three columns are generated empyt by calling JKQTPDatastore::addColumn() with only a name. Then the actual values are added by calling JKQTPDatastore::appendToColumn().
The three sets of random numbers from above can be visualized e.g. by a JKQTPPeakStreamGraph graph with code as follows:
This (if repeated for all three columns) results in a plot like this:
Based on the raw data we can now use JKQTPlotter's JKQTPlotter Statistics Library to calculate some basic properties, like the average (jkqtpstatAverage()) or the standard deviation (jkqtpstatStdDev()):
Both statistics functions (the same as all statistics functions in the library) use an iterator-based interface, comparable to the interface of the algorithms in the C++ standard template library. To this end, the class JKQTPDatastore provides an iterator interface to its columns, using the functions JKQTPDatastore::begin() and JKQTPDatastore::end(). Both functions simply receive the column ID as parameter and exist in a const and a mutable variant. the latter allows to also edit the data. In addition the function JKQTPDatastore::backInserter() returns a back-inserter iterator (like generated for STL containers with std::back_inserter(container)) that also allows to append to the column.
note that the iterator interface allows to use these functions with any container that provides such iterators (e.g. std::vector<double>, std::list<int>, std::set<float>, QVector<double>...).
The output of these functions is shown in the image above in the plot legend/key.
Of course, several other functions exist that calculate basic statistics from a column, e.g.:
jkqtpstatAverage(), jkqtpstatWeightedAverage()jkqtpstatCount()jkqtpstatMinMax(), jkqtpstatMin(), jkqtpstatMax()jkqtpstatSum()jkqtpstatVariance(), jkqtpstatWeightedVariance()jkqtpstatStdDev(), jkqtpstatWeightedStdDev()jkqtpstatSkewness()jkqtpstatCentralMoment(), jkqtpstatMoment()jkqtpstatCorrelationCoefficient()jkqtpstatMedian()jkqtpstatQuantile()jkqtpstatMAD(), jkqtpstatNMAD()jkqtpstat5NumberStatistics(), jkqtpstat5NumberStatisticsAndOutliers(), jkqtpstat5NumberStatisticsOfSortedVector(), jkqtpstat5NumberStatisticsAndOutliersOfSortedVector()All these functions use all values in the given range and convert each value to a double, using jkqtp_todouble(). The return values is always a dohble. Therefore you can use these functions to calculate statistics of ranges of any type that can be converted to double. Values that do not result in a valid doubleare not used in calculating the statistics. Therefore you can exclude values by setting them JKQTP_DOUBLE_NAN (i.e. "not a number").
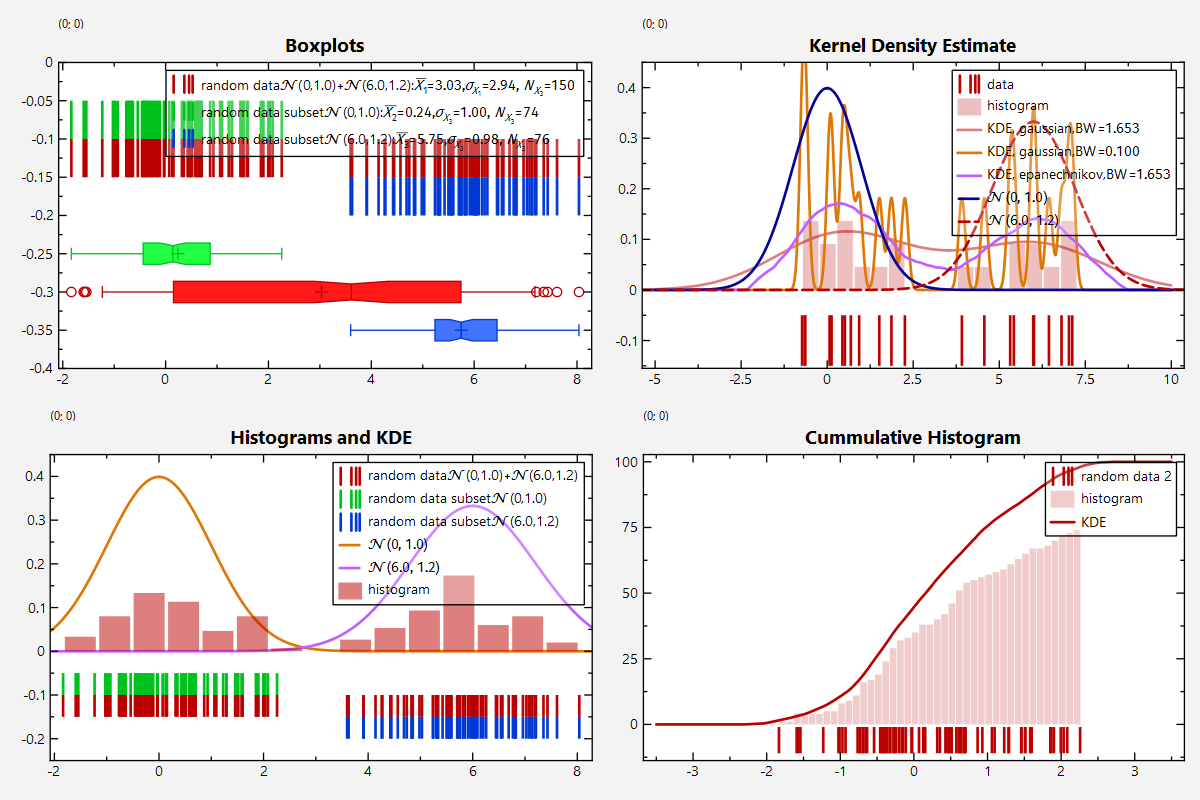
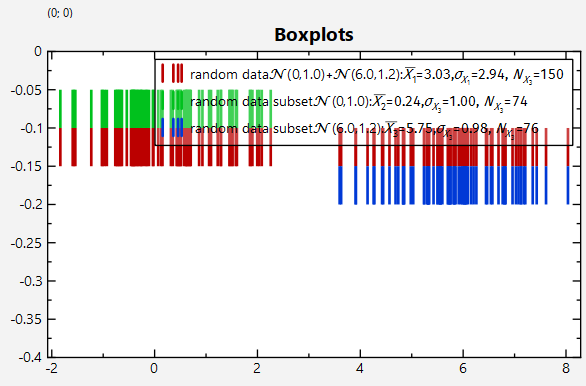
As mentioned above and shown in several other examples, JKQTPlotter supports Boxplots with the classes JKQTPBoxplotHorizontalElement, JKQTPBoxplotVerticalElement, as well as JKQTPBoxplotHorizontal and JKQTPBoxplotVertical. You can then use the 5-Number Summray functions from the JKQTPlotter Statistics Library to calculate the data for such a boxplot (e.g. jkqtpstat5NumberStatistics()) and set it up by hand. Code would look roughly like this:
In order to save you the work of writing out this code, the JKQTPlotter Statistics Library provides "adaptors", such as jkqtpstatAddVBoxplot(), which basically implements the code above. Then drawing a boxplot is reduced to:
Here -0.25indicates the location (on the y-axis) of the boxplot. and the plot is calculated for the data in the JKQTPDatastore column randomdatacol2.
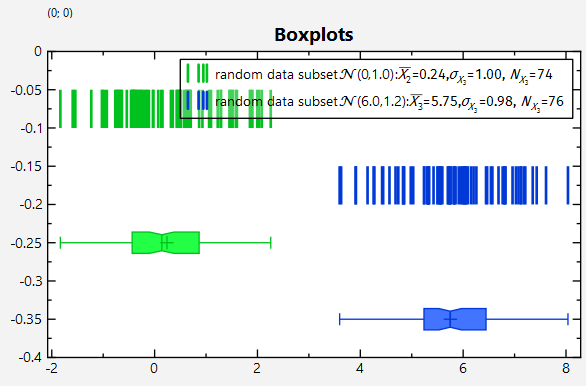
Usually the boxplot draws its whiskers at the minimum and maximum value of the dataset. But if your data contains a lot of outliers, it may make sense to draw them e.g. at the 3% and 97% quantiles and the draw the outliers as additional data points. This can also be done with jkqtpstat5NumberStatistics(), as you can specify the minimum and maximum quantile (default is 0 and 1, i.e. the true minimum and maximum) and the resulting object contains a vector with the outlier values. Then you could add them to the JKQTPDatastore and add a scatter plot that displays them. Also this task is sped up by an "adaptor". Simply call
As you can see this restuns the JKQTPBoxplotHorizontalElement and in addition a JKQTPSingleColumnSymbolsGraph for the display of the outliers. The result looks like this:
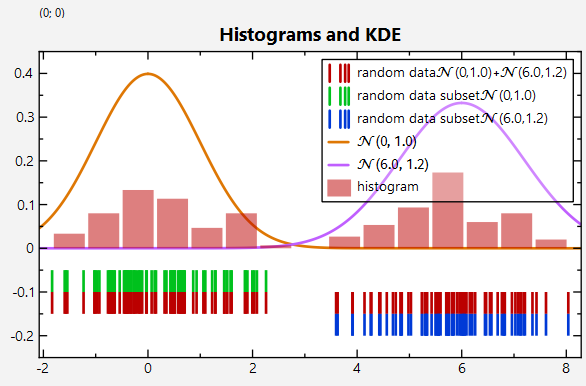
Calculating 1D-Histograms is supported by several functions from the JKQTPlotter Statistics Library, e.g. jkqtpstatHistogram1DAutoranged(). You can use the result to fill new columns in a JKQTPDatastore, which can then be used to draw the histogram (here wit 15 bins, spanning the full data range):
Again there are "adaptors" which significanty reduce the amount of coude you have to type:
The resulting plot looks like this (the distributions used to generate the random data are also shown as line plots!):
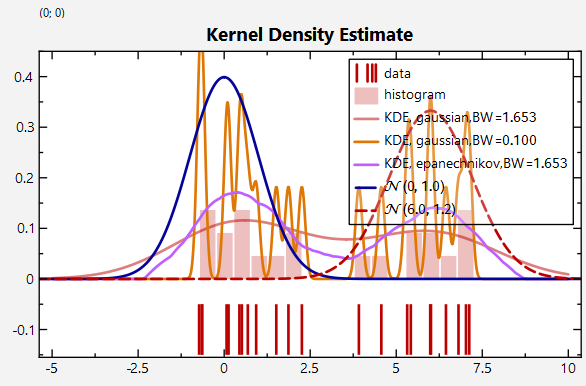
Especially when only few samples from a distribution are available, histograms are not good at representing the underlying data distribution. In such cases, Kernel Density Estimates (KDE) can help, which are basically a smoothed variant of a histogram. The JKQTPlotter Statistics Library supports calculating them via e.g. jkqtpstatKDE1D():
The function accepts different kernel functions (any C++ functor double f(double x)) and provides a set of default kernels, e.g.
The three parameters -5.0, 0.01, 10.0 tell the function jkqtpstatKDE1D() to evaluate the KDE at positions between -5 and 10, in steps of 0.01.
Finally the bandwidth constrols the smoothing and the JKQTPlotter Statistics Library provides a simple function to estimate it automatically from the data:
Again a shortcut "adaptor" simplifies this task:
Plots that result from such calls look like this:
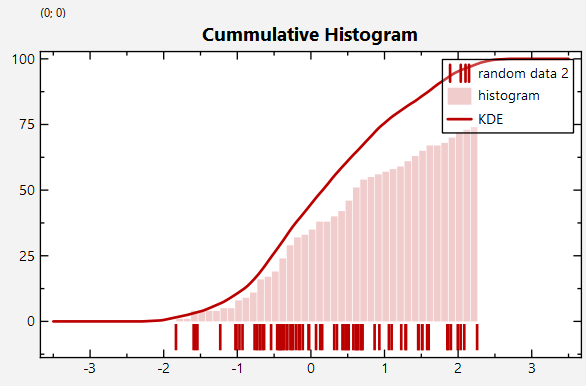
Both histograms and KDEs support a parameter bool cummulative, which allows to accumulate the data after calculation and drawing cummulative histograms/KDEs:
The output of the full test program datastore_statistics.cpp looks like this: