|
JKQTPlotter trunk/v5.0.0
an extensive Qt5+Qt6 Plotter framework (including a feature-richt plotter widget, a speed-optimized, but limited variant and a LaTeX equation renderer!), written fully in C/C++ and without external dependencies
|
|
JKQTPlotter trunk/v5.0.0
an extensive Qt5+Qt6 Plotter framework (including a feature-richt plotter widget, a speed-optimized, but limited variant and a LaTeX equation renderer!), written fully in C/C++ and without external dependencies
|
This tutorial project (see ./examples/datastore/) explains several options of JKQTPDatastore, which is the class used to centrally store the data for (most) graphs on a JKQTPlotter widget.
Note that there are additional tutorial explaining other aspects of data mangement in JKQTPDatastore:
The source code of the main application can be found in datastore.cpp. This tutorial cites parts of this code to demonstrate different ways of working with data for the graphs.
In every code-segment below, we will use these two declarations from the code to access the internal datastore of the JKQTPlotter instance:
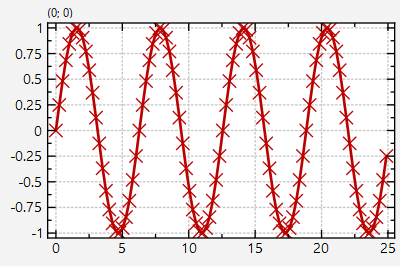
First we fill data into a QVector for a simple plot (a sine curve) and add a plot using this data:
Now the contents of the vector is copied into the datastore using JKQTPDatastore::addCopiedColumn(). After this operation, the contents of the vectors X and Y can be altered, as the JKQTPDatastore inside the JKQTPlotter now hosts its own copy of the data.
Note that you could also use a std::vector instead, as JKQTPDatastore::addCopiedColumn() is a template function that only requires the container to support C++ standard iterations (with begin() and end()), as well as the function size() to determine the number of items in the container. Also other datatypes than double are possible, as long as they can be converted to double (the function jkqtp_todouble() is used to perform the conversion, notably all integer and floating-point types, as well as bool are supported out of the box).
The plot from the code above looks like this:
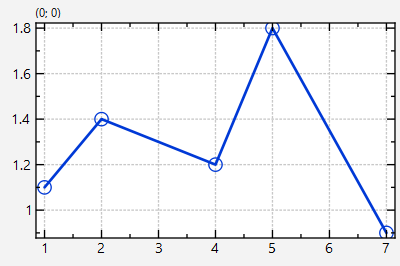
Of course if you have your data in a C-array, you can use the same syntax:
The plot from the code above looks like this:
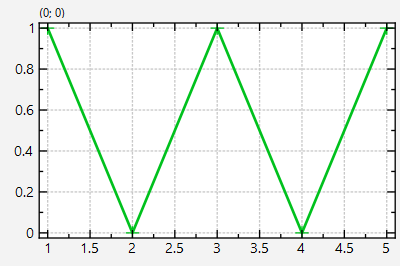
Since graphs often display (x,y)-pairs, it may make sense to store them in a map (e.g. for histograms). There there are also functions that copy the contents of a map into a JKQTPDatastore, resulting in two columns beeing added:
This code results in a graph like this:
As an alternative to the method of copying data (see above), you could also just link the data. For this to work, the data has to reside in a C-array of type double, as this is the internal datatype of the JKQTPDatastore. You can simply replace the two lines with JKQTPDatastore::addCopiedColumn() in the example above by (we exploit the fact that QVector<double>::data() returns a pointer to the internal C-array of the vector):
Of course if you have your data in a C-array, you can use the same syntax:
This method is especially useful, when you have large datasets (e.g. images) that you don't want to copy around.
Note however that the ownership of the data is not transfered to the JKQTPDatastore, i.e. you have to ensure that the data behind the pointer exists, as long as the column references the array and you have to ensure that the data is freed, when you don't need it any more.
The plot from the code above looks like this:
In addition to the variants of JKQTPDatastore::addColumn(), that do not transfer ownership of the data to the JKQTPDatastore, you can also use JKQTPDatastore::addInternalColumn(), which tells the JKQTPDatastore to use the external data array and also take over its owner-ship. This implies that the array is freed when the JKQTPDatastore is destroyed, by calling free() in the array. Therefor data for this method needs to be allocated by using malloc() or calloc():
It is also possible to leave the data mangement completely to the JKQTPDatastore and just edit the data with access functions from JKQTPDatastore.
The most basic way to generate data for a plot is to generate two non-initialized columns for the x- and y-coordinates of the graph points
These calls to JKQTPDatastore::addColumn() will generate a column each with with ndata uninitialized entries. Then use JKQTPDatastore::set() to fill them with data:
Plotting these two columns versus each other results in a simple sine graph:
For your convenience there are also function that simply create such a linear vector with one call:
This call is equivalent to
In both cases the column colLinX will contain these numbers afterwards:
Comparable functions exist for logarithmically spaced columns (JKQTPDatastore::addLogColumn() and JKQTPDatastore::addDecadeLogColumn() which only differ in the way the start and end values are specified):
This call results in a column with these 30 values spanning the range between 1 and 1000:
You can use the methods JKQTPDatastore::appendToColumn() and JKQTPDatastore::appendFromContainerToColumn() to extend columns with additional values, e.g.:
Note that this operation changes the column length (number of rows). If the memory was externally managed before, it will be internally managed afterwards! If the first append is called on a column that cannot be extended, the contents will be copied and the column will reference the new, internally managed, memory afterwards.
Alterantively there is also a std::back_inserter-like interface to append to a column:
This, together with JKQTPDatastore::begin() and JKQTPDatatstore::end() allows to use JKQTDatastore together with algorithms from the C++ standard template libarary and other templated algorithms based on the same iterator-based interfaces (e.g. in boost).
After generating columns, as shown above, you can also use the data in these columns to calculate a second column based on the values in the first. You can do this explicitly:
In this example the function JKQTPDatastore::get() is used to retrieve a value from a column and then JKQTPDatastore::set() is used to store a new value calculated from the read values into another column.
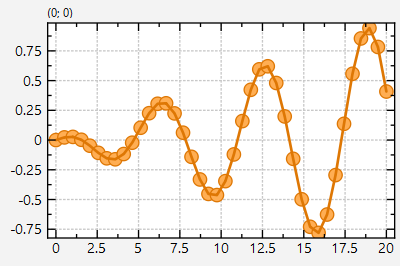
Or use a special function that gets a column with values and a functor f: double->double as parameters:
Plotting these two columns versus each other
results in:
There is also a function JKQTPDatastore::addLinearGridColumns(size_t width, double startX, double endX, size_t height, double startY, double endY, const QString &nameX, const QString &nameY) that generate two columns simultaneously that conatin the x- and y-coordinates of the points on a rectangular grid, in a column-major order:
This call will generate these columns with x-values scaling between 10 and 20 (in 10 steps) and y-values between 1.5 and 3 (also in 10 steps):
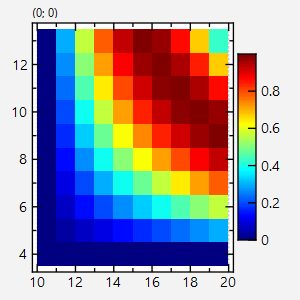
Such x-y-coordinate columns are especially usefull when calculating data for an image (plotted by JKQTPColumnMathImage), or for a parametrized scatter plot (plotted by JKQTPXYParametrizedScatterGraph). To demonstrate this, we can can add another column with 10*10=100 entries and fill it with some values calculated from the the x and y-values in colLinXY:
Note that we used JKQTPDatastore::addImageColumn(width,height,name) here, which generates a column with width*height entries that are meant to be interpreted as a 2D image with width columns and height rows. This function therefore also save this image size in the column metadata and graphs can later extract this dimension and use it to set them up internally (e.g. JKQTPColumnMathImage::setImageColumn() does just that). In the example above we used the simple JKQTPDatastore::set() store values into our image column. This function treats the column as linearized in row-major order. Alternatively you can also use code like this to access the imageColumn as a real image or matrix:
Drawing this column as an image (using JKQTPColumnMathImage) will look like this:
In these examples, the iteration and calculation is written out with an explicit for-loop. JKQTPDatastore also offers a shortcut function for this that accepts a functor with the calculation only:
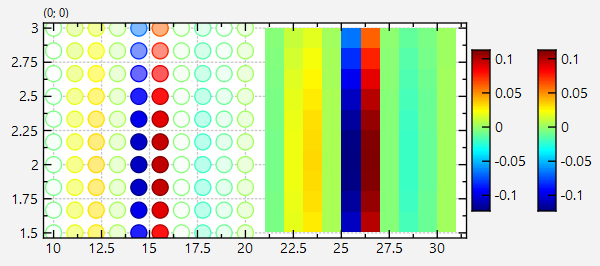
Then you can plot these as a parametrized scatter graph (JKQTPXYParametrizedScatterGraph) using:
... or alternatively you can only use the column imgColumn in a JKQTPColumnMathImage
The result will look like this (JKQTPXYParametrizedScatterGraph on the left and JKQTPColumnMathImage on the right):
Some sections before we discussed a code-fragment
in which an image was calculated pixel-by-pixel with explicit int indices. Alternatively you can also access the columns via C++ iterators:
All these code fragments result in the same graphs:
You can also use this interface to interface with algorithms e.g. from the C++ standard template library. E.g. if you want to sort the data in a column, you can simply call

This, together with JKQTPDatastore::backInserter() allows to use JKQTDatastore together with algorithms from the C++ standard template libarary and other templated algorithms based on the same iterator-based interfaces (e.g. in boost).
