|
| void | setDataSortOrder (DataSortOrder __value) |
| | if !=Unsorted, the data is sorted before plotting
|
| void | setDataSortOrder (int __value) |
| | if !=Unsorted, the data is sorted before plotting
|
| virtual void | setKeyColumn (int __value) |
| | sets the column used as "key" for the current graph (typically this call setXColumn(), but for horizontal graphs like filled curves or barcharts it may call setYColumn() )
|
| virtual void | setValueColumn (int __value) |
| | sets the column used as "value" for the current graph (typically this call setXColumn(), but for horizontal graphs like filled curves or barcharts it may call setYColumn() )
|
| void | setXColumn (int __value) |
| | the column that contains the x-component of the datapoints
|
| void | setXColumn (size_t __value) |
| | the column that contains the x-component of the datapoints
|
| void | setXYColumns (int xCol, int yCol) |
| | sets xColumn and yColumn at the same time
|
| void | setXYColumns (QPair< int, int > xyColPair) |
| | sets xColumn and yColumn at the same time
|
| void | setXYColumns (QPair< size_t, size_t > xyColPair) |
| | sets xColumn and yColumn at the same time
|
| void | setXYColumns (size_t xCol, size_t yCol) |
| | sets xColumn and yColumn at the same time
|
| void | setYColumn (int __value) |
| | the column that contains the y-component of the datapoints
|
| void | setYColumn (size_t __value) |
| | the column that contains the y-component of the datapoints
|
| void | setHighlighted (bool __value) |
| | sets whether the graph is drawn in a highlighted style in the plot
|
| virtual void | setTitle (const QString &__value) |
| | sets the title of the plot (for display in key!).
|
| void | setVisible (bool __value) |
| | sets whether the graph is visible in the plot
|
|
| | JKQTPXYGraph (JKQTBasePlotter *parent=nullptr) |
| | class constructor
|
| DataSortOrder | getDataSortOrder () const |
| | if !=Unsorted, the data is sorted before plotting
|
| virtual int | getKeyColumn () const |
| | returns the column used as "key" for the current graph (typically this call getXColumn(), but for horizontal graphs like filled curves or barcharts it may call getYColumn() )
|
| virtual int | getValueColumn () const |
| | returns the column used as "value" for the current graph (typically this call getXColumn(), but for horizontal graphs like filled curves or barcharts it may call getYColumn() )
|
| int | getXColumn () const |
| | the column that contains the x-component of the datapoints
|
| virtual bool | getXMinMax (double &minx, double &maxx, double &smallestGreaterZero) override |
| | get the maximum and minimum x-value of the graph
|
| int | getYColumn () const |
| | the column that contains the y-component of the datapoints
|
| virtual bool | getYMinMax (double &miny, double &maxy, double &smallestGreaterZero) override |
| | get the maximum and minimum y-value of the graph
|
| virtual double | hitTest (const QPointF &posSystem, QPointF *closestSpotSystem=nullptr, QString *label=nullptr, HitTestMode mode=HitTestXY) const override |
| | Implmentation of JKQTPPlotElement::hitTest(), which searches through all graph points defined by xColumn and yColumn and returns a general x/y-label, also taking into account possibly known errors to the graphs (if it is derived from JKQTPXGraphErrorData and/or JKQTPYGraphErrorData.
|
| virtual bool | usesColumn (int column) const override |
| | returns true if the given column is used by the graph
|
| | JKQTPGraph (JKQTBasePlotter *parent=nullptr) |
| | class constructor
|
| virtual | ~JKQTPGraph ()=default |
| | default wirtual destructor
|
| | JKQTPPlotElement (JKQTBasePlotter *parent=nullptr) |
| | class constructor
|
| virtual | ~JKQTPPlotElement ()=default |
| | default wirtual destructor
|
| QPointF | backTransform (const QPointF &x) const |
| | tool routine that back-transforms a QPointF according to the parent's transformation rules (pixels --> plot coordinate)
|
| QPointF | backTransform (double x, double y) const |
| | tool routine that back-transforms a QPointF according to the parent's transformation rules (pixels --> plot coordinate)
|
| double | backtransformX (double x) const |
| | tool routine that backtransforms an x-coordinate (pixels --> plot coordinate) for this plot element, uses the axis referenced in xAxisRef
|
| double | backtransformY (double y) const |
| | tool routine that backtransforms a y-coordinate (pixels --> plot coordinate) for this plot element, uses the axis referenced in yAxisRef
|
| virtual void | draw (JKQTPEnhancedPainter &painter)=0 |
| | plots the graph to the plotter object specified as parent
|
| virtual void | drawKeyMarker (JKQTPEnhancedPainter &painter, const QRectF &rect)=0 |
| | plots a key marker inside the specified rectangle rect
|
| virtual void | drawOutside (JKQTPEnhancedPainter &painter, QRect leftSpace, QRect rightSpace, QRect topSpace, QRect bottomSpace) |
| | plots outside the actual plot field of view (e.g. color bars, scale bars, ...)
|
| QImage | generateKeyMarker (QSize size=QSize(16, 16)) |
| | returns an image with a key marker inside
|
| virtual QColor | getKeyLabelColor () const =0 |
| | returns the color to be used for the key label
|
| virtual void | getOutsideSize (JKQTPEnhancedPainter &painter, int &leftSpace, int &rightSpace, int &topSpace, int &bottomSpace) |
| | if the graph plots outside the actual plot field of view (e.g. color bars, scale bars, ...)
|
| JKQTBasePlotter * | getParent () |
| | returns the parent painter class
|
| const JKQTBasePlotter * | getParent () const |
| | returns the parent painter class
|
| QString | getTitle () const |
| | returns the the title of the plot
|
| const JKQTPCoordinateAxis * | getXAxis () const |
| | returns the actual x-Axis-object from the parent plotter, referenced in xAxisRef
|
| JKQTPCoordinateAxisRef | getXAxisRef () const |
| | indicates which coordinate axis to use for coordinate transforms in x-direction
|
| const JKQTPCoordinateAxis * | getYAxis () const |
| | returns the actual y-Axis-object from the parent plotter, referenced in yAxisRef
|
| JKQTPCoordinateAxisRef | getYAxisRef () const |
| | indicates which coordinate axis to use for coordinate transforms in y-direction
|
| bool | isHighlighted () const |
| | returns whether the graph is shown in a highlighted style in the plot
|
| bool | isVisible () const |
| | returns whether the graph is visible in the plot
|
| void | setAxes (JKQTPCoordinateAxisRef ref) |
| | set the coordinate axes to use for this plot element
|
| virtual void | setParent (JKQTBasePlotter *parent) |
| | sets the parent painter class
|
| virtual void | setParent (JKQTPlotter *parent) |
| | sets the parent painter class
|
| void | setXAxis (JKQTPCoordinateAxisRef ref) |
| | indicates which coordinate axis to use for coordinate transforms in x-direction
|
| void | setYAxis (JKQTPCoordinateAxisRef ref) |
| | indicates which coordinate axis to use for coordinate transforms in y-direction
|
| QPointF | transform (const QPointF &x) const |
| | tool routine that transforms a QPointF according to the parent's transformation rules (plot coordinate --> pixels)
|
| QPolygonF | transform (const QPolygonF &x) const |
| | tool routine that transforms a QPolygonF according to the parent's transformation rules (plot coordinate --> pixels)
|
| QPointF | transform (double x, double y) const |
| | tool routine that transforms a QPointF according to the parent's transformation rules (plot coordinate --> pixels)
|
| QPainterPath | transformToLinePath (const QPolygonF &x) const |
| | tool routine that transforms a QPolygonF according to the parent's transformation rules and returns a (non-closed) path consisting of lines (plot coordinate --> pixels)
|
| QVector< double > | transformX (const QVector< double > &x) const |
| | transform all x-coordinates in a vector x
|
| double | transformX (double x) const |
| | tool routine that transforms an x-coordinate (plot coordinate --> pixels) for this plot element, uses the axis referenced in xAxisRef
|
| QVector< double > | transformY (const QVector< double > &x) const |
| | transform all y-coordinates in a vector x
|
| double | transformY (double y) const |
| | tool routine that transforms a y-coordinate (plot coordinate --> pixels) for this plot element, uses the axis referenced in yAxisRef
|
|
| int | getDataIndex (int i) const |
| | returns the index of the i-th datapoint (where i is an index into the SORTED datapoints)
|
| virtual bool | getIndexRange (int &imin, int &imax) const |
| | determines the range of row indexes available in the data columns of this graph
|
| virtual void | intSortData () |
| | sorts data according to the specified criterion in sortData ... The result is stored as a index-map in sorted Indices
|
| virtual void | drawErrorsAfter (JKQTPEnhancedPainter &) |
| | this function is used to plot error inidcators after plotting the graphs.
|
| virtual void | drawErrorsBefore (JKQTPEnhancedPainter &) |
| | this function is used to plot error inidcators before plotting the graphs.
|
| bool | getDataMinMax (int column, double &minx, double &maxx, double &smallestGreaterZero) |
| | get the maximum and minimum value of the given column
|
| void | addHitTestData (const HitTestLocation &loc) |
| | clear the internal datastore for hitTest()
|
| void | addHitTestData (const QPointF &pos_, const QString &label_) |
| | clear the internal datastore for hitTest()
|
| void | addHitTestData (const QPointF &pos_, int index_, const QString &label_) |
| | clear the internal datastore for hitTest()
|
| void | addHitTestData (const QPointF &pos_, int index_=-1, const JKQTPDatastore *datastore=nullptr) |
| | clear the internal datastore for hitTest(), this variant uses formatHitTestDefaultLabel() to auto-generate the label
|
| void | addHitTestData (double x_, double y_, const QString &label_) |
| | add a new point on the graph to the internal datastore for hitTest()
|
| void | addHitTestData (double x_, double y_, int index_, const QString &label_) |
| | clear the internal datastore for hitTest()
|
| void | addHitTestData (double x_, double y_, int index_=-1, const JKQTPDatastore *datastore=nullptr) |
| | add a new point on the graph to the internal datastore for hitTest(), this variant uses formatHitTestDefaultLabel() to auto-generate the label
|
| void | clearHitTestData () |
| | clear the internal datastore for hitTest()
|
| virtual QString | formatHitTestDefaultLabel (double x, double y, int index=-1, const JKQTPDatastore *datastore=nullptr) const |
| | tool-function for hitTest(), which formats a default label, taking into account the x- and y-position (both provided) and optionally the errors of these positions.
|
| void | reserveHitTestData (int points) |
| | reserve list entries for up to points graph points in the internal datastore for hitTest()
|
| QString | xFloatToString (double v, int past_comma=-1) const |
| | converts a x-value v into a string, taking into account the type of x-axis
|
| QString | yFloatToString (double v, int past_comma=-1) const |
| | converts a x-value v into a string, taking into account the type of x-axis
|
This virtual JKQTPGraph descendent may be used as base for all graphs that use at least two columns that specify x and y coordinates for the single plot points.
This class implements basic management facilities for the data columns:
- setXColumn(), setYColumn() to set the columns to be used for the graph data
- setDataSortOrder() to specify whether and how the data should be sorted before drawing
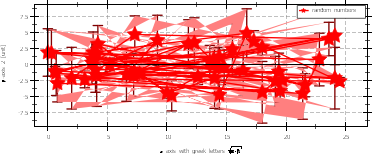
Unsorted Data
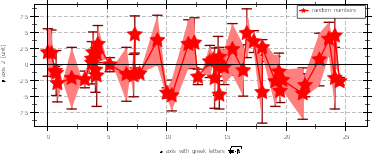
Data sorted along x-axis (DataSortOrder::SortedX)
... and overrides/implements the functions: