|
JKQTPlotter trunk/v5.0.0
an extensive Qt5+Qt6 Plotter framework (including a feature-richt plotter widget, a speed-optimized, but limited variant and a LaTeX equation renderer!), written fully in C/C++ and without external dependencies
|
|
JKQTPlotter trunk/v5.0.0
an extensive Qt5+Qt6 Plotter framework (including a feature-richt plotter widget, a speed-optimized, but limited variant and a LaTeX equation renderer!), written fully in C/C++ and without external dependencies
|
This implements filled curve plots where the area is filled between the plot line and the x-Axis. More...
#include <jkqtpfilledcurve.h>
Public Member Functions | |
| JKQTPFilledCurveXGraph (JKQTBasePlotter *parent=nullptr) | |
| class constructor | |
| JKQTPFilledCurveXGraph (JKQTPlotter *parent) | |
| class constructor | |
| void | draw (JKQTPEnhancedPainter &painter) override |
| plots the graph to the plotter object specified as parent | |
| virtual bool | getYMinMax (double &miny, double &maxy, double &smallestGreaterZero) override |
| get the maximum and minimum y-value of the graph | |
| Public Member Functions inherited from JKQTPFilledCurveGraphBase | |
| JKQTPFilledCurveGraphBase (JKQTBasePlotter *parent=nullptr) | |
| class constructor | |
| virtual void | drawKeyMarker (JKQTPEnhancedPainter &painter, const QRectF &rect) override |
| plots a key marker inside the specified rectangle rect | |
| JKQTPGraphFillStyleMixin & | fillStyleBelow () |
if m_fillMode ==FillAboveAndBelowDifferently then this fill style is used below the baseline and the default fill style is used above | |
| const JKQTPGraphFillStyleMixin & | fillStyleBelow () const |
if m_fillMode ==FillAboveAndBelowDifferently then this fill style is used below the baseline and the default fill style is used above | |
| FillMode | getFillMode () const |
| specifies how the area of the graph is filles | |
| virtual QColor | getKeyLabelColor () const override |
| returns the color to be used for the key label | |
| Public Member Functions inherited from JKQTPXYBaselineGraph | |
| JKQTPXYBaselineGraph (JKQTBasePlotter *parent=nullptr) | |
| class constructor | |
| double | getBaseline () const |
| baseline of the plot (NOTE: 0 is interpreted as until plot border in log-mode!!!) | |
| Public Member Functions inherited from JKQTPXYGraph | |
| JKQTPXYGraph (JKQTBasePlotter *parent=nullptr) | |
| class constructor | |
| DataSortOrder | getDataSortOrder () const |
if !=Unsorted, the data is sorted before plotting | |
| virtual int | getKeyColumn () const |
| returns the column used as "key" for the current graph (typically this call getXColumn(), but for horizontal graphs like filled curves or barcharts it may call getYColumn() ) | |
| virtual int | getValueColumn () const |
| returns the column used as "value" for the current graph (typically this call getXColumn(), but for horizontal graphs like filled curves or barcharts it may call getYColumn() ) | |
| int | getXColumn () const |
| the column that contains the x-component of the datapoints | |
| virtual bool | getXMinMax (double &minx, double &maxx, double &smallestGreaterZero) override |
| get the maximum and minimum x-value of the graph | |
| int | getYColumn () const |
| the column that contains the y-component of the datapoints | |
| virtual double | hitTest (const QPointF &posSystem, QPointF *closestSpotSystem=nullptr, QString *label=nullptr, HitTestMode mode=HitTestXY) const override |
| Implmentation of JKQTPPlotElement::hitTest(), which searches through all graph points defined by xColumn and yColumn and returns a general x/y-label, also taking into account possibly known errors to the graphs (if it is derived from JKQTPXGraphErrorData and/or JKQTPYGraphErrorData. | |
| virtual bool | usesColumn (int column) const override |
returns true if the given column is used by the graph | |
| Public Member Functions inherited from JKQTPGraph | |
| JKQTPGraph (JKQTBasePlotter *parent=nullptr) | |
| class constructor | |
| virtual | ~JKQTPGraph ()=default |
| default wirtual destructor | |
| Public Member Functions inherited from JKQTPPlotElement | |
| JKQTPPlotElement (JKQTBasePlotter *parent=nullptr) | |
| class constructor | |
| virtual | ~JKQTPPlotElement ()=default |
| default wirtual destructor | |
| QPointF | backTransform (const QPointF &x) const |
| tool routine that back-transforms a QPointF according to the parent's transformation rules (pixels --> plot coordinate) | |
| QPointF | backTransform (double x, double y) const |
| tool routine that back-transforms a QPointF according to the parent's transformation rules (pixels --> plot coordinate) | |
| double | backtransformX (double x) const |
| tool routine that backtransforms an x-coordinate (pixels --> plot coordinate) for this plot element, uses the axis referenced in xAxisRef | |
| double | backtransformY (double y) const |
| tool routine that backtransforms a y-coordinate (pixels --> plot coordinate) for this plot element, uses the axis referenced in yAxisRef | |
| virtual void | drawOutside (JKQTPEnhancedPainter &painter, QRect leftSpace, QRect rightSpace, QRect topSpace, QRect bottomSpace) |
| plots outside the actual plot field of view (e.g. color bars, scale bars, ...) | |
| QImage | generateKeyMarker (QSize size=QSize(16, 16)) |
| returns an image with a key marker inside | |
| virtual void | getOutsideSize (JKQTPEnhancedPainter &painter, int &leftSpace, int &rightSpace, int &topSpace, int &bottomSpace) |
| if the graph plots outside the actual plot field of view (e.g. color bars, scale bars, ...) | |
| JKQTBasePlotter * | getParent () |
| returns the parent painter class | |
| const JKQTBasePlotter * | getParent () const |
| returns the parent painter class | |
| QString | getTitle () const |
| returns the the title of the plot | |
| const JKQTPCoordinateAxis * | getXAxis () const |
| returns the actual x-Axis-object from the parent plotter, referenced in xAxisRef | |
| JKQTPCoordinateAxisRef | getXAxisRef () const |
| indicates which coordinate axis to use for coordinate transforms in x-direction | |
| const JKQTPCoordinateAxis * | getYAxis () const |
| returns the actual y-Axis-object from the parent plotter, referenced in yAxisRef | |
| JKQTPCoordinateAxisRef | getYAxisRef () const |
| indicates which coordinate axis to use for coordinate transforms in y-direction | |
| bool | isHighlighted () const |
| returns whether the graph is shown in a highlighted style in the plot | |
| bool | isVisible () const |
| returns whether the graph is visible in the plot | |
| void | setAxes (JKQTPCoordinateAxisRef ref) |
| set the coordinate axes to use for this plot element | |
| virtual void | setParent (JKQTBasePlotter *parent) |
| sets the parent painter class | |
| virtual void | setParent (JKQTPlotter *parent) |
| sets the parent painter class | |
| void | setXAxis (JKQTPCoordinateAxisRef ref) |
| indicates which coordinate axis to use for coordinate transforms in x-direction | |
| void | setYAxis (JKQTPCoordinateAxisRef ref) |
| indicates which coordinate axis to use for coordinate transforms in y-direction | |
| QPointF | transform (const QPointF &x) const |
| tool routine that transforms a QPointF according to the parent's transformation rules (plot coordinate --> pixels) | |
| QPolygonF | transform (const QPolygonF &x) const |
| tool routine that transforms a QPolygonF according to the parent's transformation rules (plot coordinate --> pixels) | |
| QPointF | transform (double x, double y) const |
| tool routine that transforms a QPointF according to the parent's transformation rules (plot coordinate --> pixels) | |
| QPainterPath | transformToLinePath (const QPolygonF &x) const |
| tool routine that transforms a QPolygonF according to the parent's transformation rules and returns a (non-closed) path consisting of lines (plot coordinate --> pixels) | |
| QVector< double > | transformX (const QVector< double > &x) const |
| transform all x-coordinates in a vector x | |
| double | transformX (double x) const |
| tool routine that transforms an x-coordinate (plot coordinate --> pixels) for this plot element, uses the axis referenced in xAxisRef | |
| QVector< double > | transformY (const QVector< double > &x) const |
| transform all y-coordinates in a vector x | |
| double | transformY (double y) const |
| tool routine that transforms a y-coordinate (plot coordinate --> pixels) for this plot element, uses the axis referenced in yAxisRef | |
| Public Member Functions inherited from JKQTPGraphLineAndFillStyleMixin | |
| JKQTPGraphLineAndFillStyleMixin () | |
| class constructor | |
| bool | doDrawLine () const |
indicates whether to draw a line on the circumference of the described area (i.e. along the data points from xColumn and yColumn as well as xColumn and yColumn2 or not | |
| bool | doFillCurve () const |
| indicates whether to fill the space between the curve and the x-axis | |
| bool | getDrawLine () const |
indicates whether to draw a line on the circumference of the described area (i.e. along the data points from xColumn and yColumn as well as xColumn and yColumn2 or not | |
| bool | getFillCurve () const |
| indicates whether to fill the space between the curve and the x-axis | |
| void | setDrawLine (bool __value) |
indicates whether to draw a line on the circumference of the described area (i.e. along the data points from xColumn and yColumn as well as xColumn and yColumn2 or not | |
| void | setFillCurve (bool __value) |
| indicates whether to fill the space between the curve and the x-axis | |
| Public Member Functions inherited from JKQTPGraphFillStyleMixin | |
| JKQTPGraphFillStyleMixin () | |
| class constructor | |
| virtual | ~JKQTPGraphFillStyleMixin () |
| QBrush | getFillBrush (JKQTPEnhancedPainter &painter, JKQTBasePlotter *parent) const |
| constructs a QBrush from the graph fill styling properties | |
| QColor | getFillColor () const |
| set the color of the graph filling | |
| const QGradient * | getFillGradient () const |
| get the gradient object of the graph filling | |
| Qt::BrushStyle | getFillStyle () const |
| get the fill style of the graph | |
| QPixmap | getFillTexture () const |
| set the color of the graph filling | |
| QImage | getFillTextureImage () const |
| set the color of the graph filling | |
| void | initFillStyle (JKQTBasePlotter *parent, int &parentPlotStyle, JKQTPPlotStyleType styletype=JKQTPPlotStyleType::Default) |
| initiaize the fill style (from the parent plotter) | |
| void | initFillStyleInvertedColor (JKQTPGraphFillStyleMixin *other) |
| initiaize the fill style from another JKQTPGraphFillStyleMixin other by inverting its fill color | |
| void | setFillBrush (const QBrush &b) |
| sets a fill brush (overwrites all internal properties!) | |
| void | setFillColor (const QColor &__value) |
| set the color of the graph filling | |
| void | setFillColor (const QColor &__value, double alpha) |
| set the color of the graph filling | |
| void | setFillGradient (const QGradient &__value) |
| set the filling of the graph to a gradient and sets fill style to a gradient setting | |
| void | setFillStyle (Qt::BrushStyle __value) |
| set the fill style of the graph | |
| void | setFillTexture (const QImage &__value) |
| set the color of the graph filling and sets fill style to Qt::TexturePattern | |
| void | setFillTexture (const QPixmap &__value) |
| set the color of the graph filling and sets fill style to Qt::TexturePattern | |
| void | setFillTransform (const QTransform &b) |
| sets a fill transformation | |
| Public Member Functions inherited from JKQTPGraphLineStyleMixin | |
| JKQTPGraphLineStyleMixin () | |
| class constructor | |
| virtual | ~JKQTPGraphLineStyleMixin () |
| QColor | getHighlightingLineColor () const |
| get the color of the graph line when highlighted | |
| QPen | getHighlightingLinePen (JKQTPEnhancedPainter &painter, JKQTBasePlotter *parent) const |
| constructs a QPen from the line styling properties | |
| QPen | getHighlightingLinePenForRects (JKQTPEnhancedPainter &painter, JKQTBasePlotter *parent) const |
| constructs a QPen from the line styling properties, suitable for drawing rectangle with sharp corners | |
| QPen | getKeyLinePen (JKQTPEnhancedPainter &painter, const QRectF &rect, JKQTBasePlotter *parent) const |
| constructs a QPen from the line styling properties, but uses getKeyLineWidthPx() for the width, i.e. constructs a pen for drawing lines in key-symbols | |
| double | getKeyLineWidthPx (JKQTPEnhancedPainter &painter, const QRectF &keyRect, const JKQTBasePlotter *parent) const |
| returns the linewidth for drawing lines in a key entry with keyRect for the symbol, using painter and parent . | |
| QBrush | getLineBrush () const |
| gets the brush used to fill the line area | |
| Qt::PenCapStyle | getLineCapStyle () const |
| gets the cap style | |
| QColor | getLineColor () const |
| get the color of the graph line | |
| qreal | getLineDashOffset () const |
| returns the dash offset for a custom dash style | |
| QVector< qreal > | getLineDashPattern () const |
| gets the dash pattern for a custom dash style | |
| Qt::PenJoinStyle | getLineJoinStyle () const |
| returns the join style | |
| QPen | getLinePen (JKQTPEnhancedPainter &painter, JKQTBasePlotter *parent) const |
| constructs a QPen from the line styling properties | |
| QPen | getLinePenForRects (JKQTPEnhancedPainter &painter, JKQTBasePlotter *parent) const |
| constructs a QPen from the line styling properties, suitable for drawing rectangles with sharp edges | |
| Qt::PenStyle | getLineStyle () const |
| get the style of the graph line | |
| double | getLineWidth () const |
| get the line width of the graph line (in pt) | |
| void | initLineStyle (JKQTBasePlotter *parent, int &parentPlotStyle, JKQTPPlotStyleType styletype=JKQTPPlotStyleType::Default) |
| initiaize the line style (from the parent plotter) | |
| void | setHighlightingLineColor (const QColor &__value) |
| set the color of the graph line when highlighted | |
| void | setHighlightingLineColor (const QColor &__value, double alpha) |
| set the color of the graph line when highlighted | |
| void | setLineBrush (const QBrush &style) |
| sets the brush used to fill the line area | |
| void | setLineCapStyle (Qt::PenCapStyle style) |
| sets the cap style | |
| void | setLineColor (const QColor &__value) |
| set the color of the graph line | |
| void | setLineColor (const QColor &__value, double alpha) |
| set the color of the graph line | |
| void | setLineColorInvertedFrom (QColor __noninvertedColor) |
| sets the line-color as an inverted version of the given color | |
| void | setLineDashOffset (qreal offset) |
| sets the dash offset for a custom dash style | |
| void | setLineDashPattern (const QVector< qreal > &pattern) |
| sets the dash pattern for a custom dash style | |
| void | setLineJoinStyle (Qt::PenJoinStyle style) |
| sets the join style | |
| void | setLineStyle (Qt::PenStyle __value) |
| set the style of the graph line | |
| void | setLineWidth (double __value) |
| set the line width of the graph line (in pt) | |
Additional Inherited Members | |
| Public Types inherited from JKQTPFilledCurveGraphBase | |
| enum | FillMode { SingleFilling =0 , TwoColorFilling =1 } |
| specifies how the area below the graph is filled More... | |
| Public Types inherited from JKQTPXYGraph | |
| enum | DataSortOrder { Unsorted =0 , SortedX =1 , SortedY =2 } |
| specifies how to sort the data in a JKQTPXYGraph before drawing More... | |
| Public Types inherited from JKQTPPlotElement | |
| enum | HitTestMode { HitTestXY , HitTestXOnly , HitTestYOnly } |
| modes of operation for the function hitTest() More... | |
| Public Slots inherited from JKQTPFilledCurveGraphBase | |
| void | setColor (QColor c) |
| set line-color, fill color and symbol color | |
| void | setFillMode (JKQTPFilledCurveGraphBase::FillMode mode) |
| specifies how the area of the graph is filles | |
| Public Slots inherited from JKQTPXYBaselineGraph | |
| void | setBaseline (double __value) |
| baseline of the plot (NOTE: 0 is interpreted as until plot border in log-mode!!!) | |
| Public Slots inherited from JKQTPXYGraph | |
| void | setDataSortOrder (DataSortOrder __value) |
if !=Unsorted, the data is sorted before plotting | |
| void | setDataSortOrder (int __value) |
if !=Unsorted, the data is sorted before plotting | |
| virtual void | setKeyColumn (int __value) |
| sets the column used as "key" for the current graph (typically this call setXColumn(), but for horizontal graphs like filled curves or barcharts it may call setYColumn() ) | |
| virtual void | setValueColumn (int __value) |
| sets the column used as "value" for the current graph (typically this call setXColumn(), but for horizontal graphs like filled curves or barcharts it may call setYColumn() ) | |
| void | setXColumn (int __value) |
| the column that contains the x-component of the datapoints | |
| void | setXColumn (size_t __value) |
| the column that contains the x-component of the datapoints | |
| void | setXYColumns (int xCol, int yCol) |
| sets xColumn and yColumn at the same time | |
| void | setXYColumns (QPair< int, int > xyColPair) |
| sets xColumn and yColumn at the same time | |
| void | setXYColumns (QPair< size_t, size_t > xyColPair) |
| sets xColumn and yColumn at the same time | |
| void | setXYColumns (size_t xCol, size_t yCol) |
| sets xColumn and yColumn at the same time | |
| void | setYColumn (int __value) |
| the column that contains the y-component of the datapoints | |
| void | setYColumn (size_t __value) |
| the column that contains the y-component of the datapoints | |
| Public Slots inherited from JKQTPPlotElement | |
| void | setHighlighted (bool __value) |
| sets whether the graph is drawn in a highlighted style in the plot | |
| virtual void | setTitle (const QString &__value) |
| sets the title of the plot (for display in key!). | |
| void | setVisible (bool __value) |
| sets whether the graph is visible in the plot | |
| Protected Member Functions inherited from JKQTPXYBaselineGraph | |
| bool | getMinMaxWithBaseline (int dataColumn, double &minv, double &maxv, double &smallestGreaterZero) |
| can be called by JKQTPGraph::getXMinMax() or JKQTPGraph::getYMinMax() calculates min/max/... for data from the given column, including the baseline | |
| bool | getMinMaxWithErrorsAndBaseline (int dataColumn, int errorColumn, int errorColumnLower, bool errorSymmetric, double &minv, double &maxv, double &smallestGreaterZero) |
| can be called by JKQTPGraph::getXMinMax() or JKQTPGraph::getYMinMax() calculates min/max/... for data from the given column, including the baseline and an optional error | |
| Protected Member Functions inherited from JKQTPXYGraph | |
| int | getDataIndex (int i) const |
| returns the index of the i-th datapoint (where i is an index into the SORTED datapoints) | |
| virtual bool | getIndexRange (int &imin, int &imax) const |
| determines the range of row indexes available in the data columns of this graph | |
| virtual void | intSortData () |
| sorts data according to the specified criterion in sortData ... The result is stored as a index-map in sorted Indices | |
| Protected Member Functions inherited from JKQTPGraph | |
| virtual void | drawErrorsAfter (JKQTPEnhancedPainter &) |
| this function is used to plot error inidcators after plotting the graphs. | |
| virtual void | drawErrorsBefore (JKQTPEnhancedPainter &) |
| this function is used to plot error inidcators before plotting the graphs. | |
| bool | getDataMinMax (int column, double &minx, double &maxx, double &smallestGreaterZero) |
| get the maximum and minimum value of the given column | |
| Protected Member Functions inherited from JKQTPPlotElement | |
| void | addHitTestData (const HitTestLocation &loc) |
| clear the internal datastore for hitTest() | |
| void | addHitTestData (const QPointF &pos_, const QString &label_) |
| clear the internal datastore for hitTest() | |
| void | addHitTestData (const QPointF &pos_, int index_, const QString &label_) |
| clear the internal datastore for hitTest() | |
| void | addHitTestData (const QPointF &pos_, int index_=-1, const JKQTPDatastore *datastore=nullptr) |
| clear the internal datastore for hitTest(), this variant uses formatHitTestDefaultLabel() to auto-generate the label | |
| void | addHitTestData (double x_, double y_, const QString &label_) |
| add a new point on the graph to the internal datastore for hitTest() | |
| void | addHitTestData (double x_, double y_, int index_, const QString &label_) |
| clear the internal datastore for hitTest() | |
| void | addHitTestData (double x_, double y_, int index_=-1, const JKQTPDatastore *datastore=nullptr) |
| add a new point on the graph to the internal datastore for hitTest(), this variant uses formatHitTestDefaultLabel() to auto-generate the label | |
| void | clearHitTestData () |
| clear the internal datastore for hitTest() | |
| virtual QString | formatHitTestDefaultLabel (double x, double y, int index=-1, const JKQTPDatastore *datastore=nullptr) const |
| tool-function for hitTest(), which formats a default label, taking into account the x- and y-position (both provided) and optionally the errors of these positions. | |
| void | reserveHitTestData (int points) |
| reserve list entries for up to points graph points in the internal datastore for hitTest() | |
| QString | xFloatToString (double v, int past_comma=-1) const |
| converts a x-value v into a string, taking into account the type of x-axis | |
| QString | yFloatToString (double v, int past_comma=-1) const |
| converts a x-value v into a string, taking into account the type of x-axis | |
| Protected Attributes inherited from JKQTPFilledCurveGraphBase | |
| FillMode | m_fillMode |
| specifies how the area of the graph is filles | |
| JKQTPGraphFillStyleMixin | m_fillStyleBelow |
if m_fillMode ==FillAboveAndBelowDifferently then this fill style is used below the baseline and the default fill style is used above | |
| Protected Attributes inherited from JKQTPXYBaselineGraph | |
| double | m_baseline |
| baseline of the plot (NOTE: 0 is interpreted as until plot border in log-mode!!!) | |
| Protected Attributes inherited from JKQTPXYGraph | |
| QVector< int > | sortedIndices |
| this array contains the order of indices, in which to access the data in the data columns | |
| Protected Attributes inherited from JKQTPPlotElement | |
| QVector< HitTestLocation > | m_hitTestData |
| dataset with graph-points and associated data from the function hitTest() | |
| JKQTBasePlotter * | parent |
| the plotter object this object belongs to | |
| int | parentPlotStyle |
| internal storage for the used parent plot style | |
| Properties inherited from JKQTPXYBaselineGraph | |
| double | baseline |
| Properties inherited from JKQTPXYGraph | |
| DataSortOrder | sortData |
if !=Unsorted, the data is sorted before plotting | |
| int | xColumn |
| the column that contains the x-component of the datapoints | |
| int | yColumn |
| the column that contains the y-component of the datapoints | |
| Properties inherited from JKQTPPlotElement | |
| bool | highlighted |
| indicates whether the graph is shown in a "highlghted" in the plot | |
| QString | title |
| title of the plot (for display in key!). If no title is supplied, no key entry is drawn. | |
| bool | visible |
| indicates whether the graph is visible in the plot | |
| JKQTPCoordinateAxisRef | xAxisRef |
| indicates which coordinate axis to use for coordinate transforms in x-direction | |
| JKQTPCoordinateAxisRef | yAxisRef |
| indicates which coordinate axis to use for coordinate transforms in y-direction | |
| Properties inherited from JKQTPGraphLineAndFillStyleMixin | |
| bool | drawLine |
| bool | fillCurve |
| Properties inherited from JKQTPGraphFillStyleMixin | |
| QColor | fillColor |
| Qt::BrushStyle | fillStyle |
| Properties inherited from JKQTPGraphLineStyleMixin | |
| QColor | highlightingLineColor |
| QColor | lineColor |
| Qt::PenStyle | lineStyle |
| double | lineWidth |
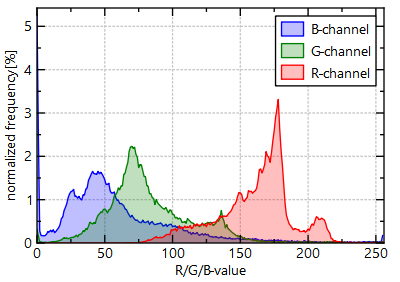
This implements filled curve plots where the area is filled between the plot line and the x-Axis.
This class also provides the possibility to file above and below the baseline with different style. Such plots are sometimes called "Wiggle Plots" and are often used (in their black/white-variety for seismographic data plotting.
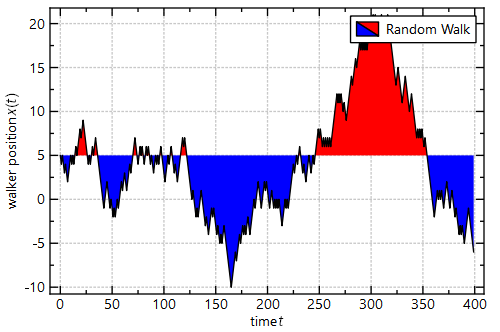
To generate such a plot, used JKQTPFilledCurveXGraph::setFillMode(JKQTPFilledCurveXGraph::FillMode::TwoColorFilling) and then use JKQTPFilledCurveXGraph::fillStyleBelow() to access the fill style for the area below the baseline and the default fill style to define the fill style above the baseline.
| JKQTPFilledCurveXGraph::JKQTPFilledCurveXGraph | ( | JKQTBasePlotter * | parent = nullptr | ) |
class constructor
| JKQTPFilledCurveXGraph::JKQTPFilledCurveXGraph | ( | JKQTPlotter * | parent | ) |
class constructor
|
overridevirtual |
plots the graph to the plotter object specified as parent
Implements JKQTPPlotElement.
|
overridevirtual |
get the maximum and minimum y-value of the graph
The result is given in the two parameters which are call-by-reference parameters!
Reimplemented from JKQTPXYGraph.
Reimplemented in JKQTPFilledCurveXErrorGraph.