This project (see ./examples/wiggleplots/) demonstrates how to draw "wiggle plots" with JKQtPlotter, using JKQTPFilledCurveXGraph or JKQTPFilledCurveYGraph. Wiggle plots are plots, where the fill color is different above and below the baseline of the plot. They are e.g. used in seismology.
The source code of the main application can be found in wiggleplots.cpp. If creates two different plots that demonstrate two styles of plots and also uses the horizontal and vertical variant of the graph class.
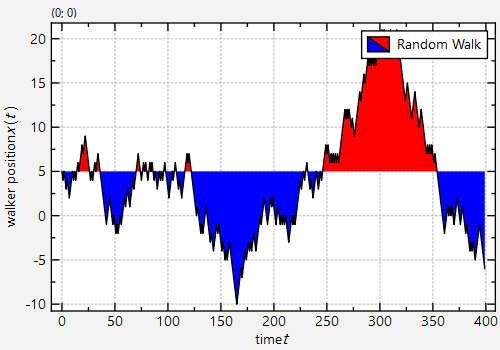
Plot red/blue wiggle plot using JKQTPFilledCurveXGraph
For the first example we simulate a 1D random walk and plot the result as a filles wiggle plot:
In a first step, we obtain a pointer to the JKQTPDatastore and add two columns to it.
const size_t NSteps=400;
const size_t columnX=ds->
addColumn(NSteps,
"position");
This class manages data columns (with entries of type double ), used by JKQTPlotter/JKQTBasePlotter t...
Definition jkqtpdatastorage.h:223
size_t addLinearColumn(size_t rows, double start, double end, const QString &name=QString(""))
add a column to the datastore that contains rows rows with monotonely increasing value starting at st...
size_t addColumn(JKQTPColumn &&col)
add a new column to the datastore and return its ID
Now we fill the column with the random walk data:
double pos=5;
const double stepsize=1;
std::random_device rd;
std::mt19937 gen{rd()};
std::uniform_int_distribution<int> dist(0,1);
for (size_t t=0; t<NSteps; t++) {
ds->
set(columnX, t, pos);
pos=pos+stepsize*(static_cast<double>(dist(gen))*2.0-1.0);
}
void set(size_t column, size_t row, double value)
sets the value at position (column, row). column is the logical column and will be mapped to the acco...
Definition jkqtpdatastorage.h:2586
Now we can generate the actual graph and set its basic properties and data columns:
This implements filled curve plots where the area is filled between the plot line and the x-Axis.
Definition jkqtpfilledcurve.h:103
virtual void setTitle(const QString &__value)
sets the title of the plot (for display in key!).
void setYColumn(int __value)
the column that contains the y-component of the datapoints
void setXColumn(int __value)
the column that contains the x-component of the datapoints
Now we can acrivate the wiggle plot style filling mode and set the fill colors and line color and width.
JKQTPGraphFillStyleMixin & fillStyleBelow()
if m_fillMode ==FillAboveAndBelowDifferently then this fill style is used below the baseline and the ...
@ TwoColorFilling
the area above and below baseline with the two different colors/patterns, generates "wiggle plots",...
Definition jkqtpfilledcurve.h:50
void setFillMode(JKQTPFilledCurveGraphBase::FillMode mode)
specifies how the area of the graph is filles
void setFillColor(const QColor &__value)
set the color of the graph filling
void setLineWidth(double __value)
set the line width of the graph line (in pt)
void setLineColor(const QColor &__value)
set the color of the graph line
The baseline is set to the starting point (5) of the random walk. By default it would be at y=0.
void setBaseline(double __value)
baseline of the plot (NOTE: 0 is interpreted as until plot border in log-mode!!!)
Now we only have to add the graph to the plotter and set some final properties for styling:
plot.addGraph(graph);
plot.getXAxis()->setAxisLabel("time $t$");
plot.getYAxis()->setAxisLabel("walker position $x(t)$");
plot.zoomToFit();
plot.show();
plot.resize(600,400);
This is the resulting plot:
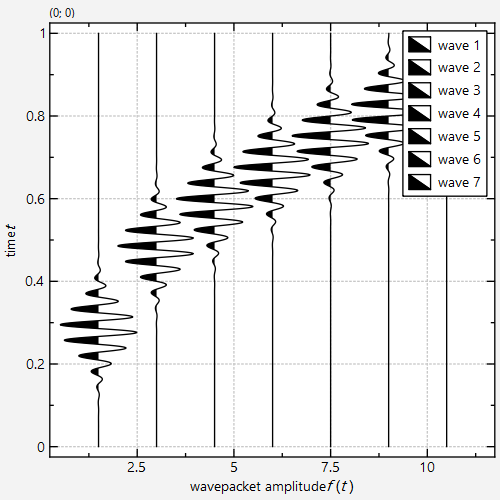
Plot black/transparent wiggle plot using JKQTPFilledCurveYGraph in a "seismographic style"
The second example follows mor or less the same steps as above, but here we add several graphs that each show a wavepacket that is shoft slightly:
const size_t NWavepackets=7;
for (size_t nw=0; nw<NWavepackets; nw++) {
const size_t columnPacket=ds->
addColumn(NSteps,
"wavepacket1");
const double packwidth=0.4/static_cast<double>(NWavepackets);
const double pos=pow(static_cast<double>(nw), 0.6)*packwidth*3.5+5.0*packwidth;
const double wavelength=packwidth/1.5;
const double offset=(static_cast<double>(nw)*1.5+1.5);
for (size_t ti=0; ti<NSteps; ti++) {
const double t=ds->
get(columnT, ti);
ds->
set(columnPacket, ti, offset+sin(2.0*M_PI*t/wavelength)*exp(-0.5*
jkqtp_sqr(t-pos)/
jkqtp_sqr(packwidth)));
}
graph->
setTitle(
"wave "+QString::number(nw+1));
plot.addGraph(graph);
}
double get(size_t column, size_t row) const
returns the value at position (column, row). column is the logical column and will be mapped to the a...
Definition jkqtpdatastorage.h:2561
This implements filled curve plots where the area is filled between the plot line and y-Axis.
Definition jkqtpfilledcurve.h:210
Also the colors are different: We use black below the baseline and transparent above. The line through the data points is black as well.
This is the resulting plot: