|
JKQTPlotter trunk/v5.0.0
an extensive Qt5+Qt6 Plotter framework (including a feature-richt plotter widget, a speed-optimized, but limited variant and a LaTeX equation renderer!), written fully in C/C++ and without external dependencies
|
|
JKQTPlotter trunk/v5.0.0
an extensive Qt5+Qt6 Plotter framework (including a feature-richt plotter widget, a speed-optimized, but limited variant and a LaTeX equation renderer!), written fully in C/C++ and without external dependencies
|
This implements line plots where the data is taken from a user supplied function ![$ [x,y]=f(t) $](form_208_dark.png)
![$ t \in \left[t_\text{min}, t_\text{max}\right] $](form_209_dark.png)
#include <jkqtpevaluatedparametriccurve.h>
Public Member Functions | |
| JKQTPXYFunctionLineGraph (const jkqtpParametricCurveFunctionType &f, const QString &title, double tmin_, double tmax_, JKQTPlotter *parent) | |
| class constructor | |
| JKQTPXYFunctionLineGraph (const jkqtpParametricCurveFunctionType &f, const QString &title, double tmin_=0, double tmax_=1, JKQTBasePlotter *parent=nullptr) | |
| class constructor | |
| JKQTPXYFunctionLineGraph (const jkqtpSimpleParametricCurveFunctionType &f, const QString &title, double tmin_, double tmax_, JKQTPlotter *parent) | |
| class constructor | |
| JKQTPXYFunctionLineGraph (const jkqtpSimpleParametricCurveFunctionType &f, const QString &title, double tmin_=0, double tmax_=1, JKQTBasePlotter *parent=nullptr) | |
| class constructor | |
| JKQTPXYFunctionLineGraph (JKQTBasePlotter *parent=nullptr) | |
| class constructor | |
| JKQTPXYFunctionLineGraph (JKQTPlotter *parent) | |
| class constructor | |
| JKQTPXYFunctionLineGraph (jkqtpParametricCurveFunctionType &&f, const QString &title, double tmin_, double tmax_, JKQTPlotter *parent) | |
| class constructor | |
| JKQTPXYFunctionLineGraph (jkqtpParametricCurveFunctionType &&f, const QString &title, double tmin_=0, double tmax_=1, JKQTBasePlotter *parent=nullptr) | |
| class constructor | |
| JKQTPXYFunctionLineGraph (jkqtpSimpleParametricCurveFunctionType &&f, const QString &title, double tmin_, double tmax_, JKQTPlotter *parent) | |
| class constructor | |
| JKQTPXYFunctionLineGraph (jkqtpSimpleParametricCurveFunctionType &&f, const QString &title, double tmin_=0, double tmax_=1, JKQTBasePlotter *parent=nullptr) | |
| class constructor | |
| virtual | ~JKQTPXYFunctionLineGraph () override |
| class destructor | |
| jkqtpParametricCurveFunctionType | getPlotFunctionFunctor () const |
| the function to be plotted | |
| jkqtpSimpleParametricCurveFunctionType | getSimplePlotFunction () const |
| a simple function to be plotted, simplified form without parameters | |
| bool | isSimplePlotFunction () const |
returns whether the plot function was defined as a jkqtpSimpleParametricCurveFunctionType (true ) or a jkqtpParametricCurveFunctionType (false ) | |
| void | setPlotFunctionFunctor (const jkqtpParametricCurveFunctionType &__value) |
| sets a functor to be plotted | |
| void | setPlotFunctionFunctor (const jkqtpSimpleParametricCurveFunctionType &__value) |
| sets a functor to be plotted | |
| void | setPlotFunctionFunctor (jkqtpParametricCurveFunctionType &&__value) |
| sets a functor to be plotted | |
| void | setPlotFunctionFunctor (jkqtpSimpleParametricCurveFunctionType &&__value) |
| sets a functor to be plotted | |
| Public Member Functions inherited from JKQTPXYFunctionLineGraphBase | |
| JKQTPXYFunctionLineGraphBase (double tmin_, double tmax_, JKQTBasePlotter *parent) | |
| class constructor | |
| JKQTPXYFunctionLineGraphBase (double tmin_, double tmax_, JKQTPlotter *parent) | |
| class constructor | |
| JKQTPXYFunctionLineGraphBase (JKQTBasePlotter *parent=nullptr) | |
| class constructor | |
| JKQTPXYFunctionLineGraphBase (JKQTPlotter *parent) | |
| class constructor | |
| virtual | ~JKQTPXYFunctionLineGraphBase () override |
| class destructor | |
| virtual void | draw (JKQTPEnhancedPainter &painter) override |
| plots the graph to the plotter object specified as parent | |
| virtual void | drawKeyMarker (JKQTPEnhancedPainter &painter, const QRectF &rect) override |
| plots a key marker inside the specified rectangle rect | |
| virtual QColor | getKeyLabelColor () const override |
| returns the color to be used for the key label | |
| double | getTMax () const |
upper bound of t-value range for ![$ [x,y]=f(t), t \in \left[t_\text{min}, t_\text{max}\right] $](form_213_dark.png)  | |
| double | getTMin () const |
| lower bound of t-value range for | |
| QPair< double, double > | getTRange () const |
| returns the t-value range for | |
| Public Member Functions inherited from JKQTPEvaluatedFunctionGraphBase | |
| JKQTPEvaluatedFunctionGraphBase (JKQTBasePlotter *parent=nullptr) | |
| class constructor | |
| JKQTPEvaluatedFunctionGraphBase (JKQTPlotter *parent) | |
| class constructor | |
| virtual | ~JKQTPEvaluatedFunctionGraphBase () |
| class destructor | |
| double | getDataCleanupMaxAllowedAngleDegree () const |
| in the clean-up step of plot-data creation, a point is removed from the data, if it caused its neighboring line-segments to form an angle less than this value, given in degrees. | |
| bool | getDisplaySamplePoints () const |
| if true [default: off] display the points where the function has been sampled | |
| QVector< double > & | getInternalParams () |
| returns the currently set internal parameter vector | |
| const QVector< double > & | getInternalParams () const |
| returns the currently set internal parameter vector | |
| unsigned int | getMaxRefinementDegree () const |
| the maximum number of recursive refinement steps | |
| double | getMinPixelPerSample () const |
| create one sample at least every minPixelPerSample pixels | |
| unsigned int | getMinSamples () const |
| the minimum number of points to evaluate the function at | |
| int | getParameterColumn () const |
if set, the values from this datatsore column are used for the parameters p1 , p2 , p3 , ... of the plot function | |
| double | getSlopeTolerance () const |
| the tolerance for the difference of two subsequent slopes | |
| virtual bool | getXMinMax (double &minx, double &maxx, double &smallestGreaterZero) override |
| get the maximum and minimum x-value of the graph | |
| virtual bool | getYMinMax (double &miny, double &maxy, double &smallestGreaterZero) override |
| get the maximum and minimum y-value of the graph | |
| void | setCopiedParams (const double *params, int N) |
| sets the params from a copy of the given array of length N | |
| virtual void | setParams (const QVector< double > ¶ms) |
| sets the params as a pointer to an internal COPY of the given vector (not the data of the vector, as then the size would be unknown!!!) | |
| virtual bool | usesColumn (int c) const override |
returns true if the given column is used by the graph | |
| Public Member Functions inherited from JKQTPGraph | |
| JKQTPGraph (JKQTBasePlotter *parent=nullptr) | |
| class constructor | |
| virtual | ~JKQTPGraph ()=default |
| default wirtual destructor | |
| Public Member Functions inherited from JKQTPPlotElement | |
| JKQTPPlotElement (JKQTBasePlotter *parent=nullptr) | |
| class constructor | |
| virtual | ~JKQTPPlotElement ()=default |
| default wirtual destructor | |
| QPointF | backTransform (const QPointF &x) const |
| tool routine that back-transforms a QPointF according to the parent's transformation rules (pixels --> plot coordinate) | |
| QPointF | backTransform (double x, double y) const |
| tool routine that back-transforms a QPointF according to the parent's transformation rules (pixels --> plot coordinate) | |
| double | backtransformX (double x) const |
| tool routine that backtransforms an x-coordinate (pixels --> plot coordinate) for this plot element, uses the axis referenced in xAxisRef | |
| double | backtransformY (double y) const |
| tool routine that backtransforms a y-coordinate (pixels --> plot coordinate) for this plot element, uses the axis referenced in yAxisRef | |
| virtual void | drawOutside (JKQTPEnhancedPainter &painter, QRect leftSpace, QRect rightSpace, QRect topSpace, QRect bottomSpace) |
| plots outside the actual plot field of view (e.g. color bars, scale bars, ...) | |
| QImage | generateKeyMarker (QSize size=QSize(16, 16)) |
| returns an image with a key marker inside | |
| virtual void | getOutsideSize (JKQTPEnhancedPainter &painter, int &leftSpace, int &rightSpace, int &topSpace, int &bottomSpace) |
| if the graph plots outside the actual plot field of view (e.g. color bars, scale bars, ...) | |
| JKQTBasePlotter * | getParent () |
| returns the parent painter class | |
| const JKQTBasePlotter * | getParent () const |
| returns the parent painter class | |
| QString | getTitle () const |
| returns the the title of the plot | |
| const JKQTPCoordinateAxis * | getXAxis () const |
| returns the actual x-Axis-object from the parent plotter, referenced in xAxisRef | |
| JKQTPCoordinateAxisRef | getXAxisRef () const |
| indicates which coordinate axis to use for coordinate transforms in x-direction | |
| const JKQTPCoordinateAxis * | getYAxis () const |
| returns the actual y-Axis-object from the parent plotter, referenced in yAxisRef | |
| JKQTPCoordinateAxisRef | getYAxisRef () const |
| indicates which coordinate axis to use for coordinate transforms in y-direction | |
| virtual double | hitTest (const QPointF &posSystem, QPointF *closestSpotSystem=nullptr, QString *label=nullptr, HitTestMode mode=HitTestXY) const |
returns the closest distance of the plot element to the (screen pixel) position pos, or NAN | |
| bool | isHighlighted () const |
| returns whether the graph is shown in a highlighted style in the plot | |
| bool | isVisible () const |
| returns whether the graph is visible in the plot | |
| void | setAxes (JKQTPCoordinateAxisRef ref) |
| set the coordinate axes to use for this plot element | |
| virtual void | setParent (JKQTBasePlotter *parent) |
| sets the parent painter class | |
| virtual void | setParent (JKQTPlotter *parent) |
| sets the parent painter class | |
| void | setXAxis (JKQTPCoordinateAxisRef ref) |
| indicates which coordinate axis to use for coordinate transforms in x-direction | |
| void | setYAxis (JKQTPCoordinateAxisRef ref) |
| indicates which coordinate axis to use for coordinate transforms in y-direction | |
| QPointF | transform (const QPointF &x) const |
| tool routine that transforms a QPointF according to the parent's transformation rules (plot coordinate --> pixels) | |
| QPolygonF | transform (const QPolygonF &x) const |
| tool routine that transforms a QPolygonF according to the parent's transformation rules (plot coordinate --> pixels) | |
| QPointF | transform (double x, double y) const |
| tool routine that transforms a QPointF according to the parent's transformation rules (plot coordinate --> pixels) | |
| QPainterPath | transformToLinePath (const QPolygonF &x) const |
| tool routine that transforms a QPolygonF according to the parent's transformation rules and returns a (non-closed) path consisting of lines (plot coordinate --> pixels) | |
| QVector< double > | transformX (const QVector< double > &x) const |
| transform all x-coordinates in a vector x | |
| double | transformX (double x) const |
| tool routine that transforms an x-coordinate (plot coordinate --> pixels) for this plot element, uses the axis referenced in xAxisRef | |
| QVector< double > | transformY (const QVector< double > &x) const |
| transform all y-coordinates in a vector x | |
| double | transformY (double y) const |
| tool routine that transforms a y-coordinate (plot coordinate --> pixels) for this plot element, uses the axis referenced in yAxisRef | |
| Public Member Functions inherited from JKQTPGraphLineStyleMixin | |
| JKQTPGraphLineStyleMixin () | |
| class constructor | |
| virtual | ~JKQTPGraphLineStyleMixin () |
| QColor | getHighlightingLineColor () const |
| get the color of the graph line when highlighted | |
| QPen | getHighlightingLinePen (JKQTPEnhancedPainter &painter, JKQTBasePlotter *parent) const |
| constructs a QPen from the line styling properties | |
| QPen | getHighlightingLinePenForRects (JKQTPEnhancedPainter &painter, JKQTBasePlotter *parent) const |
| constructs a QPen from the line styling properties, suitable for drawing rectangle with sharp corners | |
| QPen | getKeyLinePen (JKQTPEnhancedPainter &painter, const QRectF &rect, JKQTBasePlotter *parent) const |
| constructs a QPen from the line styling properties, but uses getKeyLineWidthPx() for the width, i.e. constructs a pen for drawing lines in key-symbols | |
| double | getKeyLineWidthPx (JKQTPEnhancedPainter &painter, const QRectF &keyRect, const JKQTBasePlotter *parent) const |
| returns the linewidth for drawing lines in a key entry with keyRect for the symbol, using painter and parent . | |
| QBrush | getLineBrush () const |
| gets the brush used to fill the line area | |
| Qt::PenCapStyle | getLineCapStyle () const |
| gets the cap style | |
| QColor | getLineColor () const |
| get the color of the graph line | |
| qreal | getLineDashOffset () const |
| returns the dash offset for a custom dash style | |
| QVector< qreal > | getLineDashPattern () const |
| gets the dash pattern for a custom dash style | |
| Qt::PenJoinStyle | getLineJoinStyle () const |
| returns the join style | |
| QPen | getLinePen (JKQTPEnhancedPainter &painter, JKQTBasePlotter *parent) const |
| constructs a QPen from the line styling properties | |
| QPen | getLinePenForRects (JKQTPEnhancedPainter &painter, JKQTBasePlotter *parent) const |
| constructs a QPen from the line styling properties, suitable for drawing rectangles with sharp edges | |
| Qt::PenStyle | getLineStyle () const |
| get the style of the graph line | |
| double | getLineWidth () const |
| get the line width of the graph line (in pt) | |
| void | initLineStyle (JKQTBasePlotter *parent, int &parentPlotStyle, JKQTPPlotStyleType styletype=JKQTPPlotStyleType::Default) |
| initiaize the line style (from the parent plotter) | |
| void | setHighlightingLineColor (const QColor &__value) |
| set the color of the graph line when highlighted | |
| void | setHighlightingLineColor (const QColor &__value, double alpha) |
| set the color of the graph line when highlighted | |
| void | setLineBrush (const QBrush &style) |
| sets the brush used to fill the line area | |
| void | setLineCapStyle (Qt::PenCapStyle style) |
| sets the cap style | |
| void | setLineColor (const QColor &__value) |
| set the color of the graph line | |
| void | setLineColor (const QColor &__value, double alpha) |
| set the color of the graph line | |
| void | setLineColorInvertedFrom (QColor __noninvertedColor) |
| sets the line-color as an inverted version of the given color | |
| void | setLineDashOffset (qreal offset) |
| sets the dash offset for a custom dash style | |
| void | setLineDashPattern (const QVector< qreal > &pattern) |
| sets the dash pattern for a custom dash style | |
| void | setLineJoinStyle (Qt::PenJoinStyle style) |
| sets the join style | |
| void | setLineStyle (Qt::PenStyle __value) |
| set the style of the graph line | |
| void | setLineWidth (double __value) |
| set the line width of the graph line (in pt) | |
Protected Member Functions | |
| virtual PlotFunctorSpec | buildPlotFunctorSpec () override |
| this function returns a functor that is used to generate the plot data in coordinate space, based on a range of the dependent variable in coordinate space. In addition it also contains the value range over which to evaluate the functor PlotFunctorSpec::func | |
| Protected Member Functions inherited from JKQTPEvaluatedFunctionGraphBase | |
| virtual void | collectParameters () |
| ensure that current function parameters for a plot function (which may stem from different sources, as direct data, a datastore column ...) are stored in iparams | |
| virtual void | createPlotData (bool collectParams=true) |
| fill the data array with data from the function plotFunction | |
| void | drawSamplePoints (JKQTPEnhancedPainter &painter, QColor graphColor) |
| draw all the sample points in data as small symbols | |
| Protected Member Functions inherited from JKQTPGraph | |
| virtual void | drawErrorsAfter (JKQTPEnhancedPainter &) |
| this function is used to plot error inidcators after plotting the graphs. | |
| virtual void | drawErrorsBefore (JKQTPEnhancedPainter &) |
| this function is used to plot error inidcators before plotting the graphs. | |
| bool | getDataMinMax (int column, double &minx, double &maxx, double &smallestGreaterZero) |
| get the maximum and minimum value of the given column | |
| Protected Member Functions inherited from JKQTPPlotElement | |
| void | addHitTestData (const HitTestLocation &loc) |
| clear the internal datastore for hitTest() | |
| void | addHitTestData (const QPointF &pos_, const QString &label_) |
| clear the internal datastore for hitTest() | |
| void | addHitTestData (const QPointF &pos_, int index_, const QString &label_) |
| clear the internal datastore for hitTest() | |
| void | addHitTestData (const QPointF &pos_, int index_=-1, const JKQTPDatastore *datastore=nullptr) |
| clear the internal datastore for hitTest(), this variant uses formatHitTestDefaultLabel() to auto-generate the label | |
| void | addHitTestData (double x_, double y_, const QString &label_) |
| add a new point on the graph to the internal datastore for hitTest() | |
| void | addHitTestData (double x_, double y_, int index_, const QString &label_) |
| clear the internal datastore for hitTest() | |
| void | addHitTestData (double x_, double y_, int index_=-1, const JKQTPDatastore *datastore=nullptr) |
| add a new point on the graph to the internal datastore for hitTest(), this variant uses formatHitTestDefaultLabel() to auto-generate the label | |
| void | clearHitTestData () |
| clear the internal datastore for hitTest() | |
| virtual QString | formatHitTestDefaultLabel (double x, double y, int index=-1, const JKQTPDatastore *datastore=nullptr) const |
| tool-function for hitTest(), which formats a default label, taking into account the x- and y-position (both provided) and optionally the errors of these positions. | |
| void | reserveHitTestData (int points) |
| reserve list entries for up to points graph points in the internal datastore for hitTest() | |
| QString | xFloatToString (double v, int past_comma=-1) const |
| converts a x-value v into a string, taking into account the type of x-axis | |
| QString | yFloatToString (double v, int past_comma=-1) const |
| converts a x-value v into a string, taking into account the type of x-axis | |
Protected Attributes | |
| jkqtpParametricCurveFunctionType | plotFunction |
| the function to be plotted | |
| jkqtpSimpleParametricCurveFunctionType | simplePlotFunction |
| a simple function to be plotted, simplified form without parameters | |
| Protected Attributes inherited from JKQTPXYFunctionLineGraphBase | |
| double | tmax |
| upper bound of t-value range for | |
| double | tmin |
| lower bound of t-value range for | |
| Protected Attributes inherited from JKQTPEvaluatedFunctionGraphBase | |
| QVector< QPointF > | data |
plot data calculated by createPlotData(), i.e. the datapoints  | |
| double | dataCleanupMaxAllowedAngleDegree |
| in the clean-up step of plot-data creation, a point is removed from the data, if it caused its neighboring line-segments to form an angle less than this value, given in degrees. | |
| bool | displaySamplePoints |
| if true [default: off] display the points where the function has been sampled | |
| QVector< double > | iparams |
| internal storage for the current function parameters for plotFunction (which may stem from different sources, as direct data, a datastore column ...) | |
| unsigned int | maxRefinementDegree |
| the maximum number of recursive refinement steps | |
| double | minPixelPerSample |
| create one sample at least every minPixelPerSample pixels | |
| unsigned int | minSamples |
| the minimum number of points to evaluate the function at | |
| int | parameterColumn |
if set, the values from this datatsore column are used for the parameters p1 , p2 , p3 , ... of the plot function | |
| double | slopeTolerance |
| the tolerance for the difference of two subsequent slopes | |
| Protected Attributes inherited from JKQTPPlotElement | |
| QVector< HitTestLocation > | m_hitTestData |
| dataset with graph-points and associated data from the function hitTest() | |
| JKQTBasePlotter * | parent |
| the plotter object this object belongs to | |
| int | parentPlotStyle |
| internal storage for the used parent plot style | |
Additional Inherited Members | |
| Public Types inherited from JKQTPPlotElement | |
| enum | HitTestMode { HitTestXY , HitTestXOnly , HitTestYOnly } |
| modes of operation for the function hitTest() More... | |
| Public Slots inherited from JKQTPXYFunctionLineGraphBase | |
| void | setTMax (double val) |
| upper bound of t-value range for | |
| void | setTMin (double val) |
| lower bound of t-value range for | |
| void | setTRange (const QPair< double, double > &range) |
| set the t-value range for | |
| void | setTRange (double tmin_, double tmax_) |
| set the t-value range for | |
| Public Slots inherited from JKQTPEvaluatedFunctionGraphBase | |
| void | setDataCleanupMaxAllowedAngleDegree (double __value) |
| in the clean-up step of plot-data creation, a point is removed from the data, if it caused its neighboring line-segments to form an angle less than this value, given in degrees. | |
| void | setDisplaySamplePoints (bool __value) |
| if true [default: off] display the points where the function has been sampled | |
| void | setMaxRefinementDegree (const unsigned int &__value) |
| the maximum number of recursive refinement steps | |
| void | setMinPixelPerSample (double __value) |
| create one sample at least every minPixelPerSample pixels | |
| void | setMinSamples (const unsigned int &__value) |
| the minimum number of points to evaluate the function at | |
| void | setParameterColumn (int __value) |
if set, the values from this datatsore column are used for the parameters p1 , p2 , p3 , ... of the plot function | |
| void | setParameterColumn (size_t __value) |
if set, the values from this datatsore column are used for the parameters p1 , p2 , p3 , ... of the plot function | |
| void | setParamsV (double p1) |
| set an internal parameter vector as function parameters, initialized with {p1} | |
| void | setParamsV (double p1, double p2) |
| set an internal parameter vector as function parameters, initialized with {p1,p2} | |
| void | setParamsV (double p1, double p2, double p3) |
| set an internal parameter vector as function parameters, initialized with {p1,p2,p3} | |
| void | setParamsV (double p1, double p2, double p3, double p4) |
| set an internal parameter vector as function parameters, initialized with {p1,p2,p3,p4} | |
| void | setParamsV (double p1, double p2, double p3, double p4, double p5) |
| set an internal parameter vector as function parameters, initialized with {p1,p2,p3,p4,p5} | |
| void | setSlopeTolerance (double __value) |
| the tolerance for the difference of two subsequent slopes | |
| Public Slots inherited from JKQTPPlotElement | |
| void | setHighlighted (bool __value) |
| sets whether the graph is drawn in a highlighted style in the plot | |
| virtual void | setTitle (const QString &__value) |
| sets the title of the plot (for display in key!). | |
| void | setVisible (bool __value) |
| sets whether the graph is visible in the plot | |
| Properties inherited from JKQTPPlotElement | |
| bool | highlighted |
| indicates whether the graph is shown in a "highlghted" in the plot | |
| QString | title |
| title of the plot (for display in key!). If no title is supplied, no key entry is drawn. | |
| bool | visible |
| indicates whether the graph is visible in the plot | |
| JKQTPCoordinateAxisRef | xAxisRef |
| indicates which coordinate axis to use for coordinate transforms in x-direction | |
| JKQTPCoordinateAxisRef | yAxisRef |
| indicates which coordinate axis to use for coordinate transforms in y-direction | |
| Properties inherited from JKQTPGraphLineStyleMixin | |
| QColor | highlightingLineColor |
| QColor | lineColor |
| Qt::PenStyle | lineStyle |
| double | lineWidth |
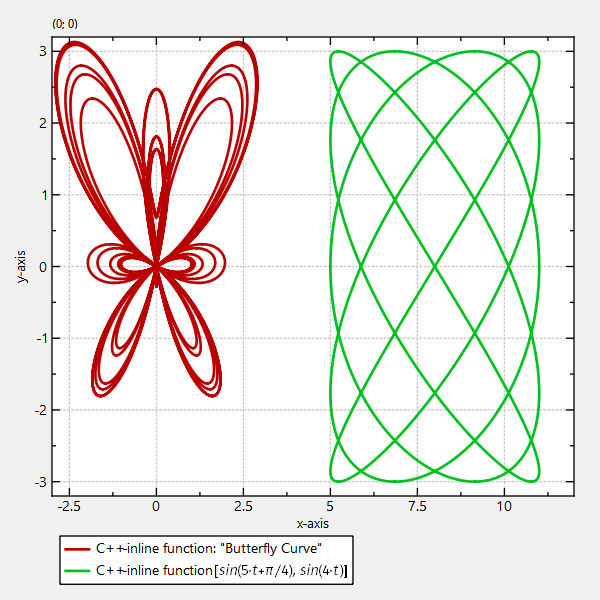
This implements line plots where the data is taken from a user supplied function
The following image shows a Lissajou's fugure drawn with this function
The source code for this example is:
The source code for the same example, but using functions that also get a parameter vector:
| JKQTPXYFunctionLineGraph::JKQTPXYFunctionLineGraph | ( | JKQTBasePlotter * | parent = nullptr | ) |
class constructor
| JKQTPXYFunctionLineGraph::JKQTPXYFunctionLineGraph | ( | JKQTPlotter * | parent | ) |
class constructor
| JKQTPXYFunctionLineGraph::JKQTPXYFunctionLineGraph | ( | const jkqtpSimpleParametricCurveFunctionType & | f, |
| const QString & | title, | ||
| double | tmin_ = 0, | ||
| double | tmax_ = 1, | ||
| JKQTBasePlotter * | parent = nullptr ) |
class constructor
| JKQTPXYFunctionLineGraph::JKQTPXYFunctionLineGraph | ( | const jkqtpSimpleParametricCurveFunctionType & | f, |
| const QString & | title, | ||
| double | tmin_, | ||
| double | tmax_, | ||
| JKQTPlotter * | parent ) |
class constructor
| JKQTPXYFunctionLineGraph::JKQTPXYFunctionLineGraph | ( | jkqtpSimpleParametricCurveFunctionType && | f, |
| const QString & | title, | ||
| double | tmin_ = 0, | ||
| double | tmax_ = 1, | ||
| JKQTBasePlotter * | parent = nullptr ) |
class constructor
| JKQTPXYFunctionLineGraph::JKQTPXYFunctionLineGraph | ( | jkqtpSimpleParametricCurveFunctionType && | f, |
| const QString & | title, | ||
| double | tmin_, | ||
| double | tmax_, | ||
| JKQTPlotter * | parent ) |
class constructor
| JKQTPXYFunctionLineGraph::JKQTPXYFunctionLineGraph | ( | const jkqtpParametricCurveFunctionType & | f, |
| const QString & | title, | ||
| double | tmin_ = 0, | ||
| double | tmax_ = 1, | ||
| JKQTBasePlotter * | parent = nullptr ) |
class constructor
| JKQTPXYFunctionLineGraph::JKQTPXYFunctionLineGraph | ( | const jkqtpParametricCurveFunctionType & | f, |
| const QString & | title, | ||
| double | tmin_, | ||
| double | tmax_, | ||
| JKQTPlotter * | parent ) |
class constructor
| JKQTPXYFunctionLineGraph::JKQTPXYFunctionLineGraph | ( | jkqtpParametricCurveFunctionType && | f, |
| const QString & | title, | ||
| double | tmin_ = 0, | ||
| double | tmax_ = 1, | ||
| JKQTBasePlotter * | parent = nullptr ) |
class constructor
| JKQTPXYFunctionLineGraph::JKQTPXYFunctionLineGraph | ( | jkqtpParametricCurveFunctionType && | f, |
| const QString & | title, | ||
| double | tmin_, | ||
| double | tmax_, | ||
| JKQTPlotter * | parent ) |
class constructor
|
overridevirtual |
class destructor
|
overrideprotectedvirtual |
this function returns a functor that is used to generate the plot data in coordinate space, based on a range of the dependent variable in coordinate space. In addition it also contains the value range over which to evaluate the functor PlotFunctorSpec::func
This function has to be overridden by each class. Depending on the way that class defines the actual plot function, this function has to compose its return type in different ways. The three most common ways are:

![$ [x, f(x)] $](form_192_dark.png)

![$ [f(y), y] $](form_194_dark.png)
![$ [x,y]=\vec{f}(t) $](form_190_dark.png)


Implements JKQTPEvaluatedFunctionGraphBase.
| jkqtpParametricCurveFunctionType JKQTPXYFunctionLineGraph::getPlotFunctionFunctor | ( | ) | const |
the function to be plotted
| jkqtpSimpleParametricCurveFunctionType JKQTPXYFunctionLineGraph::getSimplePlotFunction | ( | ) | const |
a simple function to be plotted, simplified form without parameters
| bool JKQTPXYFunctionLineGraph::isSimplePlotFunction | ( | ) | const |
returns whether the plot function was defined as a jkqtpSimpleParametricCurveFunctionType (true ) or a jkqtpParametricCurveFunctionType (false )
| void JKQTPXYFunctionLineGraph::setPlotFunctionFunctor | ( | const jkqtpParametricCurveFunctionType & | __value | ) |
sets a functor to be plotted
| void JKQTPXYFunctionLineGraph::setPlotFunctionFunctor | ( | const jkqtpSimpleParametricCurveFunctionType & | __value | ) |
sets a functor to be plotted
| void JKQTPXYFunctionLineGraph::setPlotFunctionFunctor | ( | jkqtpParametricCurveFunctionType && | __value | ) |
sets a functor to be plotted
| void JKQTPXYFunctionLineGraph::setPlotFunctionFunctor | ( | jkqtpSimpleParametricCurveFunctionType && | __value | ) |
sets a functor to be plotted
|
protected |
the function to be plotted
|
protected |
a simple function to be plotted, simplified form without parameters