|
| void | copyData () |
| | copy the data used for the current plot to the clipboard
|
| void | copyDataMatlab () |
| | copy the data used for the current plot to the clipboard as a Matlab script
|
| void | openContextMenu () |
| | open the context menu at the mouse position of the last click
|
| void | openContextMenu (int x, int y) |
| | open the context menu at the mouse position x and y
|
| void | openSpecialContextMenu () |
| | open the special context menu at the mouse position of the last click
|
| void | openSpecialContextMenu (int x, int y) |
| | open the special context menu at the mouse position x and y
|
| void | openStandardAndSpecialContextMenu () |
| | open the standard context menu with the special context menu integrated at the mouse position of the last click
|
| void | openStandardAndSpecialContextMenu (int x, int y) |
| | open the standard context menu with the special context menu integrated at the mouse position x and y
|
| void | openStandardContextMenu () |
| | open the standard context menu at the mouse position of the last click
|
| void | openStandardContextMenu (int x, int y) |
| | open the standard context menu at the mouse position x and y
|
| void | populateToolbar (QToolBar *toolbar) const |
| | popuplate the given toolbar toolbar with all actions shown in a toolbar from this class ...
|
| void | print (QPrinter *printer=nullptr) |
| | print the current plot, if printer is nullptr a printer selection dialog is displayed
|
| void | redrawPlot () |
| | update the plot and the overlays
|
| void | saveAsCSV (const QString &filename=QString("")) |
| | save the current plot data as a Comma Separated Values (CSV) file
|
| void | saveAsDIF (const QString &filename=QString("")) |
| | save the current plot data as a Data Interchange Format file (see https://en.wikipedia.org/wiki/Data_Interchange_Format).
|
| void | saveAsGerExcelCSV (const QString &filename=QString("")) |
| | save the current plot data as a Semicolon Separated Values (CSV) file for german Excel, i.e. with comma as decimal separator
|
| void | saveAsMatlab (const QString &filename=QString("")) |
| | save the current plot data as a Matlab Script
|
| bool | saveAsPDF (const QString &filename=QString(""), bool displayPreview=true) |
| | save the current plot as a PDF file, with the current widget aspect ratio, if filename is empty a file selection dialog is displayed
|
| bool | saveAsPixelImage (const QString &filename=QString(""), bool displayPreview=true, const QByteArray &outputFormat=QByteArray(), const QSize &outputSizeIncrease=QSize(0, 0)) |
| | save the current plot as a pixel image image (PNG ...), if filename is empty a file selection dialog is displayed
|
| void | saveAsSemicolonSV (const QString &filename=QString("")) |
| | save the current plot data as a Semicolon Separated Values (SSV) file
|
| bool | saveAsSVG (const QString &filename=QString(""), bool displayPreview=true) |
| | save the current plot as a SVG file, with the current widget aspect ratio, if filename is empty a file selection dialog is displayed
|
| void | saveAsSYLK (const QString &filename=QString("")) |
| | save the current plot data as a SYmbolik LinK (SYLK) spreadsheet file (see https://en.wikipedia.org/wiki/Symbolic_Link_(SYLK) )
|
| void | saveAsTabSV (const QString &filename=QString("")) |
| | save the current plot data as a Tabulator Separated Values (CSV) file
|
| void | saveData (const QString &filename=QString(""), const QString &format=QString("")) |
| | save the data used for the current plot. The file format is extracted from the file extension (csv, ...)
|
| bool | saveImage (const QString &filename=QString(""), bool displayPreview=true) |
| | save the current plot as an image file, with the current widget aspect ratio, if filename is empty a file selection dialog is displayed. The image format is extracted from the file extension (jpeg, tiff, png, pdf, ...)
|
| void | setAbsoluteX (double xminn, double xmaxx) |
| | sets absolutely limiting x-range of the plot
|
| void | setAbsoluteXY (double xminn, double xmaxx, double yminn, double ymaxx) |
| | sets absolutely limiting x- and y-range of the plot
|
| void | setAbsoluteY (double yminn, double ymaxx) |
| | sets absolute minimum and maximum y-value to plot
|
| void | setContextMenuMode (JKQTPContextMenuModes mode) |
| | sets the mode if the standard context menu
|
| void | setGrid (bool val) |
| | sets whether the major grid lines of the major axes are shown
|
| void | setGridColor (QColor color) |
| | sets the color of all major grid lines (of the major x- and y-axis)
|
| void | setGridStyle (Qt::PenStyle __value) |
| | sets the style of all Major grid lines
|
| void | setGridWidth (double __value) |
| | sets the width of all Major grid lines
|
| void | setMagnification (double m) |
| | set the current plot magnification
|
| void | setMaxTooltipDistance (int v) |
| | maximum distance at which a tooltip for a point is still displayed, when the user action jkqtpmdaToolTipForClosestDataPoint is executed
|
| void | setMinorGridColor (QColor color) |
| | sets the color of all minor grid lines
|
| void | setMinorGridStyle (Qt::PenStyle __value) |
| | sets the style of all minor grid lines
|
| void | setMinorGridWidth (double __value) |
| | sets the width of all minor grid lines
|
| void | setMouseActionToolbarActionsActive (bool __value) |
| | allows to activate/deactivate toolbar buttons that can activate certain mouse drag actions
|
| void | setMousePositionShown (bool __value) |
| | specifies whether to display the current position of the mouse in the top border of the plot (this may automatically extent the top border, so the position fits in. The default widget font is used for the output.
|
| void | setShowZeroAxes (bool showX, bool showY) |
| | switches the visibility of the zero-axes associated with the x- and y-axis
|
| void | setShowZeroAxes (bool showXY) |
| | switches the visibility of the zero-axes associated with the major x- and y-axis
|
| void | setToolbarAlwaysOn (bool __value) |
| | returns whether the toolbar is always visible or only when the mouse moves to the upper left area
|
| void | setToolbarEnabled (bool __value) |
| | returns whether the toolbar is enabled
|
| void | setUserActionCatchSensitivity (int v) |
| | sensitivity (i.e. max. distance to see as one point) for user actions
|
| void | setUserActionMarkerBrush (const QBrush &__value) |
| | pen for location markers of user actions on the plot
|
| void | setUserActionMarkerDiameter (int v) |
| | size (diameter) of markers drawn by user actions
|
| void | setUserActionMarkerPen (const QPen &__value) |
| | pen for location markers of user actions on the plot
|
| void | setUserActionMarkerType (JKQTPUserActionMarkerType v) |
| | type of the location markers of user actions on the plot
|
| void | setUserActionOpaqueBrush (const QBrush &__value) |
| | pen for user actions that cover parts of the plot (typically opaque, like e.g. tooltips)
|
| void | setUserActionOpaquePen (const QPen &__value) |
| | pen for user actions that cover parts of the plot (typically opaque, like e.g. tooltips)
|
| void | setUserActionOverlayBrush (const QBrush &__value) |
| | pen for user actions that overlay the plot (typically semi-transparent, like e.g. zoom-rectangles)
|
| void | setUserActionOverlayPen (const QPen &__value) |
| | pen for user actions that overlay the plot (typically semi-transparent, like e.g. zoom-rectangles)
|
| void | setX (double xminn, double xmaxx) |
| | sets the x-range of the plot (minimum and maximum x-value on the x-axis)
|
| void | setXY (double xminn, double xmaxx, double yminn, double ymaxx, bool affectsSecondaryAxes=false) |
| | sets the x- and y-range of the plot (minimum and maximum values on the x-/y-axis)
|
| void | setY (double yminn, double ymaxx) |
| | sets the y-range of the plot (minimum and maximum y-value on the y-axis)
|
| void | synchronizeXAxis (double newxmin, double newxmax, double newymin, double newymax, JKQTPlotter *sender) |
| | may be connected to zoomChangedLocally() of a different plot and synchronizes the local x-axis to the other x-axis
|
| void | synchronizeXYAxis (double newxmin, double newxmax, double newymin, double newymax, JKQTPlotter *sender) |
| | may be connected to zoomChangedLocally() of a different plot and synchronizes the local x- and y-axis to the other x- and y-axis
|
| void | synchronizeYAxis (double newxmin, double newxmax, double newymin, double newymax, JKQTPlotter *sender) |
| | may be connected to zoomChangedLocally() of a different plot and synchronizes the local y-axis to the other y-axis
|
| void | zoom (double xminn, double xmaxn, double yminn, double ymaxn, bool affectsSecondaryAxes=false) |
| | sets the x- and y-range of the plot (minimum and maximum values on the x-/y-axis)
|
| void | zoomIn (double factor=2.0) |
| | zooms into the graph (the same as turning the mouse wheel) by the given factor
|
| void | zoomOut (double factor=2.0) |
| | zooms out of the graph (the same as turning the mouse wheel) by the given factor
|
| void | zoomToFit (bool zoomX=true, bool zoomY=true, bool includeX0=false, bool includeY0=false, double scaleX=1.05, double scaleY=1.05) |
| | this method zooms the graph so that all plotted datapoints are visible.
|
|
| void | beforePlotScalingRecalculate () |
| | emitted before the plot scaling has been recalculated
|
| void | contextMenuOpened (double x, double y, QMenu *contextMenu) |
| | emitted whenever a context menu is opened. You can modify the menu via the parameter contextMenu!
|
| void | plotMouseClicked (double x, double y, Qt::KeyboardModifiers modifiers, Qt::MouseButton button) |
| | emitted when a single-click event from the mouse occurs inside the plot
|
| void | plotMouseDoubleClicked (double x, double y, Qt::KeyboardModifiers modifiers, Qt::MouseButton button) |
| | emitted when a double-click event from the mouse occurs inside the plot
|
| void | plotMouseMove (double x, double y) |
| | emitted whenever the mouse moves
|
| void | plotMouseWheelOperated (double x, double y, Qt::KeyboardModifiers modifiers, int deltaAngleX, int deltaAngleY) |
| | emitted when a single-click event from the mouse occurs inside the plot
|
| void | plotNewZoomRectangle (double mouseDragRectXStart, double mouseDragRectXEnd, double mouseDragRectYStart, double mouseDragRectYEnd, Qt::KeyboardModifiers modifiers) |
| | emitted when the mouse action jkqtpmdaZoomByRectangle and the drawing of the new zoom rectangle is finished (=mouse key released)
|
| void | plotScalingRecalculated () |
| | emitted when the plot scaling has been recalculated
|
| void | rulerDisplayed (double x1, double y1, double x2, double y2, Qt::KeyboardModifiers modifiers) |
| | emitted when a new ruler between two points is displayed
|
| void | tooltipDisplayed (double x, double y, const QStringList &entries, const QList< JKQTPPlotElement * > &graphs) |
| | emitted when a tooltip for a datapoint is displayed
|
| void | userCircleFinished (double x, double y, double radius, Qt::KeyboardModifiers modifiers) |
| | emitted when the mouse action JKQTPlotter::CircleEvents and the drawing of the new circle is finished (=mouse key released)
|
| void | userEllipseFinished (double x, double y, double radiusX, double radiusY, Qt::KeyboardModifiers modifiers) |
| | emitted when the mouse action JKQTPlotter::EllipseEvents and the drawing of the new ellipse is finished (=mouse key released)
|
| void | userLineFinished (double x1, double y1, double x2, double y2, Qt::KeyboardModifiers modifiers) |
| | emitted when the mouse action JKQTPlotter::LineEvents and the drawing of the new line is finished (=mouse key released)
|
| void | userRectangleFinished (double x, double y, double width, double height, Qt::KeyboardModifiers modifiers) |
| | emitted when the mouse action JKQTPlotter::RectangleEvents and the drawing of the new rectangle is finished (=mouse key released)
|
| void | userScribbleClick (double x, double y, Qt::KeyboardModifiers modifiers, bool first, bool last) |
| | emitted when the mouse action JKQTPlotter::ScribbleEvents and a click event from the mouse occurs inside the plot, or the mouse moved while the left button is pressed down
|
| void | widgetResized (int new_width, int new_height, JKQTPlotter *sender) |
| | signal: emitted whenever the widget is resized
|
| void | zoomChangedLocally (double newxmin, double newxmax, double newymin, double newymax, JKQTPlotter *sender) |
| | signal: emitted whenever the user selects a new x-y zoom range (in the major axes, e.g. by mouse, setX(), setY(), setXY(), zoomToFit()... )
|
|
| | JKQTPlotter (bool datastore_internal, QWidget *parent=nullptr, JKQTPDatastore *datast=nullptr) |
| | class constructor
|
| | JKQTPlotter (JKQTPDatastore *datast, QWidget *parent=nullptr) |
| | class constructor for a JKQTPlotter using an external JKQTPDatastore dataset
|
| | JKQTPlotter (QWidget *parent=nullptr) |
| | class constructor
|
| virtual | ~JKQTPlotter () |
| | class destructor
|
| size_t | addGraph (JKQTPPlotElement *gr) |
| size_t | addGraphAtBottom (JKQTPPlotElement *gr) |
| | add a new graph before all other graphs (i.e. at the top of the list of graphs), if the graph is already in the plot, it is moved to the top
|
| size_t | addGraphOnTop (JKQTPPlotElement *gr) |
| | add a new graph at the end of the graphs, if the graph is already in the plot, it is moved to the end of the list
|
| template<class TJKQTPGraphContainer> |
| void | addGraphs (const TJKQTPGraphContainer &gr, QVector< size_t > *graphIDsOut=nullptr) |
| | add a new graphs from a QVector<JKQTPPlotElement*>, QList<JKQTPPlotElement*>, std::vector<JKQTPPlotElement*> ... or any standard-iterateable container with JKQTPPlotElement*-items
|
| void | addGridPrintingPlotter (size_t x, size_t y, JKQTPlotter *plotterOther) |
| | add a new plotter plotterOther for grid printing mode, at location x / y
|
| JKQTBasePlotter::GraphsIterator | beginGraphs () |
| | returns an iterator to the first graph
|
| JKQTBasePlotter::GraphsConstIterator | beginGraphs () const |
| | returns an iterator to the first graph
|
| JKQTBasePlotter::GraphsConstIterator | cbeginGraphs () const |
| | returns an iterator to the first graph
|
| JKQTBasePlotter::GraphsConstIterator | cendGraphs () const |
| | returns an iterator behind the last graph
|
| void | clearAllMouseMoveActions () |
| | deletes all mouse-move actions
|
| void | clearAllMouseWheelActions () |
| | deletes all mouse-wheel actions
|
| void | clearAllRegisteredMouseDoubleClickActions () |
| | clear all registered mouse double-click actions
|
| void | clearAllRegisteredMouseDragActions () |
| | clear all registeres mouse drag actions
|
| void | clearGraphs (bool deleteGraphs=true) |
| | remove all plots
|
| void | clearGridPrintingPlotters () |
| | clear all additional plotters for grid printing mode
|
| bool | containsGraph (JKQTPPlotElement *gr) |
| | returns true, if the given graph is in this plot
|
| void | copyPixelImage (bool showPreview=true) |
| | copy the current plot as a pixel+svg image to the clipboard
|
| void | deleteGraph (JKQTPPlotElement *gr, bool deletegraph=true) |
| | remove the i-th graph
|
| void | deleteGraph (size_t i, bool deletegraph=true) |
| | remove the i-th graph
|
| void | deregisterMouseDoubleClickAction (Qt::MouseButton button, Qt::KeyboardModifiers modifier) |
| | deregisteres the mouse action action to be executed when a mouse double-click occurs with the given button and modifier
|
| void | deregisterMouseDragAction (Qt::MouseButton button, Qt::KeyboardModifiers modifier) |
| | deregisteres the mouse drag action to be executed when a mouse drag operation is initialized with the given button and modifier
|
| void | deregisterMouseMoveAction (Qt::KeyboardModifiers modifier) |
| | deletes all mouse-move actions registered for a given modifier
|
| void | deregisterMouseWheelAction (Qt::KeyboardModifiers modifier) |
| | deletes all mouse-wheel actions registered for a given modifier
|
| JKQTBasePlotter::GraphsIterator | endGraphs () |
| | returns an iterator behind the last graph
|
| JKQTBasePlotter::GraphsConstIterator | endGraphs () const |
| | returns an iterator behind the last graph
|
| void | forceInternalDatastore () |
| | tells the plotter object to use an internal datastore (just like useInternalDatastore() ), but forces the generation of a new datastore, even if the current one is already internal (the current one will be freed in the lather case
|
| double | getAbsoluteXMax () const |
| | returns the absolute x-axis max of the primary x-axis This is the highest allowed value the the axis min/max.
|
| double | getAbsoluteXMin () const |
| | returns the absolute x-axis min of the primary x-axis. This is the lowest allowed value the the axis min/max.
|
| double | getAbsoluteYMax () const |
| | returns the absolute y-axis max of the primary y-axis This is the highest allowed value the the axis min/max.
|
| double | getAbsoluteYMin () const |
| | returns the absolute y-axis min of the primary y-axis This is the lowest allowed value the the axis min/max.
|
| QAction * | getActMouseLeftAsDefault () |
| | action that activates the default action, set in plotterStyle!
|
| const QAction * | getActMouseLeftAsDefault () const |
| | action that activates the default action, set in plotterStyle!
|
| QAction * | getActMouseLeftAsPanView () |
| | action that activates the pan view tool (override!)
|
| const QAction * | getActMouseLeftAsPanView () const |
| | action that activates the pan view tool (override!)
|
| QAction * | getActMouseLeftAsRuler () |
| | action that activates the ruler tool (override!)
|
| const QAction * | getActMouseLeftAsRuler () const |
| | action that activates the ruler tool (override!)
|
| QAction * | getActMouseLeftAsZoomRect () |
| | action that activates the zoom rectangle tool (override!)
|
| const QAction * | getActMouseLeftAsZoomRect () const |
| | action that activates the zoom rectangle tool (override!)
|
| QAction * | getActMouseMoveToolTip () |
| | action that activates the tooltip tool (override!)
|
| const QAction * | getActMouseMoveToolTip () const |
| | action that activates the tooltip tool (override!)
|
| const JKQTBasePlotter * | getConstplotter () const |
| | returns the JKQTBasePlotter object internally used for plotting
|
| JKQTPContextMenuModes | getContextMenuMode () const |
| | returns the currently set mode for the context menu
|
| const JKQTPlotterStyle & | getCurrentPlotterStyle () const |
| | current style properties for this JKQTPlotter
|
| JKQTPDatastore * | getDatastore () |
| | returns a pointer to the datastore used by this object
|
| const JKQTPDatastore * | getDatastore () const |
| | returns a pointer to the datastore used by this object
|
| JKQTPPlotElement * | getGraph (size_t i) |
| | returns description of i'th graph
|
| const JKQTPPlotElement * | getGraph (size_t i) const |
| | returns description of i'th graph
|
| size_t | getGraphCount () |
| | returns the number of graphs
|
| JKQTBasePlotter::GraphsList & | getGraphs () |
| | returns a list of all graphs
|
| const JKQTBasePlotter::GraphsList & | getGraphs () const |
| | returns a list of all graphs
|
| double | getMagnification () const |
| | returns the current magnification factor
|
| JKQTPBaseKey * | getMainKey () |
| | retuns the main key object
|
| const JKQTPBaseKey * | getMainKey () const |
| | retuns the main key object
|
| int | getMaxTooltipDistance () const |
| | maximum distance at which a tooltip for a point is still displayed, when the user action jkqtpmdaToolTipForClosestDataPoint is executed
|
| double | getMouseContextX () const |
| | x-position of the mouse (in plot coordinates) when a user mouse-action was started (e.g. drawing a rectangle)
|
| double | getMouseContextY () const |
| | y-position of the mouse (in plot coordinates) when a user mouse-action was started (e.g. drawing a rectangle)
|
| int | getMouseLastClickX () const |
| | x-position of the last mouse-click (in screen pixels)
|
| int | getMouseLastClickY () const |
| | y-position of the last mouse-click (in screen pixels)
|
| int | getNextStyle () |
| | gets the next unused style id, i.e. the smalles number >=0 which is not contained in usedStyles
|
| JKQTBasePlotter::JKQTPPen | getPlotStyle (int i) const |
| | returns a QPen object for the i-th plot style
|
| JKQTBasePlotter * | getPlotter () |
| | returns the JKQTBasePlotter object internally used for plotting
|
| const JKQTBasePlotter * | getPlotter () const |
| | returns the JKQTBasePlotter object internally used for plotting
|
| QMenu * | getSpecialContextMenu () const |
| | returns the currently set special context menu object
|
| int | getToolbarIconSize () const |
| | get the width/height of the icons in the toolbar in pt
|
| int | getUserActionCatchSensitivity () const |
| | sensitivity (i.e. max. distance to see as one point) for user actions
|
| QBrush | getUserActionMarkerBrush () const |
| | brush for location markers of user actions on the plot
|
| int | getUserActionMarkerDiameter () const |
| | size (diameter) of markers drawn by user actions
|
| QPen | getUserActionMarkerPen () const |
| | pen for location markers of user actions on the plot
|
| JKQTPUserActionMarkerType | getUserActionMarkerType () const |
| | type of the location markers of user actions on the plot
|
| QBrush | getUserActionOpaqueBrush () const |
| | brush for user actions that cover parts of the plot (typically opaque, like e.g. tooltips)
|
| QPen | getUserActionOpaquePen () const |
| | pen for user actions that cover parts of the plot (typically opaque, like e.g. tooltips)
|
| QBrush | getUserActionOverlayBrush () const |
| | brush for user actions (typically semi-transparent, like e.g. zoom-rectangles)
|
| QPen | getUserActionOverlayPen () const |
| | pen for user actions that overlay the plot (typically semi-transparent, like e.g. zoom-rectangles)
|
| JKQTPHorizontalAxisBase * | getXAxis (JKQTPCoordinateAxisRef axis=JKQTPPrimaryAxis) |
| | returns the x-axis objet of the plot
|
| const JKQTPHorizontalAxisBase * | getXAxis (JKQTPCoordinateAxisRef axis=JKQTPPrimaryAxis) const |
| | returns the x-axis objet of the plot
|
| double | getXMax () const |
| | returns the current x-axis max of the primary x-axis
|
| double | getXMin () const |
| | returns the current x-axis min of the primary x-axis
|
| JKQTPVerticalAxisBase * | getYAxis (JKQTPCoordinateAxisRef axis=JKQTPPrimaryAxis) |
| | returns the y-axis objet of the plot
|
| const JKQTPVerticalAxisBase * | getYAxis (JKQTPCoordinateAxisRef axis=JKQTPPrimaryAxis) const |
| | returns the y-axis objet of the plot
|
| double | getYMax () const |
| | returns the current y-axis max of the primary y-axis
|
| double | getYMin () const |
| | returns the current y-axis min of the primary y-axis
|
| QImage | grabPixelImage (QSize size=QSize(), bool showPreview=false) |
| | returns a rendering of the current plot as a QImage (pixel image) with the given size
|
| bool | isEmittingSignalsEnabled () const |
| | returns whether this class emits signals, like zoomChangedLocally() or beforePlotScalingRecaluclate()
|
| bool | isMousePositionShown () const |
| | specifies whether to display the current position of the mouse in the top border of the plot (this may automatically extent the top border, so the position fits in. The default widget font is used for the output.
|
| bool | isPlotUpdateEnabled () const |
| | returns, whether automatic redrawing the plot is currently activated (e.g. you can deactivate this with setPlotUpdateEnabled() while performing major updates on the plot)
|
| bool | isResizeTimerRunning () const |
| | returns true, if the JKQTPlotter::resizeTimer is currently running and the widget is waiting for the resize-event to finish
|
| bool | isToolbarAlwaysOn () const |
| | returns whether the toolbar is always visible or only when the mouse moves to the upper left area
|
| bool | isToolbarEnabled () const |
| | returns whether the toolbar is enabled
|
| void | loadCurrentPlotterStyle (const QSettings &settings, const QString &group="plots/", bool alsoLoadBaseStyle=true) |
| | replace the current style properties for this JKQTBasePlotter with properties loaded from settings
|
| void | loadSettings (const QSettings &settings, const QString &group=QString("plots/")) |
| | loads the plot properties from a <a href="http://doc.qt.io/qt-5/qsettings.html")">QSettings object
|
| QSize | minimumSizeHint () const override |
| | returns the minimum size of the widget
|
| void | modifyGraphs (const std::function< void(JKQTPPlotElement *)> &func) |
| | apply functor func to all graphs in the plotter. After completing the operation, the graph is updated
|
| void | moveGraphBottom (int idx) |
| | move the given graph gr to the bottom of all graphs
|
| void | moveGraphBottom (JKQTPPlotElement *gr) |
| | move the given graph gr to the bottom of all graphs
|
| void | moveGraphDown (int idx) |
| | move the given graph gr one item down (i.e. it is drawn earlier/lower in the z-stack)
|
| void | moveGraphDown (JKQTPPlotElement *gr) |
| | move the given graph gr one item down (i.e. it is drawn earlier/lower in the z-stack)
|
| void | moveGraphTop (int idx) |
| | move the given graph gr to the end of all graphs, so it is drawn
|
| void | moveGraphTop (JKQTPPlotElement *gr) |
| | move the given graph gr to the end of all graphs, so it is drawn
|
| void | moveGraphUp (int idx) |
| | move the given graph gr one item up (i.e. it is drawn later/higher in the z-stack)
|
| void | moveGraphUp (JKQTPPlotElement *gr) |
| | move the given graph gr one item up (i.e. it is drawn later/higher in the z-stack)
|
| void | registerMouseDoubleClickAction (Qt::MouseButton button, Qt::KeyboardModifiers modifier, JKQTPMouseDoubleClickActions action) |
| | registeres a certain mouse action action to be executed when a mouse double-click occurs with the given button and modifier
|
| void | registerMouseDragAction (Qt::MouseButton button, Qt::KeyboardModifiers modifier, JKQTPMouseDragActions action) |
| | registeres a certain mouse drag action action to be executed when a mouse drag operation is initialized with the given button and modifier
|
| void | registerMouseMoveAction (Qt::KeyboardModifiers modifier, JKQTPMouseMoveActions action) |
| | specifies the action to perform on a mouse move event when a given modifier is pressed
|
| void | registerMouseWheelAction (Qt::KeyboardModifiers modifier, JKQTPMouseWheelActions action) |
| | specifies the action to perform on a mouse wheel event when a given modifier is pressed
|
| void | resetMasterSynchronization (JKQTBasePlotter::SynchronizationDirection synchronizeDirection=JKQTBasePlotter::sdXYAxes) |
| | switches any synchronization off, that has been created by synchronizeToMaster()
|
| void | saveCurrentPlotterStyle (QSettings &settings, const QString &group="plots/", bool alsoSaveBaseStyle=true) const |
| | store the current style properties for this JKQTBasePlotter with properties loaded from settings
|
| void | saveSettings (QSettings &settings, const QString &group=QString("plots/")) const |
| | saves the plot properties into a <a href="http://doc.qt.io/qt-5/qsettings.html")">QSettings object.
|
| void | setCurrentPlotterStyle (const JKQTPlotterStyle &style) |
| | replace the current style properties for this JKQTBasePlotter
|
| void | setCurrentPlotterStyle (const JKQTPlotterStyle &style, const JKQTBasePlotterStyle &baseStyle) |
| | replace the current style properties for this JKQTBasePlotter
|
| void | setEmittingSignalsEnabled (bool sig) |
| | specifies whether this class emits signals, like zoomChangedLocally() or beforePlotScalingRecaluclate()
|
| void | setGridPrinting (bool enabled) |
| | enables grid-printing for this plot
|
| void | setGridPrintingCurrentPos (size_t x, size_t y) |
| | set the x- and y-positions of this JKQTPlotter in the grid-printing grid
|
| void | setGridPrintingCurrentX (size_t x) |
| | set the x-position of this JKQTPlotter in the grid-printing grid
|
| void | setGridPrintingCurrentY (size_t y) |
| | set the y-position of this JKQTPlotter in the grid-printing grid
|
| void | setPlotUpdateEnabled (bool enable) |
| | sets whether automatic redrawing the plot is currently activated (e.g. you can sett his to false while performing major updates on the plot)
|
| void | setSpecialContextMenu (QMenu *menu) |
| | sets a QMenu object to be used as special context menu
|
| void | setToolbarIconSize (int value) |
| | set the width/height of the icons in the toolbar in pt
|
| QSize | sizeHint () const override |
| | returns the size of the widget
|
| void | sortGraphs (const std::function< bool(const JKQTPPlotElement *, const JKQTPPlotElement *)> &compareLess) |
| | sort the graphs, using functor compareLess to find whether a first graph shall be before (i.e. less) than a second graph. After completing the operation, the graph is updated
|
| void | synchronizeToMaster (JKQTPlotter *master, JKQTBasePlotter::SynchronizationDirection synchronizeDirection, bool synchronizeAxisLength=true, bool synchronizeZoomingMasterToSlave=true, bool synchronizeZoomingSlaveToMaster=true) |
| | synchronize the plot borders (and zooming) with a given plotter (master --> slave/this)
|
| void | synchronizeXToMaster (JKQTPlotter *master, bool synchronizeAxisLength=true, bool synchronizeZoomingMasterToSlave=true, bool synchronizeZoomingSlaveToMaster=true) |
| | synchronize the plot x-axis width (and x-zooming) with a given master plotter (master --> slave/this)
|
| void | synchronizeYToMaster (JKQTPlotter *master, bool synchronizeAxisLength=true, bool synchronizeZoomingMasterToSlave=true, bool synchronizeZoomingSlaveToMaster=true) |
| | synchronize the plot y-axis height (and y-zooming) with a given master plotter (master --> slave/this)
|
| void | updateToolbarActions () |
| void | useAsInternalDatastore (JKQTPDatastore *newStore) |
| | tells the plotter object to use the given external datastore and treat it as an internal one (i.e. free it when the plotter object ist destroyed.
|
| void | useExternalDatastore (JKQTPDatastore *newStore) |
| | tells the plotter object to use the given external datastore.
|
| void | useInternalDatastore () |
| | tells the plotter object to use an internal datastore. A new internal datastore object is generated only if the current datastore is not internal.
|
|
| void | correctZoomRectForPanning (QRectF &rect) const |
| | tool function, which corrects the given rectangle (in pixels!) during a panning action. The correction is necesary towards getAbsoluteXY() to prevent an unwanted zooming in.
|
| InternalBufferImageType | createImageBuffer () const |
| | constructs a new image for the internal double-buffering
|
| virtual bool | event (QEvent *event) override |
| void | fillInternalStructForToolTipOfClosestDataPoint (double x0, double y0, bool emitEvent=true) |
| | fills the inertnal mouseDragMarkers structure with data to display tooltips close to (x0, y0)
|
| JKQTPMouseDoubleClickActionsHashMapIterator | findMatchingMouseDoubleClickAction (Qt::MouseButton button, Qt::KeyboardModifiers modifiers, bool *found=nullptr) const |
| | searches JKQTPlotterStyle::registeredMouseDoubleClickActions for a matching action
|
| JKQTPMouseDragActionsHashMapIterator | findMatchingMouseDragAction (Qt::MouseButton button, Qt::KeyboardModifiers modifiers, bool *found=nullptr) const |
| | searches JKQTPlotterStyle::registeredMouseActionModes for a matching action, returns in found whether an action was found
|
| JKQTPMouseMoveActionsHashMapIterator | findMatchingMouseMoveAction (Qt::KeyboardModifiers modifiers, bool *found=nullptr) const |
| | searches JKQTPlotterStyle::registeredMouseMoveActions for a matching action
|
| JKQTPMouseWheelActionsHashMapIterator | findMatchingMouseWheelAction (Qt::KeyboardModifiers modifiers, bool *found=nullptr) const |
| | searches JKQTPlotterStyle::registeredMouseWheelActions for a matching action
|
| void | fixBasePlotterSettings () |
| | modifies the settings of plotter to match those of this object
|
| QSize | getImageBufferSize (float *scale_out=nullptr) const |
| | returns the required size of an image for the internal double-buffering
|
| int | getPlotYOffset () const |
| | calculate the y-axis shift of the plot, so there is space for the potentially displayed mouse position label
|
| void | initContextMenu () |
| | fills the member contextMenu with all default and additionally registered actions, also calls modifyContextMenu()
|
| void | keyReleaseEvent (QKeyEvent *event) override |
| | react on key presses.
|
| void | leaveEvent (QEvent *event) override |
| | called, when the mouse leaves the widget, hides the toolbar (if visible)
|
| void | modifyContextMenu (QMenu *menu) |
| | you may overwrite this method to modify the given context menu before it is displayed.
|
| void | mouseDoubleClickEvent (QMouseEvent *event) override |
| | event handler for a double click
|
| void | mouseMoveEvent (QMouseEvent *event) override |
| | event handler for a mouse move
|
| void | mousePressEvent (QMouseEvent *event) override |
| | event handler for a mouse down event
|
| void | mouseReleaseEvent (QMouseEvent *event) override |
| | event handler for a mouse release event
|
| void | paintEvent (QPaintEvent *event) override |
| | this simply paints the stored image to the widget's surface
|
| void | paintUserAction () |
| | paint the user action (rectangle, ellipse, ...
|
| void | resetContextMenu (bool createnew=true) |
| | destroys the internal contextMenu and optionally creates a new one
|
| void | resetCurrentMouseDragAction () |
| | resets the currently activated mouse drag action, e.g. called by mouseReleaseEvent()
|
| void | resetOverrideMouseDragAction (Qt::MouseButton button, Qt::KeyboardModifiers modifiers) |
| | removes a previously set override mouse drag action for the given button/modifiers combination
|
| void | resizeEvent (QResizeEvent *event) override |
| | resizes the internal representation (image) of the graphs
|
| void | setOverrideMouseDragAction (Qt::MouseButton button, Qt::KeyboardModifiers modifiers, JKQTPMouseDragActions action) |
| | sets an override mouse drag action for the given button/modifiers combination
|
| void | updateCursor () |
| | set the current mouse cursor shappe according to currentMouseDragAction
|
| void | updateToolbar () |
| | update settings of the toolbar
|
| void | wheelEvent (QWheelEvent *event) override |
| | event handler for a turn of the mouse wheel
|
plotter widget for scientific plots (uses JKQTBasePlotter to do the actual drawing)
This class is a QWidget-wrapper around JKQTBasePlotter. It uses the tools from JKQTBasePlotter to display scientific plots. This class mostly adds the Widget for the output and adds different types of user interactions.
Please have a look at the documentation of JKQTBasePlotter for details on the management of graphs and the formating/styling of the plot and graphs!
The rest of this documentation ins split into sections that each treat a special topic, as outlines below:
Basic Usage of JKQTPlotter
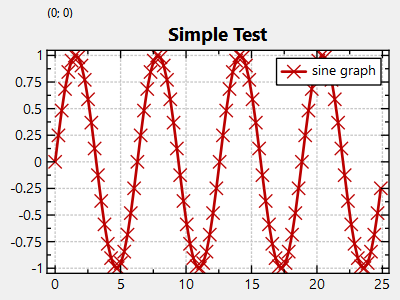
JKQTPlotter is a plotter widget which wraps around a JKQTBasePlotter instanced that does the actual drawing. A basic usage of JKQTPlotter looks like this:
QVector<double> X, Y;
fillDataVectors(X, Y);
graph1->
setTitle(QObject::tr(
"graph title"));
plot->
setXY(-10,10,-10,10);
size_t addCopiedColumn(QVector< double > &&data, const QString &name)
add a column with data from data, ownership of the memory behind data is transfered to the datastore
Definition jkqtpdatastorage.h:686
virtual void setTitle(const QString &__value)
sets the title of the plot (for display in key!).
void setYColumn(int __value)
the column that contains the y-component of the datapoints
void setXColumn(int __value)
the column that contains the x-component of the datapoints
This implements xy line plots. This also alows to draw symbols at the data points.
Definition jkqtplines.h:61
void zoomToFit(bool zoomX=true, bool zoomY=true, bool includeX0=false, bool includeY0=false, double scaleX=1.05, double scaleY=1.05)
this method zooms the graph so that all plotted datapoints are visible.
Definition jkqtplotter.h:1051
size_t addGraph(JKQTPPlotElement *gr)
Definition jkqtplotter.h:796
void setXY(double xminn, double xmaxx, double yminn, double ymaxx, bool affectsSecondaryAxes=false)
sets the x- and y-range of the plot (minimum and maximum values on the x-/y-axis)
Definition jkqtplotter.h:1179
JKQTPlotter(bool datastore_internal, QWidget *parent=nullptr, JKQTPDatastore *datast=nullptr)
class constructor
JKQTPDatastore * getDatastore()
returns a pointer to the datastore used by this object
Definition jkqtplotter.h:621
The result should look something like this:
Starting from this basic example, you can observe several important principles:
-
Data is stored in an (internal) instance of JKQTPDatastore, which is accessible through JKQTPlotter::getDatastore(). This datastore can either own its data (which is done here, as we copy the data into the store by calling JKQTPDatastore::addCopiedColumn(), or it can merely reference to the data (then data needs to be available as array of
double values).
-
Naming conventions (excerpt from Conventions: Naming and Plot Construction ):
-
plot is the complete drawn image, including the axes, the graphs, the key and all other visual elements
-
plot element any sub element of the plot, e.g. a single coordinate axis, the key, but also any graph/curve
-
graph is a single curve/image/geometric element in the plot
-
geometric element is a special graph that does not represent a curve based on data from the JKQTPDatastore, but a single graphic element, like a rectangle/circle/line/..., some text, a single symbol
-
key is the legend of the plot
-
coordinate axis is each of the x- or y-axis (there might be addition axes, e.g. when showing a color-scale)
-
Each graph is represented by a class derived from JKQTPPlotElement (in the example we instanciated a JKQTPXYLineGraph, which shows data as a scatter of symbols that may (or may not) be connected by a line). Creating the graph class does not yet add it to the plotter. To add it, call JKQTPlotter::addGraph(). Only after this sep, the graph is displayed. You can modify the apperance of the graph (e.g. colors, name in the key ...) by setting properties in the graph class instance.
-
You can auto-zoom the axis ranges of the plot by calling JKQTPlotter::zoomToFit(), or set them exlicitly by calling JKQTPlotter::setXY(). The user can later zoom in/out by the mouse (and other means). You can limit this zoom range by setting an absolute axis range, calling e.g. JKQTPlotter::setAbsoluteXY(). The the user cannot zoom farther out than the given range(s).
-
If you want to style the plot itself, you need to set properties of the underlying JKQTBasePloter instance, which is accessible through JKQTPlotter::getPlotter(). If you want to style the coordinate axes, you can acces their representing objects by caling JKQTPlotter::getXAxis() or JKQTPlotter::getYAxis().
- See also
- Example (JKQTPlotter): Very simple line-graph and
-
Tutorial (JKQTPlotter): Using a JKQTPlotter inside a Qt User Interface Designer (UI) File
Performance Considerations when Setting up Plots
Many of the function in JKQTPlotter case an immediate redraw of the widget. Examples are JKQTPlott::setX(), JKQTPlotter::setY(), JKQTPlotter::setAbsoluteX(), JKQTPlotter::setAbsoluteY(), JKQTPlotter::addGraph() ... so if you use a combination of these while setting up your plot, it is possible to cause several (rather expensive) redraws of the plot widget. Therefore you can disable this redrawing, using JKQTPlotter::setPlotUpdateEnabled() and you can explicitly cause a redraw with JKQTPlotter::redrawPlot(). To make this process even easier to use, there is a guard helper class for this: JKQTPlotterUpdateGuard.
Here is a code example:
{
}
JKQTBasePlotter * plotter
JKQTBasePlotter used to plot.
Definition jkqtplotter.h:1420
Guard Class (RAII construct) for JKQTPlotter that disables replotting on construction and reenables i...
Definition jkqtplotter.h:1751
This code has the same effect as the long version without the guard class shown below:
const bool wasReplotEnabled=
plotter->isPlotUpdateEnabled();
plotter->setPlotUpdateEnabled(
false);
plotter->setPlotUpdateEnabled(false);
if (wasReplotEnabled)
plotter->redrawPlot();
- See also
- JKQTPlotter::setPlotUpdateEnabled(), JKQTPlotter::redrawPlot(), JKQTPlotterUpdateGuard
Synchronizing Several Plots
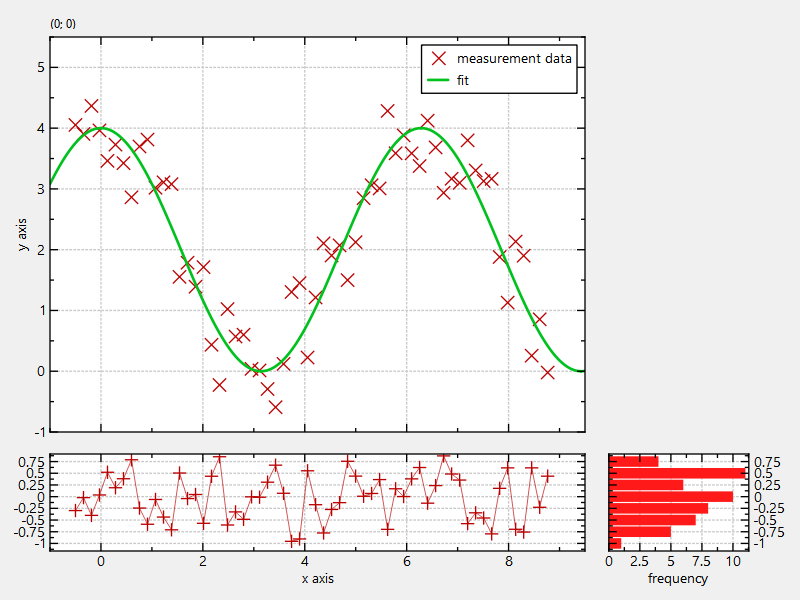
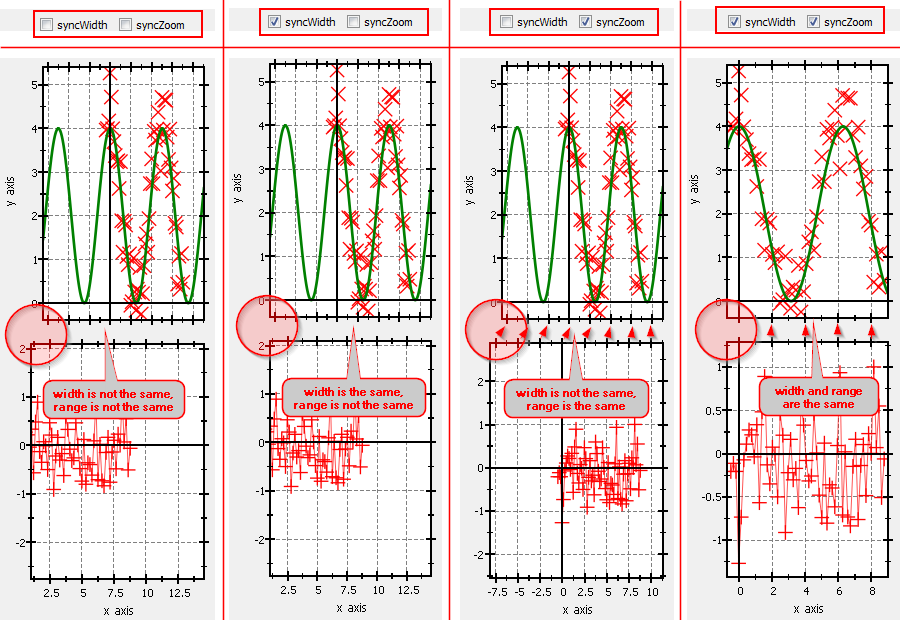
Often a single plot is not sufficient, but several plots need to be aligned with respect to each other:
In the Qt Window this is achieved by placing several JKQTPlotter objects into a QGridLayout. In order to support this alignment, also when exporting/printing a plot, and when the user interactions with the plot (e.g. zooming), JKQTPlotter offers an API which allows to :
- Note
- This API adopts and extends the possibilities of JKQTBasePlotter. Please see the documentation there for details:
User-Interactions/GUI Features
JKQTPlotter offers a lot of user-interaction features out of the box. These are detailed below.
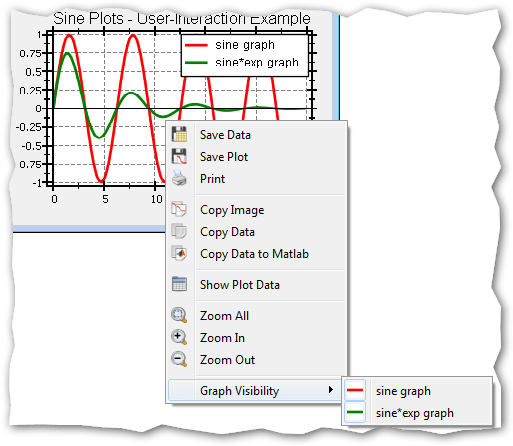
Context Menu of JKQTPlotter
The class JKQTPlotter has a context menu that already offers a lot of functionality.
It allows to:
-
copy or save the data from the internal JKQTPDatastore
-
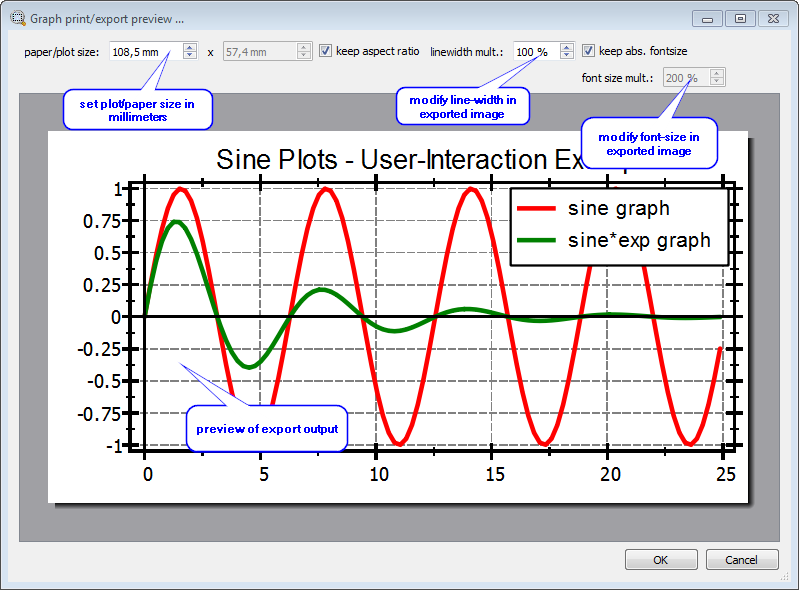
copy or save the plot to an image file (PNG, PDF, ...), includes a softisticated export-preview dialog:
-
print the plot (includes a softisticated print-preview dialog):
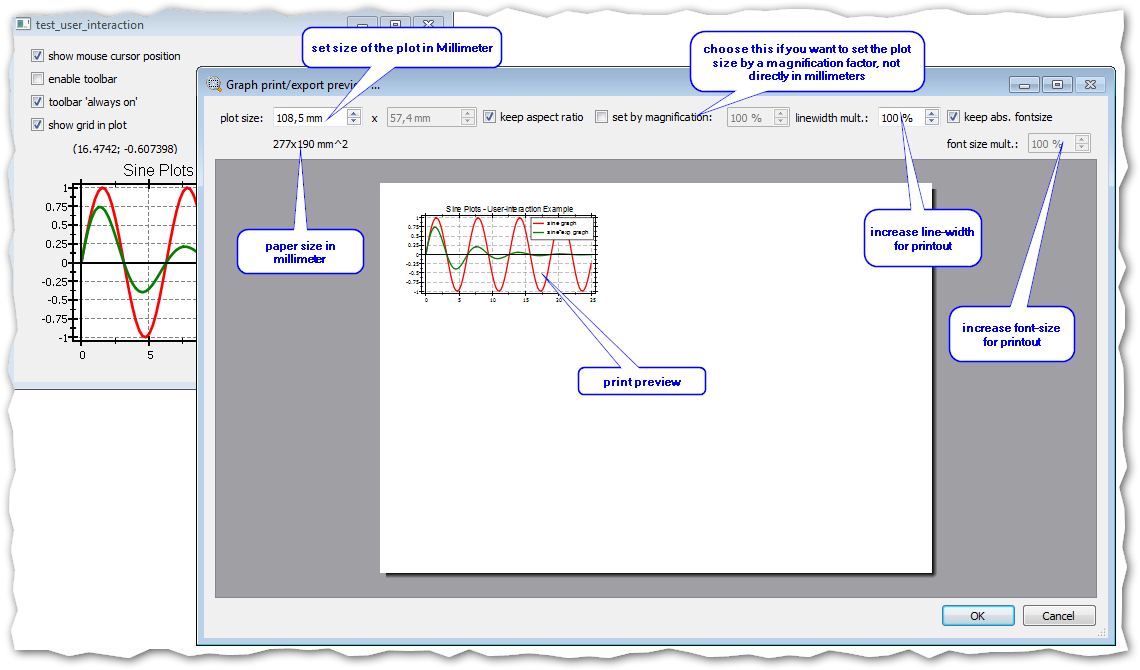
Print Preview Dialog
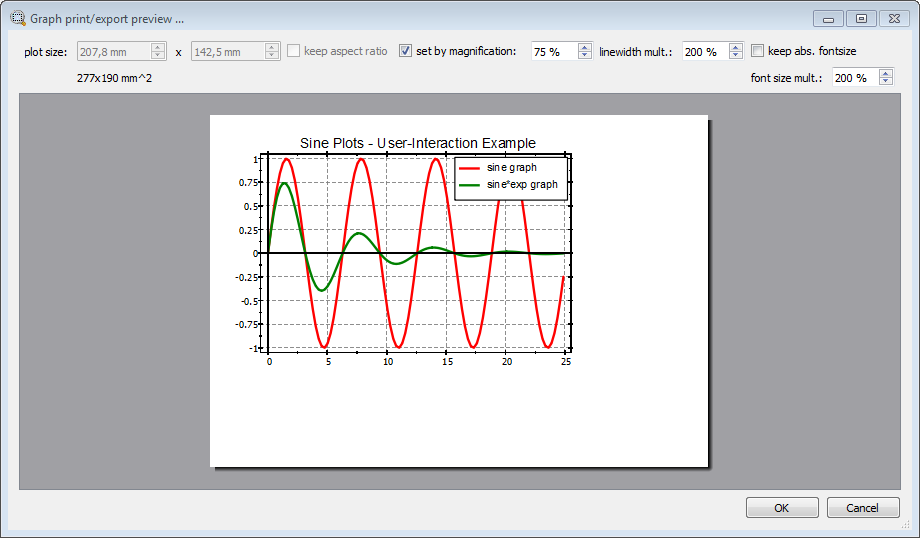
Print Preview Dialog with modified (relative) size, line-width and font-size
-
open a dialog with a table of the plot data:
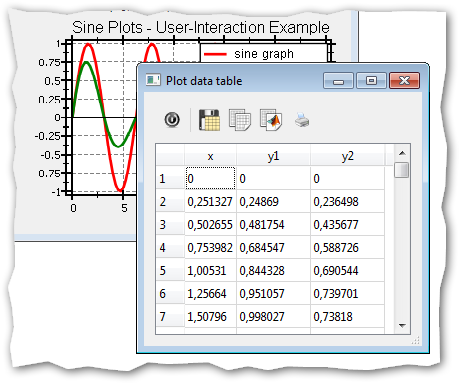
Data Table Dialog (with buttons to save or copy the data)
-
zoom into/out of the plot and determine an auto-zoom, which shows all of the plot data
-
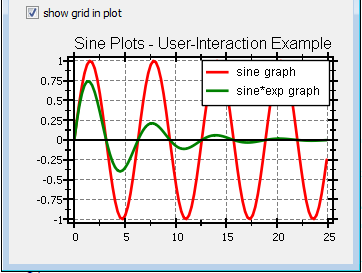
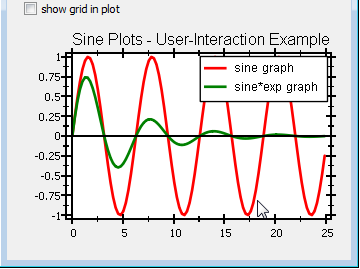
switch the visibility of the different graphs in the plot
You can activate this menu, by setting setContextMenuMode(jkqtpcmmStandardContextMenu); and binding a mouse-action (typically the right-click) to the context menu by calling deregisterMouseDragAction(Qt::RightButton,Qt::NoModifier) which deregisters any user actions from the rhs single mouse click. In that case, the context menu is opened by default (see setContextMenuMode() to choose the mode of the context menu).
In addition JKQTPlotter provides several ways to customize this menu:
- You can add additional actions to the JKQTPlotter, by calling JKQTPlotter::addAction() (i.e. using the default Qt mechanism) and/or by adding actions to the internal JKQTBasePlotter, using JKQTBasePlotter::registerAdditionalAction()
- You can modify the menu, when it is displayed, by connecting a slot to the signal JKQTPlotter::contextMenuOPened(x,y,menu):
void TestUserInteraction::contextMenuOpened(
double x,
double y, QMenu *
contextMenu)
{
QAction* act=
contextMenu->addMenu(QString(
"contextMenuOpened(x=%1, y=%2)").arg(x).arg(y))->addAction(
"user-added action");
connect(act, &QAction::triggered, [x,y]() { QMessageBox::warning(nullptr, tr("Plot Context Menu"),
tr("Context Menu was opened at x/y=%1/%2!").arg(x).arg(y),
QMessageBox::Ok,
QMessageBox::Ok); });
labMouseAction->setText(QString("contextMenuOpened(x=%1, y=%2)").arg(x).arg(y));
}
QMenu * contextMenu
the context menu object used by this JKQTPlotter
Definition jkqtplotter.h:1607
void contextMenuOpened(double x, double y, QMenu *contextMenu)
emitted whenever a context menu is opened. You can modify the menu via the parameter contextMenu!
Special (User-Defined) Context Menu of JKQTPlotter
In addition to the standard context menu, JKQTPlotter can also be configures to display a special, user-defined context menu. To do so, call `setContextMenuMode(jkqtpcmmSpecialContextMenu) and set your menu, by calling setSpecialContextMenu() You can also combine the special menu and the standard menu, by calling setContextMenuMode(jkqtpcmmStandardAndSpecialContextMenu) .
You can also use the signal contextMenuOpened() to modify the special context menu, but note that alterations to this menu are permanently stored in the special menu object. See contextMenuOpened() for a detailed discussion and ways to circumvent this!
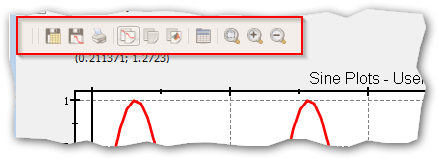
Toolbar of JKQTPlotter
In addition to the context-menu, a JKQtPlotter also also provides a toolbar at its top that offers most of the functionality of the context menu. Usually this toolbar is enabled (see toolbarEnabled) and is in a mode where it is hidden, until the mouse moves over an area at the top of the plot (see toolbarAlwaysOn):
Hidden Toolbar
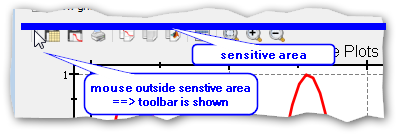
Shown Toolbar
If toolbarAlwaysOn is set to true (setToolbarAlwaysOn() ), the toolbar is always displayed:
- See also
- toolbarEnabled, toolbarAlwaysOn, Tutorial (JKQTPlotter): User-Interactions in JKQtPlotter
QActions from a JKQTPlotter
Often you want to allow the suer to operate a plot from a user-defined QToolBar or a QMenu/QMenuBar in your application (e.g. provide zooming commands ...). there are generally two ways to achieve this:
-
Simply connect home-brewn QAction instances to the slots provided by JKQTPlotter and JKQTBasePlotter. This also allows you to connect different plot properties to edit widgets in your forms.
chkPositionDisplay=new QCheckBox(tr("show mouse cursor position"), this);
chkPositionDisplay->setChecked(plot->isMousePositionShown());
void setMousePositionShown(bool __value)
specifies whether to display the current position of the mouse in the top border of the plot (this ma...
-
For several functions (especially those also present in JKQTPlotter's context-emun, you can also find readily available QAction instances. these are available from JKQTBasePlotter (e.g. by JKQTBasePlotter::getActionPrint() ...). From JKQTPlotter you therefor have to use:
getPlotter()->getActionPrint()
QMenu* menuPlot=menuBar()->addMenu("Plot-Menu");
menuPlot->addAction(plot->getPlotter()->getActionPrint());
QMenu* menuPlotS=menuPlot->addMenu("Save ...");
menuPlotS->addAction(plot->getPlotter()->getActionSaveData());
menuPlotS->addAction(plot->getPlotter()->getActionSavePDF());
menuPlotS->addAction(plot->getPlotter()->getActionSavePlot());
- See also
- Tutorial (JKQTPlotter): User-Interactions in JKQtPlotter
Mouse-Interaction in JKQTPlotter
This section summarizes all user-interaction functions in JKQTPlotter that somehow relate to the mouse. These are:
- Note
- Zooming and Paning interactions apply to both axes when they are performed with the mouse inside the plot. They are limited to one of the two axes, when the mouse hovers over that axis (e.g. when you zoom by mouse-wheel while the mouse pointer is below the plot, over the x-axis, only the x-axis is affected by the operation).
Actions When Dragging the Mouse
JKQTPlotter offers several methods that allow to customize, how it reacts to mouse actions:
- registerMouseDragAction() tells JKQTPlotter to perform a certain action (selected from JKQTPlotter::MouseActionMode) when a specified mouse button is pushed while a specified (or no) keyborad modifiers (e.g. CTRL,ALT,SHIFT...) is pressed. By default JKQTPlotter calls these two registers in its constructors:
void registerMouseDragAction(Qt::MouseButton button, Qt::KeyboardModifiers modifier, JKQTPMouseDragActions action)
registeres a certain mouse drag action action to be executed when a mouse drag operation is initializ...
Therefore by default you can draw a zoom rectangle with the left mouse button without modifiers and you can pan/drag the plot with the left mouse-button while keeping CTRL pressed.
- deregisterMouseDragAction() deletes a previously defined user-interaction
- clearAllRegisteredMouseDragActions() deletes all previously specified user-actions
Pressing the ESC key will stop the current JKQTPlotter::MouseActionMode.
If e.g. the mode JKQTPlotter::MouseActionMode::jkqtpmdaZoomByRectangle is selected, while you drag the mouse, the zoom rectangle is drawn over the plot. You can modify the style of drawing using these functions:
Zooming with the mouse
Draw Rectangle User-Action
Drag the Plot Viewport
Measurement Ruler Tool
Data Point Tooltip Tool
Actions After (Double-)Clicks on the Mouse Buttons
The right mouse button has a special role: If it is single-clicked and no JKQTPlotter::MouseActionMode is specified for the vent, it opens the context menu, unless you call setContextMenuMode(jkqtpcmmNoContextMenu) . You can also use setContextMenuMode() to specify which type of context menu is shown. See JKQTPContextMenuModes for details on the available modes.
For any mouse-click, one of the following signals is emitted:
The reaction to double-clicks of the mouse buttons can be specified separately. The possible actions are listed in JKQTPMouseDoubleClickActions. You can bind one of these actions to a specific click with these functions:
- registerMouseDoubleClickAction() tells JKQTPlotter to perform a certain action (selected from JKQTPMouseDoubleClickActions) when a specified mouse button is pushed while a specified (or no) keyborad modifiers (e.g. CTRL,ALT,SHIFT...) is pressed. By default JKQTPlotter calls this in its constructors:
void registerMouseDoubleClickAction(Qt::MouseButton button, Qt::KeyboardModifiers modifier, JKQTPMouseDoubleClickActions action)
registeres a certain mouse action action to be executed when a mouse double-click occurs with the giv...
@ jkqtpdcaClickMovesViewport
a double-click centers the x/y-range around the clicked position
Definition jkqtptools.h:145
Therefore by default you can pan the plot/move the viewport by double clicking a location
- deregisterMouseDoubleClickAction() deletes a previously defined user-interaction
- clearAllRegisteredMouseDoubleClickAction() deletes all previously specified user-actions
The button to react to is specified as a parameter.
Actions When a Mouse Wheel Event Occurs
The actions to be performed when the mouse wheel is operated are specified in JKQTPMouseWheelActions. You can bind one of these actions to the mouse-wheel (under the condition that a specified Qt::KeyboardModifiers is pressed) by using these functions:
- registerMouseWheelAction() tells JKQTPlotter to perform a certain action (selected from JKQTPMouseWheelActions) when a specified mouse button is pushed while a specified (or no) keyborad modifiers (e.g. CTRL,ALT,SHIFT...) is pressed. By default JKQTPlotter calls this in its constructors:
void registerMouseWheelAction(Qt::KeyboardModifiers modifier, JKQTPMouseWheelActions action)
specifies the action to perform on a mouse wheel event when a given modifier is pressed
@ jkqtpmwaZoomByWheel
use the mouse-wheel for zooming
Definition jkqtptools.h:165
Therefore by default you can zoom into and out of the plot, using the mouse wheel.
- deregisterMouseWheelAction() deletes a previously defined user-interaction
- clearAllMouseWheelActions() deletes all previously specified user-actions
In addition the signal void plotMouseWheelOperated() is emitted whenever a mouse-wheel event occurs.
Mouse Move Signaling and Actions
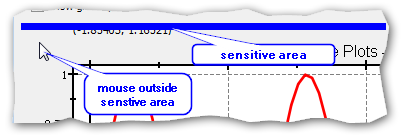
In addition the signal plotMouseMove() is called whenever the mouse moves over the plot. Additional signals may be emitted, depending on the currently active JKQTPlotter::MouseActionMode.
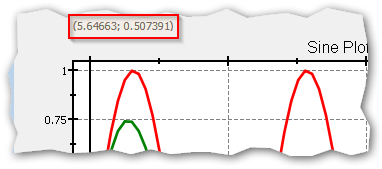
Also the current mouse position is shown above the graph by default (can be switched on or off using setMousePositionShown() ).
The actions to be performed when the mouse moves without a mouse-button pressed are specified in JKQTPMouseMoveActions. You can bind one of these actions to the mouse (under the condition that a specified Qt::KeyboardModifiers is pressed) by using these functions:
Fast Resizing of a Plot Widget
When the user resized the widget, the graph would in principle have to be readrawn for every intermediate step. As this is very timeconsuming, JKQTPlotter uses a different approach: Actual Redrawing is delayed a few 100ms and this delay is reset whenever the widget size changes. Only after the last delay expires, the plot is redrawn. In between an image of the last state of the plot is simple stretched/compressed to fill the new/current widget size. In sum this looks like this:
How to use JKQTPlotter in the Qt Form Designer
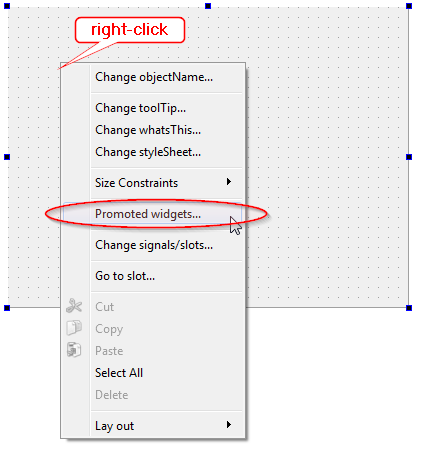
As JKQTPlotter is a standard Qt widget, you can also use it in Qt UI-files designed with the Qt From Designer (e.g. from within QTCreator). For this to work you have to use the Promote QWidget"-feature of the form designer. The steps you need to take are detailed below:
-
add a new UI-file to your project and open it in the Form Editor. Then right-click the form and select Promote Widgets ...:
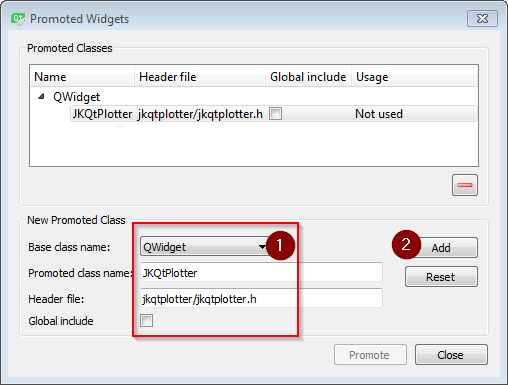
-
In the dialog that opens, you have to define JKQTPlotter as a promotion to QWidget as shown below. Finally store the settings by clicking Add and closing the dialog with Close.
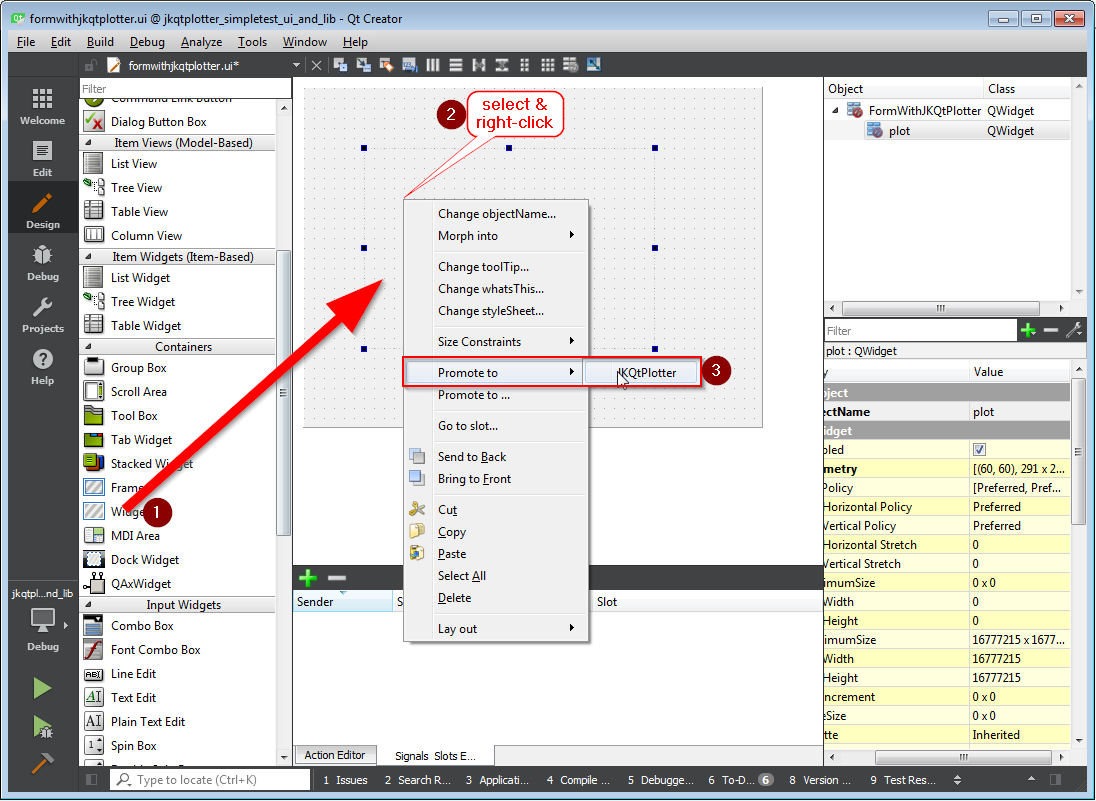
-
Now you can add a QWidgetfrom the side-bar to the form and then promote it to JKQTPlotter, by selecting and right-clicking the QWidget and then selecting Promote To | JKQTPlotter:
- See also
- Tutorial (JKQTPlotter): Using a JKQTPlotter inside a Qt User Interface Designer (UI) File
Also see Tutorial (JKQTPlotter): Styling a JKQtPlotter for another example of using the Qt UI Designer with JKQTPlotter