|
JKQTPlotter trunk/v5.0.0
an extensive Qt5+Qt6 Plotter framework (including a feature-richt plotter widget, a speed-optimized, but limited variant and a LaTeX equation renderer!), written fully in C/C++ and without external dependencies
|
|
JKQTPlotter trunk/v5.0.0
an extensive Qt5+Qt6 Plotter framework (including a feature-richt plotter widget, a speed-optimized, but limited variant and a LaTeX equation renderer!), written fully in C/C++ and without external dependencies
|
base class for 2D plotter classes (used by the plotter widget JKQTPlotter) More...
#include <jkqtpbaseplotter.h>
Classes | |
| struct | allPlotElements |
| Functor which does not apply any filter to JKQTPPlotElement, e.g. in getGraphsXMinMax() or getGraphsYMinMax() More... | |
| struct | filterPlotElementByXAxis |
| filter functor which accepts only those JKQTPPlotElement where JKQTPPlotElement::getXAxisRef() returns the JKQTPCoordinateAxisRef supplied to the constructor, e.g. in getGraphsXMinMax() or getGraphsYMinMax() More... | |
| struct | filterPlotElementByYAxis |
| filter functor which accepts only those JKQTPPlotElement where JKQTPPlotElement::getYAxisRef() returns the JKQTPCoordinateAxisRef supplied to the constructor, e.g. in getGraphsXMinMax() or getGraphsYMinMax() More... | |
| class | JKQTPPen |
| represents a pen, when plotting in JKQTPlotter/JKQTBasePlotter More... | |
| struct | PlotMargin |
| used for calculated value: describing a section in the freespace outside the graph area More... | |
| class | PlotMargins |
| used for calculated value: describing all sections of freespace outside the graph area More... | |
| struct | textSizeKey |
| internal tool class for text-sizess in a plot key More... | |
Public Types | |
| typedef QMap< QString, QList< QPointer< QAction > > > | AdditionalActionsMap |
| typedef QMapIterator< QString, QList< QPointer< QAction > > > | AdditionalActionsMapIterator |
Public Slots | |
| void | enableDebugShowRegionBoxes (bool enabled=true) |
if set true (default: false ) the JKQTBasePlotter draws colored rectangles to indicate the different regions in the plot (border, axes, ...) | |
| void | enableDebugShowTextBoxes (bool enabled=true) |
if set true (default: false ) the JKQTBasePlotter draws colored rectangles to indicate the extent of text in the plot | |
| QString | getUserSettigsFilename () const |
| return the filename, used by loadUserSettings() and saveUserSettings() | |
| QString | getUserSettigsPrefix () const |
| return the prefix, used by loadUserSettings() and saveUserSettings() | |
| void | loadUserSettings () |
| loads the plot user properties from the file sepcified by setUserSettigsFilename() and the prefix specified by setUserSettigsPrefix() | |
| void | saveUserSettings () const |
| saves the plot user properties to the file sepcified by setUserSettigsFilename() and the prefix specified by setUserSettigsPrefix() | |
| void | setAbsoluteX (double xminn, double xmaxx) |
| sets absolutely limiting x-range of the plot | |
| void | setAbsoluteXY (double xminn, double xmaxx, double yminn, double ymaxx) |
| sets absolutely limiting x- and y-range of the plot | |
| void | setAbsoluteY (double yminn, double ymaxx) |
| sets absolute minimum and maximum y-value to plot | |
| void | setAspectRatio (double __value) |
| sets the data aspect ratio, enforced with setMaintainApsectRatio(true) | |
| void | setAxisAspectRatio (double __value) |
| sets the axis aspect ratio, enforced with setMaintainAxisApsectRatio(true) | |
| void | setBackgroundBrush (const QBrush &__value) |
| color of the background of the plot (widget area) when drawing (to the screen) | |
| void | setBackgroundColor (const QColor &__value) |
| color of the background of the plot (widget area) when drawing (to the screen) | |
| void | setBackgroundGradient (const QGradient &__value) |
| color of the background of the plot (widget area) when drawing (to the screen) | |
| void | setBackgroundTexture (const QImage &__value) |
| color of the background of the plot (widget area) when drawing (to the screen) | |
| void | setBackgroundTexture (const QPixmap &__value) |
| color of the background of the plot (widget area) when drawing (to the screen) | |
| void | setCSVcommentInitializer (const QString &__value) |
| set the string used to introduce comments in text output when exporting data | |
| void | setCSVdecimalSeparator (const QString &__value) |
| set the decimal separator used when exporting data to text files | |
| void | setCurrentFileFormat (const QString &__value) |
| set the file format to use in SaveAs ... dialogs | |
| void | setCurrentSaveDirectory (const QString &__value) |
| sets the current directory in which to open SaveAs ... dialogs | |
| void | setDefaultTextColor (QColor __value) |
| default text color in the plot | |
| void | setDefaultTextFontName (const QString &__value) |
| default font name in the plot | |
| void | setDefaultTextSize (double __value) |
| default font size in the plot [pt] | |
| void | setExportBackgroundBrush (const QBrush &__value) |
| color of the background of the plot (widget area) when exporting | |
| void | setExportBackgroundColor (const QColor &__value) |
| color of the background of the plot (widget area) when exporting | |
| void | setExportBackgroundGradient (const QGradient &__value) |
| color of the background of the plot (widget area) when exporting | |
| void | setExportBackgroundTexture (const QImage &__value) |
| color of the background of the plot (widget area) when exporting | |
| void | setExportBackgroundTexture (const QPixmap &__value) |
| color of the background of the plot (widget area) when exporting | |
| void | setGrid (bool val) |
| sets whether the major grid lines of the major axes are shown | |
| void | setGridColor (QColor color) |
| sets the color of all major grid lines (of the major x- and y-axis) | |
| void | setGridStyle (Qt::PenStyle __value) |
| sets the style of all Major grid lines | |
| void | setGridWidth (double __value) |
| sets the width of all Major grid lines | |
| void | setKeyPosition (const JKQTPKeyPosition &__value) |
| key position inside or besides the plot area, see JKQTPKeyPositions for details and examples | |
| void | setMaintainAspectRatio (bool value) |
| en-/disables the maintaining of the data aspect ratio | |
| void | setMaintainAxisAspectRatio (bool value) |
| en-/disables the maintaining of the axis aspect ratio | |
| void | setMinorGridColor (QColor color) |
| sets the color of all minor grid lines (of the major x- and y-axis) | |
| void | setMinorGridStyle (Qt::PenStyle __value) |
| sets the style of all minor grid lines | |
| void | setMinorGridWidth (double __value) |
| sets the width of all minor grid lines | |
| void | setOnlyGraphVisible (int i) |
| set all graphs invisible, except i | |
| void | setOnlyNthGraphsVisible (int start, int n) |
| set all graphs invisible, except graph start, start+n, start+2*n, ... | |
| void | setPlotBackgroundBrush (const QBrush &__value) |
| color of the plot's background (i.e. of the area within the coordinate axes rectangle) | |
| void | setPlotBackgroundColor (const QColor &__value) |
| color of the plot's background (i.e. of the area within the coordinate axes rectangle) | |
| void | setPlotBackgroundGradient (const QGradient &__value) |
| color of the plot's background (i.e. of the area within the coordinate axes rectangle) | |
| void | setPlotBackgroundTexture (const QImage &__value) |
| color of the plot's background (i.e. of the area within the coordinate axes rectangle) | |
| void | setPlotBackgroundTexture (const QPixmap &__value) |
| color of the plot's background (i.e. of the area within the coordinate axes rectangle) | |
| void | setPlotBorder (int left, int right, int top, int bottom) |
| sets the borders of the plot | |
| void | setPlotBorderBottom (int bottom) |
| sets the bottom border of the plot | |
| void | setPlotBorderLeft (int left) |
| sets the left border of the plot | |
| void | setPlotBorderRight (int right) |
| sets the right border of the plot | |
| void | setPlotBorderTop (int top) |
| sets the top border of the plot | |
| void | setPlotFrameColor (QColor col) |
if plotFrameVisible==true, JKQTBasePlotter will draw a rectangle/frame around the plot in this color | |
| void | setPlotFrameRounding (double __value) |
if plotFrameVisible==true, JKQTBasePlotter will draw a rectangle/frame around the plot, rounding the corners with this redius (<=0 -> no rounded rectangle) [pt] | |
| void | setPlotFrameVisible (bool enabled) |
if true, JKQTBasePlotter will draw a rectangle/frame around the plot | |
| void | setPlotFrameWidth (double __value) |
if plotFrameVisible==true, JKQTBasePlotter will draw a rectangle/frame around the plot in this width [pt] | |
| void | setPlotLabel (const QString &__value) |
| set the plot label text | |
| void | setPlotLabelColor (QColor __value) |
| the plot label color | |
| void | setplotLabelFontName (const QString &__value) |
| the plot label font name | |
| void | setPlotLabelFontSize (double __value) |
| the plot label font size [pt] | |
| void | setPlotLabelOffset (double __value) |
| offset of the plot label from the next element of the graph, i.e. below the label [pt]. | |
| void | setPlotLabelTopBorder (double __value) |
| offset of the plot label from the top [pt]. | |
| void | setShowKey (bool __value) |
| indicates whether to plot a key | |
| void | setShowZeroAxes (bool showX, bool showY) |
| switches the visibility of the zero-axes associated with the major x- and y-axis | |
| void | setShowZeroAxes (bool showXY) |
| switches the visibility of the zero-axes associated with the major x- and y-axis | |
| void | setUseAntiAliasingForGraphs (bool __value) |
| specifies whether to use antialiasing for plotting the graphs | |
| void | setUseAntiAliasingForSystem (bool __value) |
| specifies whether to use antialiasing for plotting the coordinate system | |
| void | setUseAntiAliasingForText (bool __value) |
| specifies whether to use antialiasing when drawing any text | |
| void | setUserSettigsFilename (const QString &filename) |
| set filename, used by loadUserSettings() and saveUserSettings() | |
| void | setUserSettigsFilename (const QString &filename, const QString &prefix) |
| set filename and prefix, used by loadUserSettings() and saveUserSettings() | |
| void | setUserSettigsPrefix (const QString &prefix) |
| set prefix, used by loadUserSettings() and saveUserSettings() | |
| void | setWidgetHeight (int heigh) |
| sets the width of the plot widget | |
| void | setWidgetSize (int width, int height) |
| resize the plot | |
| void | setWidgetSize (QSize size) |
| resize the plot | |
| void | setWidgetWidth (int wid) |
| sets the width of the plot widget | |
| void | setX (double xminn, double xmaxx, bool affectsSecondaryAxes=false) |
| sets the x-range of the plot (minimum and maximum x-value on the x-axis) | |
| void | setXY (double xminn, double xmaxx, double yminn, double ymaxx, bool affectsSecondaryAxes=false) |
| sets the x- and y-range of the plot (minimum and maximum values on the x-/y-axis) | |
| void | setY (double yminn, double ymaxx, bool affectsSecondaryAxes=false) |
| sets the y-range of the plot (minimum and maximum y-value on the y-axis) | |
| void | zoom (double xminn, double xmaxx, double yminn, double ymaxx, bool affectsSecondaryAxes=false) |
| sets the x- and y-range of the plot (minimum and maximum values on the x-/y-axis) | |
| void | zoomIn (double factor=2.0) |
| zooms into the graph (the same as turning the mouse wheel) by the given factor | |
| void | zoomOut (double factor=2.0) |
| zooms out of the graph (the same as turning the mouse wheel) by the given factor | |
| void | zoomToFit (bool zoomX=true, bool zoomY=true, bool includeX0=false, bool includeY0=false, double scaleX=1.05, double scaleY=1.05) |
| this method zooms the graph so that all plotted datapoints are visible. | |
Signals | |
| void | beforePlotScalingRecalculate () |
| emitted before the plot scaling has been recalculated | |
| void | plotScalingRecalculated () |
| emitted when the plot scaling had to be recalculated | |
| void | plotUpdated () |
| emitted when the plot has to be updated | |
| void | zoomChangedLocally (double newxmin, double newxmax, double newymin, double newymax, JKQTBasePlotter *sender) |
| signal: emitted whenever the user selects a new x-y zoom range (in the major axes, e.g. setX(), setY(), setXY(), zoomToFit()... ) | |
Public Member Functions | |
Konstruktion and Destruction | |
| JKQTBasePlotter (bool datastore_internal, QObject *parent=nullptr, JKQTPDatastore *datast=nullptr) | |
| class constructor | |
| JKQTBasePlotter ()=delete | |
| virtual | ~JKQTBasePlotter () |
| class destructor | |
Plot Data Storage/Management (JKQTPDatastore) | |
| JKQTPDatastore * | getDatastore () |
| returns a pointer to the datastore used by this object | |
| const JKQTPDatastore * | getDatastore () const |
| returns a pointer to the datastore used by this object | |
| void | useExternalDatastore (JKQTPDatastore *newStore) |
| tells the plotter object to use the given external datastore. | |
| void | useAsInternalDatastore (JKQTPDatastore *newStore) |
| tells the plotter object to use the given external datastore and treat it as an internal one (i.e. free it when the plotter object ist destroyed. | |
| void | useInternalDatastore () |
| tells the plotter object to use an internal datastore. A new internal datastore object is generated only if the current datastore is not internal. | |
| void | forceInternalDatastore () |
| tells the plotter object to use an internal datastore (just like useInternalDatastore() ), but forces the generation of a new datastore, even if the current one is already internal (the current one will be freed in the lather case | |
Plot Styling & Settings Management | |
| void | loadSettings (const QSettings &settings, const QString &group=QString("plots/")) |
| loads all the plot properties from a <a href="http://doc.qt.io/qt-5/qsettings.html")">QSettings object | |
| void | saveSettings (QSettings &settings, const QString &group=QString("plots/")) const |
| saves the plot properties into a <a href="http://doc.qt.io/qt-5/qsettings.html")">QSettings object. | |
| const JKQTBasePlotterStyle & | getCurrentPlotterStyle () const |
| current style properties for this JKQTBasePlotter | |
| void | setCurrentPlotterStyle (const JKQTBasePlotterStyle &style) |
| replace the current style properties for this JKQTBasePlotter | |
| void | loadCurrentPlotterStyle (const QSettings &settings, const QString &group="plots/") |
| replace the current style properties for this JKQTBasePlotter with properties loaded from settings | |
| void | saveCurrentPlotterStyle (QSettings &settings, const QString &group="plots/") const |
| store the current style properties for this JKQTBasePlotter with properties loaded from settings | |
| void | loadUserSettings (const QSettings &settings, const QString &group=QString("plots_user/")) |
| loads the plot user properties from a <a href="http://doc.qt.io/qt-5/qsettings.html")">QSettings object | |
| void | saveUserSettings (QSettings &settings, const QString &group=QString("plots_user/")) const |
| saves the plot user properties into a <a href="http://doc.qt.io/qt-5/qsettings.html")">QSettings object. | |
| int | getNextStyle () |
| gets the next unused style id, i.e. the smalles number >=0 which is not contained in usedStyles | |
| JKQTPPen | getPlotStyle (int i, JKQTPPlotStyleType type=JKQTPPlotStyleType::Default) const |
| returns a QPen object for the i-th plot style | |
Utilities: Unit Transforms | |
| double | didot2px (double pt, double dpi) const |
| returns the given size in Didot points (0.376 mm) to pixels (with given dots per inch) | |
| double | didot2px (double pt, JKQTPEnhancedPainter &painter) const |
| returns the given size in Didot points (0.376 mm) to pixels (with dpi from painter) | |
| double | didot2px (JKQTPEnhancedPainter &painter, double pt) const |
| returns the given size in Didot points (0.376 mm) to pixels (with dpi from painter) | |
| double | pt2px (double pt, double dpi) const |
| returns the given size in DTP points points (1/72inch = 0.353mm) to pixels (with given dots per inch) | |
| double | pt2px (double pt, JKQTPEnhancedPainter &painter) const |
| returns the given size in DTP points points (1/72inch = 0.353mm) to pixels (with given dots per inch) | |
| double | pt2px (JKQTPEnhancedPainter &painter, double pt) const |
| returns the given size in DTP points points (1/72inch = 0.353mm) to pixels (with given dots per inch) | |
| double | mm2px (double mm, double dpi) const |
| returns the given size in millimeters to pixels (with given dots per inch) | |
| double | mm2px (double mm, JKQTPEnhancedPainter &painter) const |
| returns the given size in millimeters to pixels (with given dots per inch) | |
| double | mm2px (JKQTPEnhancedPainter &painter, double mm) const |
| returns the given size in millimeters to pixels (with given dots per inch) | |
| double | x2p (double x) const |
| return x-pixel coordinate from x coordinate, using the primary axis | |
| double | y2p (double y) const |
| return y-pixel coordinate from y coordinate, using the primary axis | |
| double | p2x (double x) const |
| return x coordinate from x-pixel, using the primary axis | |
| double | p2y (double y) const |
| return y coordinate from y-pixel, using the primary axis | |
Access to Plot Properties | |
| int | getWidth () |
| gets the width of the plot widget | |
| int | getHeight () |
| gets the width of the plot widget | |
| double | getXMin () const |
| returns the current x-axis min of the primary x-axis | |
| double | getXMax () const |
| returns the current x-axis max of the primary x-axis | |
| double | getYMin () const |
| returns the current y-axis min of the primary y-axis | |
| double | getYMax () const |
| returns the current y-axis max of the primary y-axis | |
| double | getAbsoluteXMin () const |
| returns the absolute x-axis min of the primary x-axis. This is the lowest allowed value the the axis min/max. | |
| double | getAbsoluteXMax () const |
| returns the absolute x-axis max of the primary x-axis This is the highest allowed value the the axis min/max. | |
| double | getAbsoluteYMin () const |
| returns the absolute y-axis min of the primary y-axis This is the lowest allowed value the the axis min/max. | |
| double | getAbsoluteYMax () const |
| returns the absolute y-axis max of the primary y-axis This is the highest allowed value the the axis min/max. | |
| void | addGridPrintingPlotter (size_t x, size_t y, JKQTBasePlotter *plotter) |
| add a new plotter for grid printing mode | |
| void | clearGridPrintingPlotters () |
| clear all additional plotters for grid printing mode | |
Coordinate Axis Management | |
| JKQTPHorizontalAxisBase * | getXAxis (JKQTPCoordinateAxisRef axis=JKQTPPrimaryAxis) |
| returns the x-axis objet of the plot | |
| JKQTPVerticalAxisBase * | getYAxis (JKQTPCoordinateAxisRef axis=JKQTPPrimaryAxis) |
| returns the y-axis objet of the plot | |
| const JKQTPHorizontalAxisBase * | getXAxis (JKQTPCoordinateAxisRef axis=JKQTPPrimaryAxis) const |
| returns the x-axis objet of the plot | |
| const JKQTPVerticalAxisBase * | getYAxis (JKQTPCoordinateAxisRef axis=JKQTPPrimaryAxis) const |
| returns the y-axis objet of the plot | |
| bool | hasXAxis (JKQTPCoordinateAxisRef axis=JKQTPPrimaryAxis) const |
| returns whether an x-axis axis is registered with the plotter | |
| bool | hasYAxis (JKQTPCoordinateAxisRef axis=JKQTPPrimaryAxis) const |
| returns whether a y-axis axis is registered with the plotter | |
| QSet< JKQTPCoordinateAxisRef > | getAvailableXAxisRefs (bool includePrimary=false) const |
returns the set of available x-axes (including the primary, if true is given as parameter) | |
| QSet< JKQTPCoordinateAxisRef > | getAvailableYAxisRefs (bool includePrimary=false) const |
returns the set of available y-axes (including the primary, if true is given as parameter) | |
| QMap< JKQTPCoordinateAxisRef, JKQTPHorizontalAxisBase * > | getXAxes (bool includePrimary=true) |
| returns all available x-axes | |
| QMap< JKQTPCoordinateAxisRef, JKQTPVerticalAxisBase * > | getYAxes (bool includePrimary=true) |
| returns all available y-axes | |
| QList< JKQTPCoordinateAxis * > | getAxes (bool includePrimaries=true) |
| returns all available x- or y-axes | |
| QList< const JKQTPCoordinateAxis * > | getAxes (bool includePrimaries=true) const |
| returns all available x- or y-axes | |
| JKQTPCoordinateAxisRef | addSecondaryXAxis (JKQTPHorizontalAxisBase *axis) |
| adds a secondary x-axis | |
| JKQTPCoordinateAxisRef | addSecondaryYAxis (JKQTPVerticalAxisBase *axis) |
| adds a secondary y-axis | |
| void | updateSecondaryAxes () |
| updates the secondary axes | |
| void | correctXYRangeForAspectRatio (double &xminn, double &xmaxx, double &yminn, double &ymaxx) const |
| takes a new axis range xminn ... xmaxx and yminn ... ymaxx and corrects the values to match the currently set axisAspectRatio | |
Key Management Management | |
| JKQTPBaseKey * | getMainKey () |
| retuns the main key object | |
| const JKQTPBaseKey * | getMainKey () const |
| retuns the main key object | |
QActions Management | |
| QAction * | getActionSavePlot () const |
| QAction which triggers saving of the plot as an image. | |
| QAction * | getActionSaveData () const |
| QAction which triggers saving of the data used for the plot. | |
| QAction * | getActionCopyData () const |
| QAction which triggers copying of the data to the clipboard. | |
| QAction * | getActionCopyPixelImage () const |
| QAction which triggers copying of the image to the clipboard. | |
| QAction * | getActionCopyMatlab () const |
| QAction which triggers copying of the data to the clipboard in Matlab format. | |
| QAction * | getActionSavePDF () const |
| QAction which triggers the saving as PDF. | |
| QAction * | getActionSaveSVG () const |
| QAction which triggers the saving as Scalable Vector Graphics (SVG) | |
| QAction * | getActionPrint () const |
| QAction which triggers the printing. | |
| QAction * | getActionSavePix () const |
| QAction which triggers the saving as pixel image. | |
| QAction * | getActionSaveCSV () const |
| QAction which triggers the saving as CSV (data only) | |
| QAction * | getActionZoomAll () const |
| QAction which triggers zoom all. | |
| QAction * | getActionZoomIn () const |
| QAction which triggers zoom in. | |
| QAction * | getActionZoomOut () const |
| QAction which triggers zoom out. | |
| QAction * | getActionShowPlotData () const |
| QAction to show a table with all the plot data in the datastore. | |
| AdditionalActionsMap | getLstAdditionalPlotterActions () const |
| this list contains additional actions, that can be registered by registerAdditionalAction(). They are shown in the context menu only and are e.g. used to display "save image data" actions. Each action may be in a category (key of map), which is displayed as a submenu of the context-menu! | |
| void | registerAdditionalAction (const QString &key, QAction *act) |
| this function registers additional actions to lstAdditionalPlotterActions, which are displayed in the context-menu | |
| void | deregisterAdditionalAction (QAction *act) |
| this function deregisters an additional action, previously added with registerAdditionalAction() | |
Utilities: (math-markup) Text Sizing | |
| JKQTMathTextNodeSize | getTextSizeDetail (const QFont &fm, const QString &text, QPainter &painter) |
| calculates a JKQTMathTextNodeSize for the given string text if it would be drawn on painter with font fm | |
| JKQTMathTextNodeSize | getTextSizeDetail (const QString &fontName, double fontSize, const QString &text, QPainter &painter) |
| calculates a JKQTMathTextNodeSize for the given string text if it would be drawn on painter with font fontName | |
| void | getTextSizeDetail (const QString &fontName, double fontSize, const QString &text, QPainter &painter, double &width, double &ascent, double &descent, double &strikeoutPos) |
| calculates a text-size details for the given string text if it would be drawn on painter with font fontName and font size fontSize | |
| void | getTextSizeDetail (const QFont &fm, const QString &text, QPainter &painter, double &width, double &ascent, double &descent, double &strikeoutPos) |
| calculates a text-size details for the given string text if it would be drawn on painter with font fm | |
| QSizeF | getTextSizeSize (const QFont &fm, const QString &text, QPainter &painter) |
| calculates a size of the given string text if it would be drawn on painter with font fm | |
| QSizeF | getTextSizeSize (const QString &fontName, double fontSize, const QString &text, QPainter &painter) |
| calculates a size of the given string text if it would be drawn on painter with font fontName and font size fontSize | |
| JKQTMathText * | getMathText () |
| returns the internal JKQTMathText, used to render text with LaTeX markup | |
| const JKQTMathText * | getMathText () const |
| returns the internal JKQTMathText, used to render text with LaTeX markup | |
Static Public Member Functions | |
| static void | deregisterPaintDeviceAdapter (JKQTPPaintDeviceAdapter *adapter) |
| de-register a JKQTPPaintDeviceAdapter from JKQTBasePlotter/JKQTPlotter | |
| static bool | deregisterSaveDataAdapter (JKQTPSaveDataAdapter *adapter) |
| de-register a JKQTPSaveDataAdapter from JKQTPlotter/JKQTBasePlotter | |
| static void | registerPaintDeviceAdapter (JKQTPPaintDeviceAdapter *adapter) |
| register a user-defined QPaintDevice (with factory JKQTPPaintDeviceAdapter) as a plugin to JKQTBasePlotter/JKQTPlotter, which will use it to export graphics | |
| static bool | registerSaveDataAdapter (JKQTPSaveDataAdapter *adapter) |
| register a JKQTPSaveDataAdapter with JKQTPlotter/JKQTBasePlotter that can be used to export data from the internal datastore into a file | |
| static void | setDefaultJKQTBasePrinterUserSettings (QString userSettigsFilename, const QString &userSettigsPrefix) |
| set a global preset/default value for the userSettigsFilename and userSettigsPrefix properties of JKQTBasePlotter | |
Protected Types | |
| enum | PlotMarginSide { sideLeft , sideRight , sideTop , sideBottom } |
| enum to indicate relative position from a central position More... | |
| enum | PlotMarginUse { muOutermost =0 , muUserBorder =0 , muPlotTitle , muKey , muGraphsOutside , muAxesOutsideExtend , muAxesOutside , muUsesCount , muInnermost =muUsesCount-1 } |
| used for calculated value:describing what freespace outside the graph area is used for More... | |
Protected Slots | |
| void | exportpreviewPaintRequested (JKQTPEnhancedPainter &painter, QSize size) |
| internal function for export preview | |
| void | getDataColumnsByUserCheckAll () |
| internal function for getDataColumnsByUser() | |
| void | getDataColumnsByUserCheckNone () |
| internal function for getDataColumnsByUser() | |
| void | getDataColumnsByUserComboBoxSelected (const QString &name) |
| internal function for getDataColumnsByUser() | |
| void | getDataColumnsByUserItemChanged (QListWidgetItem *widgetitem) |
| internal function for getDataColumnsByUser() | |
| void | getDataColumnsByUserSave () |
| internal function for getDataColumnsByUser() | |
| void | printpreviewPaintRequested (QPrinter *printer) |
| internal function for print preview | |
| void | printpreviewPaintRequestedNewPaintDevice (QPaintDevice *paintDevice) |
| internal function for print preview | |
| void | printpreviewPaintRequestedNewPrinter (QPrinter *printer) |
| internal function for print preview | |
| void | printpreviewSetAspectRatio (bool checked) |
| internal function for print preview | |
| void | printpreviewSetFontSizeMultiplier (double value) |
| internal function for print preview | |
| void | printpreviewSetKeepAbsFontsize (bool checked) |
| internal function for print preview | |
| void | printpreviewSetLineWidthMultiplier (double value) |
| internal function for print preview | |
| void | printpreviewSetMagnification (double value) |
| internal function for print preview | |
| void | printpreviewSetMagnificationNew (double value) |
| internal function for print preview | |
| void | printpreviewSetSizeX (double value) |
| internal function for print preview | |
| void | printpreviewSetSizeXNew (double value) |
| internal function for print preview | |
| void | printpreviewSetSizeY (double value) |
| internal function for print preview | |
| void | printpreviewSetSizeYNew (double value) |
| internal function for print preview | |
| void | printpreviewSetZoom (double value) |
| internal function for print preview | |
| void | printpreviewToggleMagnification (bool checked) |
| internal function for print preview | |
| void | printpreviewUpdate () |
| internal function for print preview | |
| void | showPlotData () |
| internal function for getDataColumnsByUser() | |
| void | synchronizeXAxis (double newxmin, double newxmax, double newymin, double newymax, JKQTBasePlotter *sender) |
| may be connected to zoomChangedLocally() of a different plot and synchronizes the local x-axis to the other x-axis | |
| void | synchronizeXYAxis (double newxmin, double newxmax, double newymin, double newymax, JKQTBasePlotter *sender) |
| may be connected to zoomChangedLocally() of a different plot and synchronizes the local x- and y-axis to the other x- and y-axis | |
| void | synchronizeYAxis (double newxmin, double newxmax, double newymin, double newymax, JKQTBasePlotter *sender) |
| may be connected to zoomChangedLocally() of a different plot and synchronizes the local y-axis to the other y-axis | |
| void | updatePreviewLabel () |
| internal function for print/export preview | |
Protected Member Functions | |
| QRectF | calcPlotMarginRect (PlotMarginUse use, PlotMarginSide side) const |
| calculate the rectangle to be used for a given PlotMarginUse on the indicated side of the plot | |
| QRectF | calcPlotRect () const |
| calculate the rectangle of the plot (excluding all margins) | |
| void | calcPlotScaling (JKQTPEnhancedPainter &painter) |
| calculate the scaling and offset values from axis min/max values | |
| void | drawGraphs (JKQTPEnhancedPainter &painter) |
| plot the graphs in the order they appear in the list graphs, i.e. initially the order of the addGraph() calls. So the graph at the end of the list is drawn ON TOP. | |
| void | drawKey (JKQTPEnhancedPainter &painter) |
| plot a key | |
| void | drawPlot (JKQTPEnhancedPainter &painter) |
| paints the plot onto the given JKQTPEnhancedPainter object | |
| void | drawPlotLabel (JKQTPEnhancedPainter &painter) |
| plot the plot label | |
| void | drawSystemGrid (JKQTPEnhancedPainter &painter) |
| plot the grid | |
| void | drawSystemXAxis (JKQTPEnhancedPainter &painter) |
| plot the x coordinate axis (incl. labels) | |
| void | drawSystemYAxis (JKQTPEnhancedPainter &painter) |
| plot the x coordinate axis (incl. labels) | |
| bool | exportpreview (QSizeF pageSize, bool unitIsMM=false) |
show the export preview window for a given page size pageSize, either in pixels (unitIsMM ==false ) or in millimeters (unitIsMM ==true ) | |
| QSet< int > | getDataColumnsByUser () |
| double | getPaintMagnification () const |
| this is an internal property that is used by the export/print system to control the "magnification". Usually this is 1.0 but if set !=1.0, it is used to scale the widgetWidth and widgetHeight before painting! | |
| double | getPrintMagnification () const |
| void | gridPaint (JKQTPEnhancedPainter &painter, QSizeF pageRect, bool scaleIfTooLarge=true, bool scaleIfTooSmall=true) |
| simply calls paintPlot() if grid printing mode is deactivated and prints the graph grid otherwise pageRect is used to determine the size of the page to draw on. If this does not coincide with the widget extents this function calculates a scaling factor so the graphs fit onto the page. This is especially usefull when printing! | |
| void | gridPrintingCalc () |
| This method goes through all registered plotters and calculates the width of every column and height of every row as the max over the row/column. The reults are stored in the private datamembers gridPrintingRows and gridPrintingColumns. gridPrintingSize will contain the size of all graphs together afterwards. | |
| void | initSettings () |
| set the standard settings (colors, line widths ...) | |
| bool | printpreviewNew (QPaintDevice *paintDevice, bool setAbsolutePaperSize=false, double printsizeX_inMM=-1.0, double printsizeY_inMM=-1.0, bool displayPreview=true) |
| show the print preview window for a given print p | |
| void | propagateStyle () |
| copy sub-properties of plotterStyle to sub-objects that require it (axes, axes in graphs ...) and emit a plot update | |
| void | setFontSizeMultiplier (double __value) |
| multiplier for the font size | |
| void | setLineWidthMultiplier (double __value) |
| multiplier or the line widths | |
| void | setPaintMagnification (double __value) |
| this is an internal property that is used by the export/print system to control the "magnification". Usually this is 1.0 but if set !=1.0, it is used to scale the widgetWidth and widgetHeight before painting! | |
| void | setPrintMagnification (double __value) |
Protected Attributes | |
| QAction * | actCopyData |
| QAction which triggers copying of the data to the clipboard. | |
| QAction * | actCopyMatlab |
| QAction which triggers copying of the data to the clipboard in Matlab format. | |
| QAction * | actCopyPixelImage |
| QAction which triggers copying of the image to the clipboard. | |
| QAction * | actPrint |
| QAction which triggers the printing. | |
| QAction * | actSaveCSV |
| QAction which triggers the saving as CSV (data only) | |
| QAction * | actSaveData |
| QAction which triggers saving of the data used for the plot. | |
| QAction * | actSavePDF |
| QAction which triggers the saving as PDF. | |
| QAction * | actSavePix |
| QAction which triggers the saving as pixel image. | |
| QAction * | actSavePlot |
| QAction which triggers saving of the plot as an image. | |
| QAction * | actSaveSVG |
| QAction which triggers the saving as Scalable Vector Graphics (SVG) | |
| QAction * | actShowPlotData |
| QAction to show a table with all the plot data in the datastore. | |
| QAction * | actZoomAll |
| QAction which triggers zoom all. | |
| QAction * | actZoomIn |
| QAction which triggers zoom in. | |
| QAction * | actZoomOut |
| QAction which triggers zoom out. | |
| double | aspectRatio |
the aspect ratio of plotwidth and plotheight to maintain, if maintainAspectRatio==true | |
| double | axisAspectRatio |
the aspect ratio of axis widths to maintain, if maintainAxisAspectRatio==true | |
| QString | currentDataFileFormat |
| the current file format to use in SaveDataAs ... dialogs | |
| QString | currentFileFormat |
| the current file format to use in SaveAs ... dialogs | |
| QString | currentPrinter |
| the currently selected printer | |
| QString | currentSaveDirectory |
| the current directory in which to open SaveAs ... dialogs | |
| QComboBox * | dataColumnsCombobox |
| QListWidget * | dataColumnsListWidget |
| JKQTPDatastore * | datastore |
| an object which manages all data columns for this plotter class | |
| bool | datastoreInternal |
| indicates whether the datastore is managed (allocated/freed) internally or externally | |
| bool | emitPlotSignals |
| controls, whether the signals plotUpdated() are emitted | |
| bool | emitSignals |
| specifies whether this class emits signals, like zoomChangedLocally() or beforePlotScalingRecaluclate() | |
| double | fontSizeMultiplier |
| multiplier for the font size | |
| double | fontSizePrintMultiplier |
| multiplier which is used for font sizes when the plot is exported/printed | |
| QMap< QString, QStringList > | getDataColumnsByUserSaved |
| GraphsList | graphs |
| a vector that contains all graphs to be plottet in the system | |
| bool | gridPrinting |
| indicates whether the grid printing is activated | |
| QList< size_t > | gridPrintingColumns |
| this list contains all the columns of the current grid printing and stores its widths | |
| size_t | gridPrintingCurrentX |
| x position of the current graph in grid printing | |
| size_t | gridPrintingCurrentY |
| y position of the current graph in grid printing | |
| QList< JKQTPGridPrintingItem > | gridPrintingList |
| list that manages all the additional graphs for grid printing mode | |
| QList< size_t > | gridPrintingRows |
| this list contains all the rows of the current grid printing and stores its heights | |
| QSizeF | gridPrintingSize |
| size of all plots in grid printing mode, filled by gridPrintingCalc() | |
| double | internalPlotBorderBottom |
| calculated value: free space between widget top border and plot top border, as used to plot the graph | |
| double | internalPlotBorderLeft |
| calculated value: free space between widget top border and plot top border, as used to plot the graph | |
| double | internalPlotBorderRight |
| calculated value: free space between widget top border and plot top border, as used to plot the graph | |
| double | internalPlotBorderTop |
| calculated value: free space between widget top border and plot top border, as used to plot the graph | |
| int | internalPlotHeight |
| calculated value: plot height in pixel inside the widget (calculated by calcPlotScaling() from plotBorderTop, plotBorderBottom and widgetHeight) | |
| JKQTPBaseKey::KeySizeDescription | internalPlotKeyDescription |
| calculated value: size and location of the plot key | |
| PlotMargins | internalPlotMargins |
| calculated value: description of free space between actual plot and widget borders | |
| int | internalPlotWidth |
| calculated value: plot width in pixel inside the widget (calculated by calcPlotScaling() from plotBorderLeft, plotBorderRight and widgetWidth) | |
| double | internalTitleHeight |
| calculated value: height of the plot title (or 0 if no title) | |
| double | lineWidthMultiplier |
| multiplier or the line widths | |
| double | lineWidthPrintMultiplier |
| multiplier which is used for linewidths when the plot is exported/printed | |
| AdditionalActionsMap | lstAdditionalPlotterActions |
| this list contains additional actions, that can be registered by registerAdditionalAction(). They are shown in the context menu only and are e.g. used to display "save image data" actions. Each action may be in a category (key of map), which is displayed as a submenu of the context-menu! | |
| JKQTPGraphsModel * | m_plotsModel |
| model representing all Plots in this plotter and showing their visible/invisible state | |
| JKQTPBaseKey * | mainKey |
| key objects used for the main plot key | |
| bool | maintainAspectRatio |
| indicates whether the widget should maintain an aspect ratio of plotwidth and plotheight | |
| bool | maintainAxisAspectRatio |
| indicates whether the axes should maintain an aspect ratio | |
| JKQTBasePlotter * | masterPlotterX |
| the master plotter for x-dimension, this plotter is connected to. | |
| JKQTBasePlotter * | masterPlotterY |
| the master plotter for y-dimension, this plotter is connected to. | |
| bool | masterSynchronizeHeight |
| synchronize plot height with masterPlotterY | |
| bool | masterSynchronizeWidth |
| synchronize plot width with masterPlotterX | |
| JKQTMathText | mathText |
| used to plot LaTeX markup | |
| double | paintMagnification |
| this is an internal property that is used by the export/print system to control the "magnification". Usually this is 1.0 but if set !=1.0, it is used to scale the widgetWidth and widgetHeight before painting! | |
| QString | plotLabel |
| the plot label text | |
| JKQTBasePlotterStyle | plotterStyle |
| current style properties for this JKQTBasePlotter instance | |
| QMap< JKQTPCoordinateAxisRef, JKQTPHorizontalAxisBase * > | secondaryXAxis |
| objects used a secondary x-axes | |
| QMap< JKQTPCoordinateAxisRef, JKQTPVerticalAxisBase * > | secondaryYAxis |
| objects used a secondary y-axes | |
| bool | useClipping |
| indicates whether to use clipping (hack for printing, see print() ) | |
| QList< int > | usedStyles |
| internal: used to store a list of all currently used plot styles | |
| QString | userSettigsFilename |
| filename for the ini file in which to save the user settings | |
| QString | userSettigsPrefix |
| prefix for the ini file in which to save the user settings | |
| int | widgetHeight |
| height of the plot widget | |
| int | widgetWidth |
| width of the plot widget | |
| JKQTPHorizontalAxis * | xAxis |
| object used for the x-axis | |
| JKQTPVerticalAxis * | yAxis |
| object used for the y-axis | |
Static Protected Attributes | |
| static QString | globalUserSettigsFilename |
| static QString | globalUserSettigsPrefix |
| static std::mutex | globalUserSettingsMutex |
| static JKQTPSynchronized< QList< JKQTPPaintDeviceAdapter * > > | jkqtpPaintDeviceAdapters |
| static JKQTPSynchronized< QList< JKQTPSaveDataAdapter * > > | jkqtpSaveDataAdapters |
Private Attributes | |
| QPointer< QLabel > | exportPreviewLabel |
| bool | exportUnitInMM |
| double | printAspect |
| bool | printDoUpdate |
| bool | printKeepAbsoluteFontSizes |
| bool | printKeepAspect |
| double | printMagnification |
| QSizeF | printPageSizeMM |
| QPointer< QPrintPreviewWidget > | printPreview |
| bool | printScaleToPagesize |
| bool | printSetAbsolutePageSize |
| bool | printSetAbsolutePlotSize |
| double | printSizeX_Millimeter |
| double | printSizeY_Millimeter |
| double | printZoomFactor |
| QPointer< JKQTPEnhancedDoubleSpinBox > | spinMagnification |
| QPointer< JKQTPEnhancedDoubleSpinBox > | spinSizeX |
| QPointer< JKQTPEnhancedDoubleSpinBox > | spinSizeY |
Master/Slave Plot Synchronization | |
| enum | SynchronizationDirection { sdXAxis , sdYAxis , sdXYAxes } |
| denotes, which axes to synchronize in synchronizeToMaster() More... | |
| bool | getMasterSynchronizeWidth () const |
| synchronize plot width with masterPlotterX | |
| bool | getMasterSynchronizeHeight () const |
| synchronize plot height with masterPlotterY | |
| void | synchronizeToMaster (JKQTBasePlotter *master, SynchronizationDirection synchronizeDirection, bool synchronizeAxisLength=true, bool synchronizeZoomingMasterToSlave=true, bool synchronizeZoomingSlaveToMaster=true) |
| synchronize the plot borders (and zooming) with a given plotter (master --> slave/this) | |
| void | synchronizeXToMaster (JKQTBasePlotter *master, bool synchronizeAxisLength=true, bool synchronizeZoomingMasterToSlave=true, bool synchronizeZoomingSlaveToMaster=true) |
| synchronize the plot x-axis width (and x-zooming) with a given master plotter (master --> slave/this) | |
| void | synchronizeYToMaster (JKQTBasePlotter *master, bool synchronizeAxisLength=true, bool synchronizeZoomingMasterToSlave=true, bool synchronizeZoomingSlaveToMaster=true) |
| synchronize the plot y-axis height (and y-zooming) with a given master plotter (master --> slave/this) | |
| void | resetMasterSynchronization (SynchronizationDirection synchronizeDirection=sdXYAxes) |
| switches any synchronization off, that has been created by synchronizeToMaster() | |
Graphs Management | |
| typedef QVector< JKQTPPlotElement * > | GraphsList |
| typedef QVector< JKQTPPlotElement * >::iterator | GraphsIterator |
| typedef QVector< JKQTPPlotElement * >::const_iterator | GraphsConstIterator |
| typedef std::function< bool(const JKQTPPlotElement *)> | PlotElementPreciate |
| Functor which can be used as filter predicate for getGraphsXMinMax() or getGraphsYMinMax() | |
| const JKQTPGraphsModel * | getPlotsModel () const |
| returns model representing all Plots in this plotter and showing their visible/invisible state | |
| JKQTPGraphsModel * | getPlotsModel () |
| returns model representing all Plots in this plotter and showing their visible/invisible state | |
| JKQTPPlotElement * | getGraph (size_t i) |
| returns description of i'th graph | |
| const JKQTPPlotElement * | getGraph (size_t i) const |
| returns description of i'th graph | |
| size_t | getGraphCount () const |
| returns the number of graphs | |
| void | deleteGraph (size_t i, bool deletegraph=true) |
| remove the i-th graph | |
| void | deleteGraph (JKQTPPlotElement *gr, bool deletegraph=true) |
| remove the given graph, if it is contained | |
| const GraphsList & | getGraphs () const |
| returns a const list of all graphs | |
| GraphsList & | getGraphs () |
| returns a list of all graphs | |
| GraphsConstIterator | beginGraphs () const |
| returns a const iterator to the first graph | |
| GraphsConstIterator | endGraphs () const |
| returns a const iterator behind the last graph | |
| GraphsConstIterator | cbeginGraphs () const |
| returns a const iterator to the first graph | |
| GraphsConstIterator | cendGraphs () const |
| returns a const iterator behind the last graph | |
| GraphsIterator | beginGraphs () |
| returns an iterator to the first graph | |
| GraphsIterator | endGraphs () |
| returns an iterator behind the last graph | |
| size_t | addGraphOnTop (JKQTPPlotElement *gr) |
| add a new graph at the end of the graphs, if the graph is already in the plot, it is moved to the end of the list | |
| size_t | addGraph (JKQTPPlotElement *gr) |
| size_t | addGraphAtBottom (JKQTPPlotElement *gr) |
| add a new graph before all other graphs (i.e. at the top of the list of graphs), if the graph is already in the plot, it is moved to the top | |
| bool | containsGraph (const JKQTPPlotElement *gr) const |
returns true, if the given graph is in this plot | |
| void | moveGraphTop (const JKQTPPlotElement *gr) |
| move the given graph gr to the end of all graphs, so it is drawn | |
| void | moveGraphBottom (const JKQTPPlotElement *gr) |
| move the given graph gr to the bottom of all graphs | |
| void | moveGraphTop (int idx) |
| move the given graph to the top | |
| void | moveGraphBottom (int idx) |
| move the given graph to the top | |
| int | indexOfGraph (const JKQTPPlotElement *gr) const |
| returns the index of the given graph gr in the graphs list, or -1 if it was not found | |
| void | moveGraphUp (const JKQTPPlotElement *gr) |
| move the given graph gr one item up (i.e. it is drawn later/higher in the z-stack) | |
| void | moveGraphDown (const JKQTPPlotElement *gr) |
| move the given graph gr one item down (i.e. it is drawn earlier/lower in the z-stack) | |
| void | moveGraphUp (int idx) |
| move the graph at position idx one item up (i.e. it is drawn later/higher in the z-stack) | |
| void | moveGraphDown (int idx) |
| move the graph at position idx one item down (i.e. it is drawn earlier/lower in the z-stack) | |
| template<class TJKQTPGraphContainer> | |
| void | addGraphs (const TJKQTPGraphContainer &gr, QVector< size_t > *graphIDsOut=nullptr) |
| add a new graphs from a QVector<JKQTPPlotElement*>, QList<JKQTPPlotElement*>, std::vector<JKQTPPlotElement*> ... or any standard-iterateable container with JKQTPPlotElement*-items | |
| void | modifyGraphs (const std::function< void(JKQTPPlotElement *)> &func) |
| apply functor func to all graphs in the plotter. After completing the operation, the graph is updated | |
| void | sortGraphs (const std::function< bool(const JKQTPPlotElement *, const JKQTPPlotElement *)> &compareLess) |
| sort the graphs, using functor compareLess to find whether a first graph shall be before (i.e. less) than a second graph. After completing the operation, the graph is updated | |
| bool | getGraphsXMinMax (double &minx, double &maxx, double &smallestGreaterZero, const PlotElementPreciate &predicate=allPlotElements()) |
| get the maximum and minimum x-value over all graphs in the plot | |
| bool | getGraphsYMinMax (double &miny, double &maxy, double &smallestGreaterZero, const PlotElementPreciate &predicate=allPlotElements()) |
| get the maximum and minimum y-value over all graphs in the plot | |
| void | clearGraphs (bool deleteGraphs=true) |
| remove all plots | |
| void | setAllGraphsInvisible () |
| set all graphs in the plotter invisible | |
| void | setAllGraphsVisible () |
| set all graphs in the plotter visible | |
| void | setGraphVisible (int i, bool visible=true) |
| switch visibility of the i -th graph to visible | |
| void | setGraphInvisible (int i) |
| switch visibility of the i -th graph to visible | |
Drawing Functions | |
| class | JKQTPBaseKey |
| class | JKQTPMainKey |
| void | draw (JKQTPEnhancedPainter &painter, const QRect &rect) |
| draw the contained graph (including grid prints) into the given JKQTPEnhancedPainter | |
| void | draw (JKQTPEnhancedPainter &painter, const QPoint &pos=QPoint(0, 0)) |
| draw the contained graph (including grid prints) into the given JKQTPEnhancedPainter | |
| void | drawNonGrid (JKQTPEnhancedPainter &painter, const QRect &rect) |
| draw the contained graph (including grid prints) into the given JKQTPEnhancedPainter | |
| void | drawNonGrid (JKQTPEnhancedPainter &painter, const QPoint &pos=QPoint(0, 0)) |
| draw the contained graph (including grid prints) into the given JKQTPEnhancedPainter | |
| void | redrawPlot () |
| emit plotUpdated(), which can be used by e.g. a widget class to update the displayed plot | |
| void | setEmittingPlotSignalsEnabled (bool __value) |
| controls, whether the signals plotUpdated() are emitted | |
| bool | isEmittingPlotSignalsEnabled () const |
| returns, whether the signals plotUpdated() are emitted | |
| bool | isEmittingSignalsEnabled () const |
| returns whether this class emits signals, like zoomChangedLocally() or beforePlotScalingRecaluclate() | |
| void | setEmittingSignalsEnabled (bool enabled) |
| specifies whether this class emits signals, like zoomChangedLocally() or beforePlotScalingRecaluclate() | |
| int | getPlotBorderTop () const |
| free space between widget top border and plot top border, this property may be set by the user and is possibly altered by the key positioning algorithm. The altered value is written to internalPlotBorderTop | |
| int | getPlotBorderLeft () const |
| free space between widget left border and plot left border, this property may be set by the user and is possibly altered by the key positioning algorithm. The altered value is written to internalPlotBorderLeft | |
| int | getPlotBorderBottom () const |
| free space between widget bottom border and plot bottom border, this property may be set by the user and is possibly altered by the key positioning algorithm. The altered value is written to internalPlotBorderBottom | |
| int | getPlotBorderRight () const |
| free space between widget right border and plot right border, this property may be set by the user and is possibly altered by the key positioning algorithm. The altered value is written to internalPlotBorderRight | |
| bool | doesMaintainAspectRatio () const |
| returns whether the maintaining of the data aspect ratio is enabled or disabled | |
| double | getAspectRatio () const |
| returns the data aspect ratio, enforced with setMaintainApsectRatio(true) | |
| bool | doesMaintainAxisAspectRatio () const |
| returns whether the maintaining of the axis aspect ratio is enabled or disabled | |
| double | getAxisAspectRatio () const |
| returns the axis aspect ratio, enforced with setMaintainAxisApsectRatio(true) | |
| bool | isUsingAntiAliasingForSystem () const |
| specifies whether to use antialiasing for plotting the coordinate system | |
| bool | isUsingAntiAliasingForGraphs () const |
| specifies whether to use antialiasing for plotting the graphs | |
| bool | isUsingAntiAliasingForText () const |
| specifies whether to use antialiasing when drawing any text | |
| QColor | getBackgroundColor () const |
| color of the background of the plot (widget area) when drawing (to the screen) | |
| QColor | getExportBackgroundColor () const |
| color of the background of the plot (widget area) when exporting | |
| QColor | getPlotBackgroundColor () const |
| color of the plot's background (i.e. of the area within the coordinate axes rectangle) | |
| QBrush | getBackgroundBrush () const |
| color of the background of the plot (widget area) when drawing (to the screen) | |
| QBrush | getExportBackgroundBrush () const |
| color of the background of the plot (widget area) when exporting | |
| QBrush | getPlotBackgroundBrush () const |
| color of the plot's background (i.e. of the area within the coordinate axes rectangle) | |
| bool | getShowKey () const |
| indicates whether to plot a key | |
| JKQTPKeyPosition | getKeyPosition () const |
| key position inside or besides the plot area, see JKQTPKeyPositions for details and examples | |
| QColor | getDefaultTextColor () const |
| default text color in the plot | |
| double | getDefaultTextSize () const |
| default font size in the plot [pt] | |
| QString | getDefaultTextFontName () const |
| default font name in the plot | |
| void | setFontSizePrintMultiplier (double __value) |
| multiplier which is used for font sizes when the plot is exported/printed | |
| double | getFontSizePrintMultiplier () const |
| multiplier which is used for font sizes when the plot is exported/printed | |
| void | setLineWidthPrintMultiplier (double __value) |
| multiplier which is used for linewidths when the plot is exported/printed | |
| double | getLineWidthPrintMultiplier () const |
| multiplier which is used for linewidths when the plot is exported/printed | |
| double | getFontSizeMultiplier () const |
| multiplier for the font size | |
| double | getLineWidthMultiplier () const |
| multiplier or the line widths | |
| const JKQTPKeyStyle & | getMainKeyStyle () const |
| retuns the JKQTPKeyStyle to be used for the main key (extracted from JKQTBasePlotterStyle::keyStyle) | |
| bool | isDebugShowRegionBoxesEnabled () const |
if set true (default: false ) the JKQTBasePlotter draws colored rectangles to indicate the different regions in the plot (border, axes, ...) | |
| bool | isDebugShowTextBoxesEnabled () const |
if set true (default: false ) the JKQTBasePlotter draws colored rectangles to indicate the extent of text | |
| bool | isPlotFrameVisible () const |
if true, JKQTBasePlotter will draw a rectangle/frame around the plot | |
| QColor | getPlotFrameColor () const |
if plotFrameVisible==true, JKQTBasePlotter will draw a rectangle/frame around the plot in this color | |
| double | getPlotFrameWidth () const |
if plotFrameVisible==true, JKQTBasePlotter will draw a rectangle/frame around the plot in this width [pt] | |
| double | getPlotFrameRounding () const |
if plotFrameVisible==true, JKQTBasePlotter will draw a rectangle/frame around the plot, rounding the corners with this redius (<=0 -> no rounded rectangle) [pt] | |
| double | getPlotLabelFontSize () const |
| the plot label font size [pt] | |
| double | getPlotLabelOffset () const |
| offset of the plot label from the next element of the graph, i.e. below the label [pt]. | |
| double | getPlotLabelTopBorder () const |
| offset of the plot label from the top [pt]. | |
| QString | getplotLabelFontName () const |
| the plot label font name | |
| QColor | getPlotLabelColor () const |
| the plot label color | |
| QString | getPlotLabel () const |
| the plot label text | |
| void | setGridPrinting (bool __value) |
| indicates whether the grid printing is activated | |
| bool | getGridPrinting () const |
| indicates whether the grid printing is activated | |
| void | setGridPrintingCurrentX (size_t __value) |
| x position of the current graph in grid printing | |
| size_t | getGridPrintingCurrentX () const |
| x position of the current graph in grid printing | |
| void | setGridPrintingCurrentY (size_t __value) |
| y position of the current graph in grid printing | |
| size_t | getGridPrintingCurrentY () const |
| y position of the current graph in grid printing | |
| void | setGridPrintingCurrentPos (size_t x, size_t y) |
| set the x- and y-positions of this JKQTPlotter in the grid-printing grid | |
| QString | getCurrentSaveDirectory () const |
| returns the current directory in which to open SaveAs ... dialogs | |
| QString | getCurrentFileFormat () const |
| return the last file format to use in SaveAs ... dialogs | |
| QString | getCSVdecimalSeparator () const |
| returns the decimal separator used when exporting data to text files | |
| QString | getCSVcommentInitializer () const |
| set the string used to introduce comments in text output when exporting data | |
| double | getInternalPlotBorderTop () const |
| calculated value: free space between widget top border and plot top border, as used to plot the graph | |
| double | getInternalPlotBorderLeft () const |
| calculated value: free space between widget top border and plot top border, as used to plot the graph | |
| double | getInternalPlotBorderBottom () const |
| calculated value: free space between widget top border and plot top border, as used to plot the graph | |
| double | getInternalPlotBorderRight () const |
| calculated value: free space between widget top border and plot top border, as used to plot the graph | |
| int | getPlotWidth () const |
| calculated value: plot width in pixel inside the widget (calculated by calcPlotScaling() from plotBorderLeft, plotBorderRight and widgetWidth) | |
| int | getPlotHeight () const |
| calculated value: plot height in pixel inside the widget (calculated by calcPlotScaling() from plotBorderTop, plotBorderBottom and widgetHeight) | |
| JKQTPKeyStyle & | getMainKeyStyle () |
| retuns the JKQTPKeyStyle to be used for the main key (extracted from JKQTBasePlotterStyle::keyStyle) | |
Plot Data Export | |
| void | saveAsCSV (const QString &filename, const QString &decimalSeparator, const QString &commentInitializer) |
| save the current plot data as a Comma Separated Values (CSV) file | |
| void | saveAsSemicolonSV (const QString &filename, const QString &decimalSeparator, const QString &commentInitializer) |
| save the current plot data as a Semicolon Separated Values (SSV) file | |
| void | saveAsTabSV (const QString &filename, const QString &decimalSeparator, const QString &commentInitializer) |
| save the current plot data as a Tabulator Separated Values (CSV) file | |
| bool | saveData (const QString &filename=QString(""), const QString &format=QString("")) |
| save the data used for the current plot. The file format is extracted from the file extension (csv, ...) | |
| void | copyData () |
| copy the data used for the current plot to the clipboard | |
| void | copyDataMatlab () |
| copy the data used for the current plot to the clipboard as a Matlab script | |
| void | saveAsCSV (const QString &filename=QString("")) |
| save the current plot data as a Comma Separated Values (CSV) file | |
| void | saveAsSemicolonSV (const QString &filename=QString("")) |
| save the current plot data as a Semicolon Separated Values (SSV) file | |
| void | saveAsTabSV (const QString &filename=QString("")) |
| save the current plot data as a Tabulator Separated Values (CSV) file | |
| void | saveAsDIF (const QString &filename=QString("")) |
| save the current plot data as a Data Interchange Format file (see https://en.wikipedia.org/wiki/Data_Interchange_Format). | |
| void | saveAsSYLK (const QString &filename=QString("")) |
| save the current plot data as a SYmbolik LinK (SYLK) spreadsheet file (see https://en.wikipedia.org/wiki/Symbolic_Link_(SYLK) ) | |
| void | saveAsMatlab (const QString &filename=QString("")) |
| save the current plot data as a Matlab Script | |
| void | saveAsGerExcelCSV (const QString &filename=QString("")) |
| save the current plot data as a Semicolon Separated Values (CSV) file for german Excel, i.e. with comma as decimal separator | |
Saving/Exporting Plots as Image/Vector Files | |
| bool | saveAsPixelImage (const QString &filename=QString(""), bool displayPreview=true, const QByteArray &outputFormat=QByteArray(), const QSize &outputSizeIncrease=QSize(0, 0)) |
| save the current plot as a pixel image image (PNG ...), if filename is empty a file selection dialog is displayed | |
| QImage | grabPixelImage (QSize size=QSize(), bool showPreview=false) |
| returns a rendering of the current plot as a QImage (pixel image) with the given size | |
| void | copyPixelImage (bool showPreview=true) |
| copy the current plot as a pixel+svg image to the clipboard | |
| bool | saveAsSVG (const QString &filename=QString(""), bool displayPreview=true) |
| save the current plot as a SVG file, with the current widget aspect ratio, if filename is empty a file selection dialog is displayed | |
| bool | saveAsPDF (const QString &filename=QString(""), bool displayPreview=true) |
| save the current plot as a PDF file, with the current widget aspect ratio, if filename is empty a file selection dialog is displayed | |
| bool | saveImage (const QString &filename=QString(""), bool displayPreview=true) |
| save the current plot as an image file, with the current widget aspect ratio, if filename is empty a file selection dialog is displayed. The image format is extracted from the file extension (jpeg, tiff, png, pdf, ...) | |
| void | beforeExporting () |
| emitted just before exporting the current plot as image, or just before the export preview dialog is shown | |
| void | afterExporting () |
| emitted just before exporting the current plot as image, or just before the export preview dialog is shown | |
Print Support | |
| void | print (QPrinter *printer=nullptr, bool displayPreview=true) |
print the current plot, if printer is nullptr a printer selection dialog is displayed | |
| void | beforePrinting () |
| emitted just before Printing the current plot as image, or just before the print preview dialog is shown | |
| void | afterPrinting () |
| emitted just before Printing the current plot as image, or just before the print preview dialog is shown | |
base class for 2D plotter classes (used by the plotter widget JKQTPlotter)
This class implements basic functionalities for the plotter classes. Those are:
This class is NOT a widget, if you need a plotting widget, use JKQTPlotter. This class may be used to plot using a JKQTPEnhancedPainter.
As already mentioned this class does not provide means to draw graphs, but it contains a basic mechanism to associate data with it. This is imeplemented, using a JKQTPDatastore object together with some convenience access methods. No further data access is implemented and child classes are NOT forced to use this datastore. Hide it if you want. JKQTPlotter shows how to use it. This class implement a graph management, where graphs simply point to a set of columns inside the datastore that contain the actual plot data!
If you call the JKQTBasePlotter::JKQTBasePlotter() constructor with no arguments, it will create an internal datastore object and you can start adding data by using getDatastore(). If you have an external JKQTPDatastore object you can give it as parameter to the constructor or use one of the other methods:
These topics are discussed in the help for JKQTPCoordinateAxis. There is a set of coordinate transform methods (x2p(), y2p(), p2x(), p2y() which only call the respective methods in xAxis and yAxis objects.
JKQTBasePlotter - by default - has two major axes: A horizontal x-axis and a vertical y-axis.
The plotting of coordinate axes and grids, as well as coordinate transforms is done by JKQTPCoordinateAxis descendents (see documentation there).
If you want to set the axis properties, use getXAxis() or getYAxis() to get a pointer to the axis objects which then may be used to set the axis properties.
In addition a plot may contain secondary axes, as shown below:
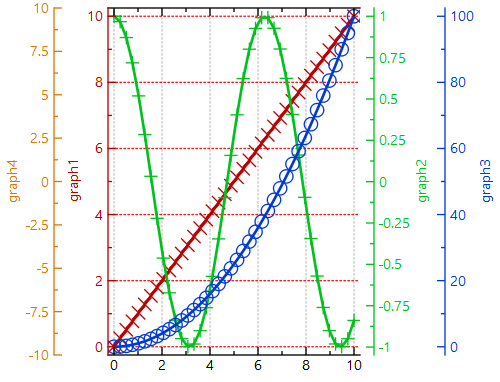
You can add additional x-axes using addSecondaryXAxis() and y-axes using addSecondaryYAxis(). These functions return a JKQTPCoordinateAxisRef, which can be used to reference these axes, when calling function like getXAxis() here the default-parameter call getXAxis(JKQTPPrimaryAxis) returns the primary axis (JKQTPPrimaryAxis may be omitted) and calling getXAxis(JKQTPSecondaryAxis) will return the first secondary axis and so on.
In graphs (derived from JKQTPPlotElement) you can use JKQTPPlotElement::setXAxis() and JKQTPPlotElement::setYAxis() with a JKQTPCoordinateAxisRef as parameter to tell plots to use another axis.
Using a JKQTPCoordinateAxisRef instead of a pointer to a JKQTPCoordinateAxis allows to exchange the axes in the plot, while not breaking the graphs.
Here is a code example of how to use secondary axes:
JKQTBasePlotter itself is no QWidget. It is merely tool to represent, manage and draw a graph onto any durface. JKQTPlotter then uses an internal JKQTBasePlotter instance to provide a QWidget.
Still the JKQTBasePlotter needs a way to represent the location of the graph, the graph axes etc. inside a drawing rectangle (of size widgetWidth * widgetHeight ). The plot borders are then offsets to the plot indise that rectangele. This image illustrated the principle:
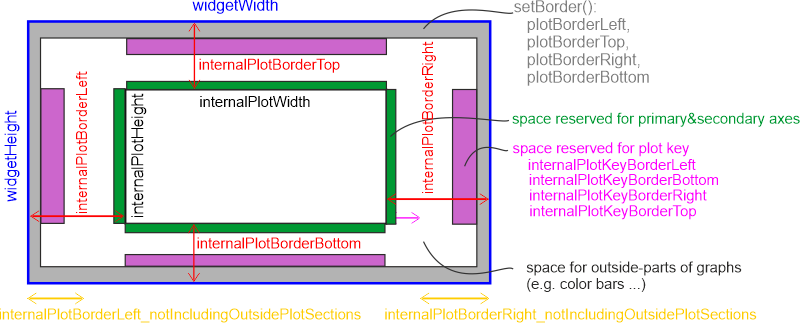
When the plot is actually drawn, it may happen, that additional elements need to be positioned between the actual coordinate rectangle and the widget worder (e.g. axis labels, ticks, color bars etc.). Therefore this objects manages a set of internally calculated variables that also incorporate those dynamic elements. These are e.g. internalPlotBorderLeft, internalPlotBorderTop, internalPlotBorderRight, ... Their names all start with internal... .
First note that this functionality is only available and activated if both axes are linear!
You can set two different aspect ratios:
![\[ \mbox{aspectRatio}=\frac{\mbox{plotWidth}}{\mbox{plotHeight}} \]](form_248_dark.png)
![\[ \mbox{axisAspectRatio}=\frac{\left|x_\text{max}-x_\text{min}\right|}{\left|y_\text{max}-y_\text{min}\right|} \]](form_249_dark.png)
So to achieve different effects, use these combinations:
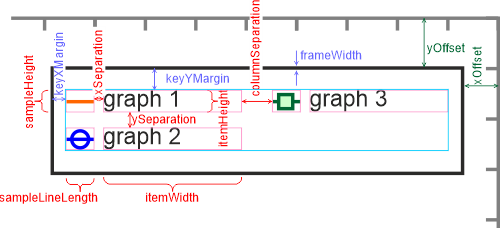
This class provides means to plot a key together with the functions. The plotting is only partially implemented in this base class, and has to be implemented by child classes, as no graph management, that could provide a title for a specific graph, is implemented here. Key Plotting is performed in the plotKey() method. This method basically draws a frame and background and then calls plotKeyContent() to draw the actual contents. The size of the key is determined by a call to getKeyExtent(), while it's position and plotting style is determined by the key_... parameters. If getKeyExtent() returns 0 for height or width, no key is plotted. The key_... parameters are designed to be rather common for any usual kind of key, so any implementation of key should be able to use them to parametrize the output. Note however that additional parameters might be defined in child classes.
As it may be convenient to position the key completely outside the graph this class may change the plotBorders to make the key fit outside SO if you use a keyPosition outside the graph you should NOT keep any space for the key in the margins, as the program will change them to accomodate the size of the key. If you select an inside key position the key will be plotted OVER the graph, i.e. the margins won't be changed Note that the margin change is internal and not visible in the class interface!
There is also a possibility to determine the size of the key automatically, so all text fits in. This is activted by the property keyAutosize ( ). If this is true the function getKeyExtent() has to check the width of every key item and take it into account when calculating the width and height of the key content. By default this feature is switched ON.
This class implement a set of function to save and print the graphs:
You can also copy the contents of the plot into the clipboard:
This class implement a set of function to save the data of the graphs:
You can also copy the graphs' data into the clipboard:
Often a single plot is not sufficient, but several plots need to be aligned with respect to each other:
This can be achieved by putting several JKQTPlotter instances into a Qt Layout. Then you can fill each plot differently and set the x-/y-range of each plot by hand. This method works for simple cases, but has several drawbacks:
To overcome these limitations, JKQTPlotter (and JKQTBasePlotter) offer an API with which you can declare relations between different plots (one of them is made the master) and you can synchronize the axes of two plots, when zooming (also when calling e.g. zoomToFit() or setXY() ). This API is:
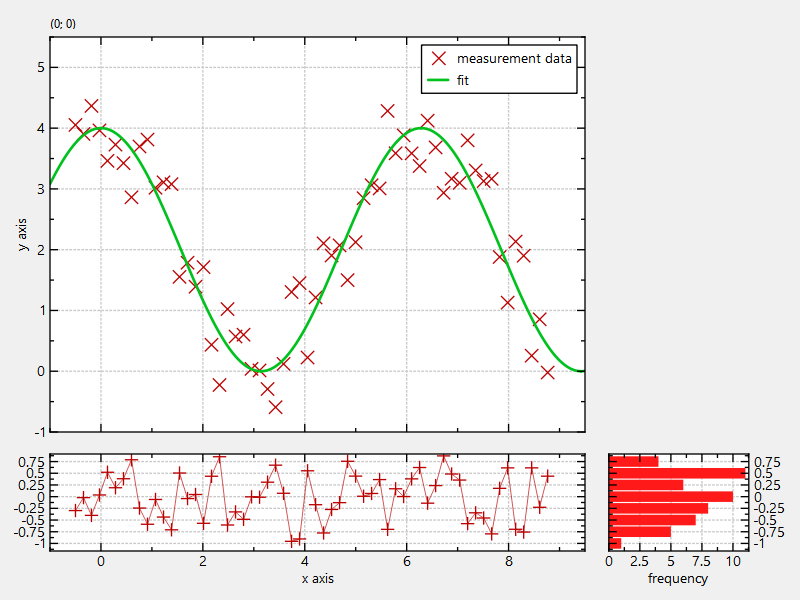
You can synchronize the plot width and axis range between two JKQTPlotter instaces using:
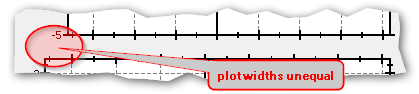
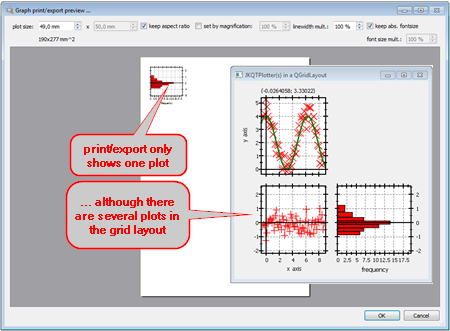
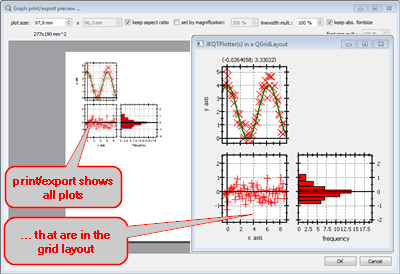
plotMain ) and bottom-left plot (plotResid ), as well as the y-axes of the bottom-left (plotResid ) and bottom-right plot (plotResidHist ). After this call they will have the same size in screen pixels and always span the same range in plot coordinates.Usually each JKQTPlotter/JKQTBasePlotter prints or exports only itself. But in many cases you might want to add several plots that form a grid layout and also want to export them as one image/print them on one page. To do this, JKQTPlotter/JKQTBasePlotter offers the "grid printing" mode. In this mode, you can declare relations between different JKQTPlotters/JKQTBasePlotters by putting them in a rectangular grid (like in a QGridLayout). then any export/print action will draw all (explicitly) decalred graphs.

The grid printing API is composed of these functions:
true , and you print afterwards, the printout (or export) will not only contain the plot itself, but also additional plots that were declared using addGridPrintingPlotter() (see below).There is a subset of options that describe how the user interacted with the plotter (export/print scaling factors etc, save directories, other export settings, ...). These are not stored/loaded using saveSettings() and loadSettings(), but using saveUserSettings() and loadUserSettings(). These methods MAY (strictly optional and turned off by default) be called by saveSettings() and loadSettings(), if the property userSettigsFilename ( filename for the ini file in which to save the user settings )is set (not-empty). In this case the suer settings are stored/loaded also everytime they are changed by the user or programmatically.
Most commonly this invisible plotter class is used as basis for the widget JKQTPlotter.
It is also possible to use it in a standalone fashion to generate plots without generating a window. Note that the baseplotter class still requires the widgets+gui modules of Qt, because it contains code to e.g. display pint or export preview dialogs!
Here is an example of how to do this (it is taken from the command-line tool Tool (JKQTMathText): Command-Line Utility jkqtplotter_doc_imagegenerator):
First we generate the JKQTBasePlotter object and add some data to the internal JKQTPDatastore
Now we set the range of x/y plot coordinates ...
and the size of the widget, i.e. the size of the plot in the windowing system.
Now we can add graphs to the plotter, e.g.
Finally we store an image of the plot as PNG-file:
Alternatively you can obtain a QImage of the plot using JKQTBasePlotter::grabPixelImage() or copy the image to the clipboard using JKQTBasePlotter::copyPixelImage(). Also storages as PDF and SVG is available via JKQTBasePlotter::saveAsPDF() and JKQTBasePlotter::saveAsSVG().
With simlar code you can also integrate JKQTBasePlotter into your own widgets.
This class is immpleented in a such a way that different instances can be used in different parallel threads, i.e. the class is re-entrant. There are however access to different cached data is synchronized between all threads (i.e. static internal caches are used), which limmits the acheavable parallelization speedup!
See Example (JKQTPlotter): Multi-Threaded (Parallel) Plotting for an example of multi-threaded plotting!
| typedef QMap<QString, QList<QPointer<QAction> > > JKQTBasePlotter::AdditionalActionsMap |
| typedef QMapIterator<QString, QList<QPointer<QAction> > > JKQTBasePlotter::AdditionalActionsMapIterator |
| typedef QVector<JKQTPPlotElement*>::const_iterator JKQTBasePlotter::GraphsConstIterator |
| typedef QVector<JKQTPPlotElement*>::iterator JKQTBasePlotter::GraphsIterator |
| typedef QVector<JKQTPPlotElement*> JKQTBasePlotter::GraphsList |
| typedef std::function<bool(const JKQTPPlotElement*)> JKQTBasePlotter::PlotElementPreciate |
Functor which can be used as filter predicate for getGraphsXMinMax() or getGraphsYMinMax()
|
protected |
|
protected |
denotes, which axes to synchronize in synchronizeToMaster()
| Enumerator | |
|---|---|
| sdXAxis | x-axis only |
| sdYAxis | y-axis only |
| sdXYAxes | x- and y-axis |
|
explicit |
class constructor
if datastore_internal is true then the constructor will create an internal datastore object. The datastore will be managed (freed) by this class. If datastore_internal is false the class will use the datastore provided in datast as an external datastore. You can modify this later by using useInternalDatastore() and useExternalDatastore().
|
delete |
|
virtual |
class destructor
|
inline |
| size_t JKQTBasePlotter::addGraphAtBottom | ( | JKQTPPlotElement * | gr | ) |
add a new graph before all other graphs (i.e. at the top of the list of graphs), if the graph is already in the plot, it is moved to the top
| gr | graph object (of type JKQTPPlotElement) to be added. Note: The JKQTPlotter takes ownership of graph gr . |
| size_t JKQTBasePlotter::addGraphOnTop | ( | JKQTPPlotElement * | gr | ) |
add a new graph at the end of the graphs, if the graph is already in the plot, it is moved to the end of the list
| gr | graph object (of type JKQTPPlotElement) to be added. Note: The JKQTPlotter takes ownership of graph gr . |
|
inline |
add a new graphs from a QVector<JKQTPPlotElement*>, QList<JKQTPPlotElement*>, std::vector<JKQTPPlotElement*> ... or any standard-iterateable container with JKQTPPlotElement*-items
| TJKQTPGraphContainer | a container type with default C++-sytle iterator interface (i.e. methods begin() and end() and an iterator, which may be moved to the next element with the operator ++ . |
| gr | Container of type TJKQTPGraphContainer, which contains the graphs Note: The JKQTPlotter takes ownership of graphs in gr . | |
| [out] | graphIDsOut | optional output parameter, the vector will contain the IDs of each graph added to theis plot |
| void JKQTBasePlotter::addGridPrintingPlotter | ( | size_t | x, |
| size_t | y, | ||
| JKQTBasePlotter * | plotter ) |
add a new plotter for grid printing mode
| JKQTPCoordinateAxisRef JKQTBasePlotter::addSecondaryXAxis | ( | JKQTPHorizontalAxisBase * | axis | ) |
adds a secondary x-axis
| axis | the JKQTPHorizontalAxisBase object to add |
Usage is simple:
Here is an example output:
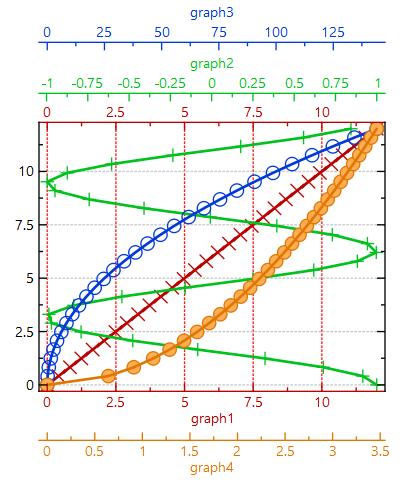
| JKQTPCoordinateAxisRef JKQTBasePlotter::addSecondaryYAxis | ( | JKQTPVerticalAxisBase * | axis | ) |
adds a secondary y-axis
| axis | the JKQTPVerticalAxisBase object to add |
Usage is simple:
Here is an example output:
|
signal |
emitted just before exporting the current plot as image, or just before the export preview dialog is shown
This signal can be used to e.g. modify the plotter settings after an export.
|
signal |
emitted just before Printing the current plot as image, or just before the print preview dialog is shown
This signal can be used to e.g. modify the plotter settings after a print.
|
signal |
emitted just before exporting the current plot as image, or just before the export preview dialog is shown
This signal can be used to e.g. modify the plotter settings before an export.
|
signal |
emitted before the plot scaling has been recalculated
|
signal |
emitted just before Printing the current plot as image, or just before the print preview dialog is shown
This signal can be used to e.g. modify the plotter settings before a print.
|
inline |
returns an iterator to the first graph
|
inline |
returns a const iterator to the first graph
|
protected |
calculate the rectangle to be used for a given PlotMarginUse on the indicated side of the plot
This function evaluates the data in internalPlotMargins also using the other properties known in this class. Basically it therefore defines the ordering and interpretation of PlotMarginUse.
|
protected |
calculate the rectangle of the plot (excluding all margins)
|
protected |
calculate the scaling and offset values from axis min/max values
|
inline |
returns a const iterator to the first graph
|
inline |
returns a const iterator behind the last graph
|
slot |
remove all plots
| deleteGraphs | if set true (default) the graph objects will also be deleted |
| void JKQTBasePlotter::clearGridPrintingPlotters | ( | ) |
clear all additional plotters for grid printing mode
| bool JKQTBasePlotter::containsGraph | ( | const JKQTPPlotElement * | gr | ) | const |
returns true, if the given graph is in this plot
|
slot |
copy the data used for the current plot to the clipboard
copies data as tab separated data with the system-decimal point.
|
slot |
copy the data used for the current plot to the clipboard as a Matlab script
example output:
|
slot |
copy the current plot as a pixel+svg image to the clipboard
| void JKQTBasePlotter::correctXYRangeForAspectRatio | ( | double & | xminn, |
| double & | xmaxx, | ||
| double & | yminn, | ||
| double & | ymaxx ) const |
| void JKQTBasePlotter::deleteGraph | ( | JKQTPPlotElement * | gr, |
| bool | deletegraph = true ) |
remove the given graph, if it is contained
| void JKQTBasePlotter::deleteGraph | ( | size_t | i, |
| bool | deletegraph = true ) |
remove the i-th graph
| void JKQTBasePlotter::deregisterAdditionalAction | ( | QAction * | act | ) |
this function deregisters an additional action, previously added with registerAdditionalAction()
|
static |
de-register a JKQTPPaintDeviceAdapter from JKQTBasePlotter/JKQTPlotter
|
static |
de-register a JKQTPSaveDataAdapter from JKQTPlotter/JKQTBasePlotter
|
inline |
returns the given size in Didot points (0.376 mm) to pixels (with given dots per inch)
|
inline |
returns the given size in Didot points (0.376 mm) to pixels (with dpi from painter)
|
inline |
returns the given size in Didot points (0.376 mm) to pixels (with dpi from painter)
| bool JKQTBasePlotter::doesMaintainAspectRatio | ( | ) | const |
returns whether the maintaining of the data aspect ratio is enabled or disabled
| bool JKQTBasePlotter::doesMaintainAxisAspectRatio | ( | ) | const |
returns whether the maintaining of the axis aspect ratio is enabled or disabled
| void JKQTBasePlotter::draw | ( | JKQTPEnhancedPainter & | painter, |
| const QPoint & | pos = QPoint(0, 0) ) |
draw the contained graph (including grid prints) into the given JKQTPEnhancedPainter
| painter | JKQTPEnhancedPainter to which the plot should be drawn |
| pos | where to plot the painter (left-top corner) |
| void JKQTBasePlotter::draw | ( | JKQTPEnhancedPainter & | painter, |
| const QRect & | rect ) |
draw the contained graph (including grid prints) into the given JKQTPEnhancedPainter
| painter | JKQTPEnhancedPainter to which the plot should be drawn |
| rect | rectangle to plot into |
|
protected |
plot the graphs in the order they appear in the list graphs, i.e. initially the order of the addGraph() calls. So the graph at the end of the list is drawn ON TOP.
|
protected |
plot a key
| void JKQTBasePlotter::drawNonGrid | ( | JKQTPEnhancedPainter & | painter, |
| const QPoint & | pos = QPoint(0, 0) ) |
draw the contained graph (including grid prints) into the given JKQTPEnhancedPainter
| painter | JKQTPEnhancedPainter to which the plot should be drawn |
| pos | where to plot the painter (left-top corner) |
| void JKQTBasePlotter::drawNonGrid | ( | JKQTPEnhancedPainter & | painter, |
| const QRect & | rect ) |
draw the contained graph (including grid prints) into the given JKQTPEnhancedPainter
| painter | JKQTPEnhancedPainter to which the plot should be drawn |
| rect | rectangle to plot into |
|
protected |
paints the plot onto the given JKQTPEnhancedPainter object
| painter | JKQTPEnhancedPainter to draw on |
|
protected |
plot the plot label
|
protected |
plot the grid
|
protected |
plot the x coordinate axis (incl. labels)
|
protected |
plot the x coordinate axis (incl. labels)
|
slot |
if set true (default: false ) the JKQTBasePlotter draws colored rectangles to indicate the different regions in the plot (border, axes, ...)
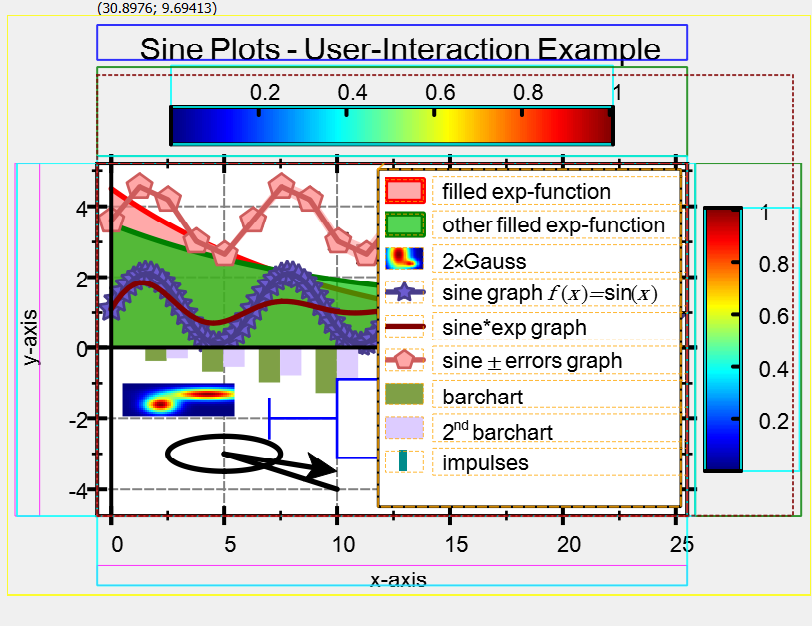
|
slot |
if set true (default: false ) the JKQTBasePlotter draws colored rectangles to indicate the extent of text in the plot
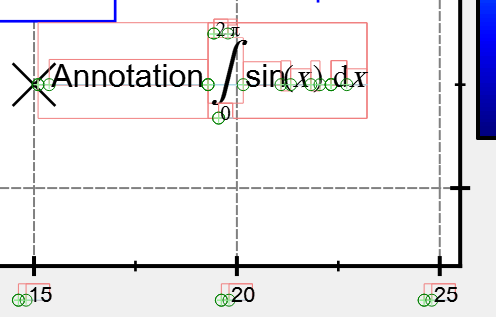
|
inline |
returns an iterator behind the last graph
|
inline |
returns a const iterator behind the last graph
|
protected |
show the export preview window for a given page size pageSize, either in pixels (unitIsMM ==false ) or in millimeters (unitIsMM ==true )
|
protectedslot |
internal function for export preview
| void JKQTBasePlotter::forceInternalDatastore | ( | ) |
tells the plotter object to use an internal datastore (just like useInternalDatastore() ), but forces the generation of a new datastore, even if the current one is already internal (the current one will be freed in the lather case
| double JKQTBasePlotter::getAbsoluteXMax | ( | ) | const |
returns the absolute x-axis max of the primary x-axis This is the highest allowed value the the axis min/max.
| double JKQTBasePlotter::getAbsoluteXMin | ( | ) | const |
returns the absolute x-axis min of the primary x-axis. This is the lowest allowed value the the axis min/max.
| double JKQTBasePlotter::getAbsoluteYMax | ( | ) | const |
returns the absolute y-axis max of the primary y-axis This is the highest allowed value the the axis min/max.
| double JKQTBasePlotter::getAbsoluteYMin | ( | ) | const |
returns the absolute y-axis min of the primary y-axis This is the lowest allowed value the the axis min/max.
| QAction * JKQTBasePlotter::getActionCopyData | ( | ) | const |
QAction which triggers copying of the data to the clipboard.
| QAction * JKQTBasePlotter::getActionCopyMatlab | ( | ) | const |
QAction which triggers copying of the data to the clipboard in Matlab format.
| QAction * JKQTBasePlotter::getActionCopyPixelImage | ( | ) | const |
QAction which triggers copying of the image to the clipboard.
| QAction * JKQTBasePlotter::getActionPrint | ( | ) | const |
QAction which triggers the printing.
| QAction * JKQTBasePlotter::getActionSaveCSV | ( | ) | const |
QAction which triggers the saving as CSV (data only)
| QAction * JKQTBasePlotter::getActionSaveData | ( | ) | const |
QAction which triggers saving of the data used for the plot.
| QAction * JKQTBasePlotter::getActionSavePDF | ( | ) | const |
QAction which triggers the saving as PDF.
| QAction * JKQTBasePlotter::getActionSavePix | ( | ) | const |
QAction which triggers the saving as pixel image.
| QAction * JKQTBasePlotter::getActionSavePlot | ( | ) | const |
QAction which triggers saving of the plot as an image.
| QAction * JKQTBasePlotter::getActionSaveSVG | ( | ) | const |
QAction which triggers the saving as Scalable Vector Graphics (SVG)
| QAction * JKQTBasePlotter::getActionShowPlotData | ( | ) | const |
QAction to show a table with all the plot data in the datastore.
| QAction * JKQTBasePlotter::getActionZoomAll | ( | ) | const |
QAction which triggers zoom all.
| QAction * JKQTBasePlotter::getActionZoomIn | ( | ) | const |
QAction which triggers zoom in.
| QAction * JKQTBasePlotter::getActionZoomOut | ( | ) | const |
QAction which triggers zoom out.
| double JKQTBasePlotter::getAspectRatio | ( | ) | const |
returns the data aspect ratio, enforced with setMaintainApsectRatio(true)
| QSet< JKQTPCoordinateAxisRef > JKQTBasePlotter::getAvailableXAxisRefs | ( | bool | includePrimary = false | ) | const |
returns the set of available x-axes (including the primary, if true is given as parameter)
| QSet< JKQTPCoordinateAxisRef > JKQTBasePlotter::getAvailableYAxisRefs | ( | bool | includePrimary = false | ) | const |
returns the set of available y-axes (including the primary, if true is given as parameter)
| QList< JKQTPCoordinateAxis * > JKQTBasePlotter::getAxes | ( | bool | includePrimaries = true | ) |
returns all available x- or y-axes
| QList< const JKQTPCoordinateAxis * > JKQTBasePlotter::getAxes | ( | bool | includePrimaries = true | ) | const |
returns all available x- or y-axes
| double JKQTBasePlotter::getAxisAspectRatio | ( | ) | const |
returns the axis aspect ratio, enforced with setMaintainAxisApsectRatio(true)
| QBrush JKQTBasePlotter::getBackgroundBrush | ( | ) | const |
color of the background of the plot (widget area) when drawing (to the screen)
| QColor JKQTBasePlotter::getBackgroundColor | ( | ) | const |
color of the background of the plot (widget area) when drawing (to the screen)
| QString JKQTBasePlotter::getCSVcommentInitializer | ( | ) | const |
set the string used to introduce comments in text output when exporting data
| QString JKQTBasePlotter::getCSVdecimalSeparator | ( | ) | const |
returns the decimal separator used when exporting data to text files
| QString JKQTBasePlotter::getCurrentFileFormat | ( | ) | const |
return the last file format to use in SaveAs ... dialogs
| const JKQTBasePlotterStyle & JKQTBasePlotter::getCurrentPlotterStyle | ( | ) | const |
current style properties for this JKQTBasePlotter
| QString JKQTBasePlotter::getCurrentSaveDirectory | ( | ) | const |
returns the current directory in which to open SaveAs ... dialogs
|
protected |
|
protectedslot |
internal function for getDataColumnsByUser()
|
protectedslot |
internal function for getDataColumnsByUser()
|
protectedslot |
internal function for getDataColumnsByUser()
|
protectedslot |
internal function for getDataColumnsByUser()
|
protectedslot |
internal function for getDataColumnsByUser()
|
inline |
returns a pointer to the datastore used by this object
|
inline |
returns a pointer to the datastore used by this object
| QColor JKQTBasePlotter::getDefaultTextColor | ( | ) | const |
default text color in the plot
| QString JKQTBasePlotter::getDefaultTextFontName | ( | ) | const |
default font name in the plot
| double JKQTBasePlotter::getDefaultTextSize | ( | ) | const |
default font size in the plot [pt]
| QBrush JKQTBasePlotter::getExportBackgroundBrush | ( | ) | const |
color of the background of the plot (widget area) when exporting
| QColor JKQTBasePlotter::getExportBackgroundColor | ( | ) | const |
color of the background of the plot (widget area) when exporting
| double JKQTBasePlotter::getFontSizeMultiplier | ( | ) | const |
multiplier for the font size
| double JKQTBasePlotter::getFontSizePrintMultiplier | ( | ) | const |
multiplier which is used for font sizes when the plot is exported/printed
| JKQTPPlotElement * JKQTBasePlotter::getGraph | ( | size_t | i | ) |
returns description of i'th graph
| const JKQTPPlotElement * JKQTBasePlotter::getGraph | ( | size_t | i | ) | const |
returns description of i'th graph
| size_t JKQTBasePlotter::getGraphCount | ( | ) | const |
returns the number of graphs
|
inline |
returns a list of all graphs
|
inline |
returns a const list of all graphs
| bool JKQTBasePlotter::getGraphsXMinMax | ( | double & | minx, |
| double & | maxx, | ||
| double & | smallestGreaterZero, | ||
| const PlotElementPreciate & | predicate = allPlotElements() ) |
get the maximum and minimum x-value over all graphs in the plot
| [out] | minx | smallest x value |
| [out] | maxx | largest x value |
| [out] | smallestGreaterZero | smallest data point which is >0 (needed for scaling of logarithmic axes) |
| predicate | a PlotElementPreciate, which can be used to limit the JKQTPPlotElement to be evaluated |
true if at least one matching graph was found and evaluated succcessfullyThe result is given in the two parameters which are call-by-reference parameters!
| bool JKQTBasePlotter::getGraphsYMinMax | ( | double & | miny, |
| double & | maxy, | ||
| double & | smallestGreaterZero, | ||
| const PlotElementPreciate & | predicate = allPlotElements() ) |
get the maximum and minimum y-value over all graphs in the plot
| [out] | miny | smallest y value |
| [out] | maxy | largest y value |
| [out] | smallestGreaterZero | smallest data point which is >0 (needed for scaling of logarithmic axes) |
| predicate | a PlotElementPreciate, which can be used to limit the JKQTPPlotElement to be evaluated |
true if at least one matching graph was found and evaluated succcessfullyThe result is given in the two parameters which are call-by-reference parameters!
| bool JKQTBasePlotter::getGridPrinting | ( | ) | const |
indicates whether the grid printing is activated
| size_t JKQTBasePlotter::getGridPrintingCurrentX | ( | ) | const |
x position of the current graph in grid printing
| size_t JKQTBasePlotter::getGridPrintingCurrentY | ( | ) | const |
y position of the current graph in grid printing
| int JKQTBasePlotter::getHeight | ( | ) |
gets the width of the plot widget
|
inline |
calculated value: free space between widget top border and plot top border, as used to plot the graph
|
inline |
calculated value: free space between widget top border and plot top border, as used to plot the graph
|
inline |
calculated value: free space between widget top border and plot top border, as used to plot the graph
|
inline |
calculated value: free space between widget top border and plot top border, as used to plot the graph
| JKQTPKeyPosition JKQTBasePlotter::getKeyPosition | ( | ) | const |
key position inside or besides the plot area, see JKQTPKeyPositions for details and examples
| double JKQTBasePlotter::getLineWidthMultiplier | ( | ) | const |
multiplier or the line widths
| double JKQTBasePlotter::getLineWidthPrintMultiplier | ( | ) | const |
multiplier which is used for linewidths when the plot is exported/printed
| AdditionalActionsMap JKQTBasePlotter::getLstAdditionalPlotterActions | ( | ) | const |
this list contains additional actions, that can be registered by registerAdditionalAction(). They are shown in the context menu only and are e.g. used to display "save image data" actions. Each action may be in a category (key of map), which is displayed as a submenu of the context-menu!
| JKQTPBaseKey * JKQTBasePlotter::getMainKey | ( | ) |
retuns the main key object
| const JKQTPBaseKey * JKQTBasePlotter::getMainKey | ( | ) | const |
retuns the main key object
|
protected |
retuns the JKQTPKeyStyle to be used for the main key (extracted from JKQTBasePlotterStyle::keyStyle)
| const JKQTPKeyStyle & JKQTBasePlotter::getMainKeyStyle | ( | ) | const |
retuns the JKQTPKeyStyle to be used for the main key (extracted from JKQTBasePlotterStyle::keyStyle)
| bool JKQTBasePlotter::getMasterSynchronizeHeight | ( | ) | const |
synchronize plot height with masterPlotterY
| bool JKQTBasePlotter::getMasterSynchronizeWidth | ( | ) | const |
synchronize plot width with masterPlotterX
| JKQTMathText * JKQTBasePlotter::getMathText | ( | ) |
returns the internal JKQTMathText, used to render text with LaTeX markup
| const JKQTMathText * JKQTBasePlotter::getMathText | ( | ) | const |
returns the internal JKQTMathText, used to render text with LaTeX markup
| int JKQTBasePlotter::getNextStyle | ( | ) |
gets the next unused style id, i.e. the smalles number >=0 which is not contained in usedStyles
|
protected |
this is an internal property that is used by the export/print system to control the "magnification". Usually this is 1.0 but if set !=1.0, it is used to scale the widgetWidth and widgetHeight before painting!
| QBrush JKQTBasePlotter::getPlotBackgroundBrush | ( | ) | const |
color of the plot's background (i.e. of the area within the coordinate axes rectangle)
| QColor JKQTBasePlotter::getPlotBackgroundColor | ( | ) | const |
color of the plot's background (i.e. of the area within the coordinate axes rectangle)
| int JKQTBasePlotter::getPlotBorderBottom | ( | ) | const |
free space between widget bottom border and plot bottom border, this property may be set by the user and is possibly altered by the key positioning algorithm. The altered value is written to internalPlotBorderBottom
| int JKQTBasePlotter::getPlotBorderLeft | ( | ) | const |
free space between widget left border and plot left border, this property may be set by the user and is possibly altered by the key positioning algorithm. The altered value is written to internalPlotBorderLeft
| int JKQTBasePlotter::getPlotBorderRight | ( | ) | const |
free space between widget right border and plot right border, this property may be set by the user and is possibly altered by the key positioning algorithm. The altered value is written to internalPlotBorderRight
| int JKQTBasePlotter::getPlotBorderTop | ( | ) | const |
free space between widget top border and plot top border, this property may be set by the user and is possibly altered by the key positioning algorithm. The altered value is written to internalPlotBorderTop
| QColor JKQTBasePlotter::getPlotFrameColor | ( | ) | const |
if plotFrameVisible==true, JKQTBasePlotter will draw a rectangle/frame around the plot in this color
| double JKQTBasePlotter::getPlotFrameRounding | ( | ) | const |
if plotFrameVisible==true, JKQTBasePlotter will draw a rectangle/frame around the plot, rounding the corners with this redius (<=0 -> no rounded rectangle) [pt]
| double JKQTBasePlotter::getPlotFrameWidth | ( | ) | const |
if plotFrameVisible==true, JKQTBasePlotter will draw a rectangle/frame around the plot in this width [pt]
|
inline |
calculated value: plot height in pixel inside the widget (calculated by calcPlotScaling() from plotBorderTop, plotBorderBottom and widgetHeight)
| QString JKQTBasePlotter::getPlotLabel | ( | ) | const |
the plot label text
| QColor JKQTBasePlotter::getPlotLabelColor | ( | ) | const |
the plot label color
| QString JKQTBasePlotter::getplotLabelFontName | ( | ) | const |
the plot label font name
| double JKQTBasePlotter::getPlotLabelFontSize | ( | ) | const |
the plot label font size [pt]
| double JKQTBasePlotter::getPlotLabelOffset | ( | ) | const |
offset of the plot label from the next element of the graph, i.e. below the label [pt].
| double JKQTBasePlotter::getPlotLabelTopBorder | ( | ) | const |
offset of the plot label from the top [pt].
|
inline |
returns model representing all Plots in this plotter and showing their visible/invisible state
|
inline |
returns model representing all Plots in this plotter and showing their visible/invisible state
| JKQTPPen JKQTBasePlotter::getPlotStyle | ( | int | i, |
| JKQTPPlotStyleType | type = JKQTPPlotStyleType::Default ) const |
returns a QPen object for the i-th plot style
|
inline |
calculated value: plot width in pixel inside the widget (calculated by calcPlotScaling() from plotBorderLeft, plotBorderRight and widgetWidth)
|
protected |
| bool JKQTBasePlotter::getShowKey | ( | ) | const |
indicates whether to plot a key
| JKQTMathTextNodeSize JKQTBasePlotter::getTextSizeDetail | ( | const QFont & | fm, |
| const QString & | text, | ||
| QPainter & | painter ) |
calculates a JKQTMathTextNodeSize for the given string text if it would be drawn on painter with font fm
| void JKQTBasePlotter::getTextSizeDetail | ( | const QFont & | fm, |
| const QString & | text, | ||
| QPainter & | painter, | ||
| double & | width, | ||
| double & | ascent, | ||
| double & | descent, | ||
| double & | strikeoutPos ) |
calculates a text-size details for the given string text if it would be drawn on painter with font fm
| JKQTMathTextNodeSize JKQTBasePlotter::getTextSizeDetail | ( | const QString & | fontName, |
| double | fontSize, | ||
| const QString & | text, | ||
| QPainter & | painter ) |
calculates a JKQTMathTextNodeSize for the given string text if it would be drawn on painter with font fontName
| void JKQTBasePlotter::getTextSizeDetail | ( | const QString & | fontName, |
| double | fontSize, | ||
| const QString & | text, | ||
| QPainter & | painter, | ||
| double & | width, | ||
| double & | ascent, | ||
| double & | descent, | ||
| double & | strikeoutPos ) |
calculates a text-size details for the given string text if it would be drawn on painter with font fontName and font size fontSize
| QSizeF JKQTBasePlotter::getTextSizeSize | ( | const QFont & | fm, |
| const QString & | text, | ||
| QPainter & | painter ) |
calculates a size of the given string text if it would be drawn on painter with font fm
| QSizeF JKQTBasePlotter::getTextSizeSize | ( | const QString & | fontName, |
| double | fontSize, | ||
| const QString & | text, | ||
| QPainter & | painter ) |
calculates a size of the given string text if it would be drawn on painter with font fontName and font size fontSize
|
slot |
return the filename, used by loadUserSettings() and saveUserSettings()
|
slot |
return the prefix, used by loadUserSettings() and saveUserSettings()
| int JKQTBasePlotter::getWidth | ( | ) |
gets the width of the plot widget
| QMap< JKQTPCoordinateAxisRef, JKQTPHorizontalAxisBase * > JKQTBasePlotter::getXAxes | ( | bool | includePrimary = true | ) |
returns all available x-axes
| JKQTPHorizontalAxisBase * JKQTBasePlotter::getXAxis | ( | JKQTPCoordinateAxisRef | axis = JKQTPPrimaryAxis | ) |
returns the x-axis objet of the plot
| const JKQTPHorizontalAxisBase * JKQTBasePlotter::getXAxis | ( | JKQTPCoordinateAxisRef | axis = JKQTPPrimaryAxis | ) | const |
returns the x-axis objet of the plot
| double JKQTBasePlotter::getXMax | ( | ) | const |
returns the current x-axis max of the primary x-axis
| double JKQTBasePlotter::getXMin | ( | ) | const |
returns the current x-axis min of the primary x-axis
| QMap< JKQTPCoordinateAxisRef, JKQTPVerticalAxisBase * > JKQTBasePlotter::getYAxes | ( | bool | includePrimary = true | ) |
returns all available y-axes
| JKQTPVerticalAxisBase * JKQTBasePlotter::getYAxis | ( | JKQTPCoordinateAxisRef | axis = JKQTPPrimaryAxis | ) |
returns the y-axis objet of the plot
| const JKQTPVerticalAxisBase * JKQTBasePlotter::getYAxis | ( | JKQTPCoordinateAxisRef | axis = JKQTPPrimaryAxis | ) | const |
returns the y-axis objet of the plot
| double JKQTBasePlotter::getYMax | ( | ) | const |
returns the current y-axis max of the primary y-axis
| double JKQTBasePlotter::getYMin | ( | ) | const |
returns the current y-axis min of the primary y-axis
|
slot |
returns a rendering of the current plot as a QImage (pixel image) with the given size
|
protected |
simply calls paintPlot() if grid printing mode is deactivated and prints the graph grid otherwise pageRect is used to determine the size of the page to draw on. If this does not coincide with the widget extents this function calculates a scaling factor so the graphs fit onto the page. This is especially usefull when printing!
| painter | JKQTPEnhancedPainter to draw on |
| pageRect | size of the page |
| scaleIfTooLarge | scale image if it is too large for pageRect |
| scaleIfTooSmall | scale image if it is smaller than pageRect |
|
protected |
This method goes through all registered plotters and calculates the width of every column and height of every row as the max over the row/column. The reults are stored in the private datamembers gridPrintingRows and gridPrintingColumns. gridPrintingSize will contain the size of all graphs together afterwards.
| bool JKQTBasePlotter::hasXAxis | ( | JKQTPCoordinateAxisRef | axis = JKQTPPrimaryAxis | ) | const |
returns whether an x-axis axis is registered with the plotter
==JKQTPPrimaryAxis this function returns always true | bool JKQTBasePlotter::hasYAxis | ( | JKQTPCoordinateAxisRef | axis = JKQTPPrimaryAxis | ) | const |
returns whether a y-axis axis is registered with the plotter
==JKQTPPrimaryAxis this function returns always true | int JKQTBasePlotter::indexOfGraph | ( | const JKQTPPlotElement * | gr | ) | const |
returns the index of the given graph gr in the graphs list, or -1 if it was not found
|
protected |
set the standard settings (colors, line widths ...)
| bool JKQTBasePlotter::isDebugShowRegionBoxesEnabled | ( | ) | const |
if set true (default: false ) the JKQTBasePlotter draws colored rectangles to indicate the different regions in the plot (border, axes, ...)
| bool JKQTBasePlotter::isDebugShowTextBoxesEnabled | ( | ) | const |
if set true (default: false ) the JKQTBasePlotter draws colored rectangles to indicate the extent of text
| bool JKQTBasePlotter::isEmittingPlotSignalsEnabled | ( | ) | const |
returns, whether the signals plotUpdated() are emitted
| bool JKQTBasePlotter::isEmittingSignalsEnabled | ( | ) | const |
returns whether this class emits signals, like zoomChangedLocally() or beforePlotScalingRecaluclate()
| bool JKQTBasePlotter::isPlotFrameVisible | ( | ) | const |
if true, JKQTBasePlotter will draw a rectangle/frame around the plot
| bool JKQTBasePlotter::isUsingAntiAliasingForGraphs | ( | ) | const |
specifies whether to use antialiasing for plotting the graphs
false to increase plotting speed of complex plots (with many graphs inside). You can reach a roughly three-fold speed improvement! | bool JKQTBasePlotter::isUsingAntiAliasingForSystem | ( | ) | const |
specifies whether to use antialiasing for plotting the coordinate system
| bool JKQTBasePlotter::isUsingAntiAliasingForText | ( | ) | const |
specifies whether to use antialiasing when drawing any text
false to increase plotting speed of complex plots (with many graphs inside). You can reach a roughly three-fold speed improvement! | void JKQTBasePlotter::loadCurrentPlotterStyle | ( | const QSettings & | settings, |
| const QString & | group = "plots/" ) |
replace the current style properties for this JKQTBasePlotter with properties loaded from settings
| settings | the QSettings object to read from |
| group | group in settings to read from |
| void JKQTBasePlotter::loadSettings | ( | const QSettings & | settings, |
| const QString & | group = QString("plots/") ) |
loads all the plot properties from a <a href="http://doc.qt.io/qt-5/qsettings.html")">QSettings object
|
slot |
loads the plot user properties from the file sepcified by setUserSettigsFilename() and the prefix specified by setUserSettigsPrefix()
| void JKQTBasePlotter::loadUserSettings | ( | const QSettings & | settings, |
| const QString & | group = QString("plots_user/") ) |
loads the plot user properties from a <a href="http://doc.qt.io/qt-5/qsettings.html")">QSettings object
|
inline |
returns the given size in millimeters to pixels (with given dots per inch)
|
inline |
returns the given size in millimeters to pixels (with given dots per inch)
|
inline |
returns the given size in millimeters to pixels (with given dots per inch)
| void JKQTBasePlotter::modifyGraphs | ( | const std::function< void(JKQTPPlotElement *)> & | func | ) |
apply functor func to all graphs in the plotter. After completing the operation, the graph is updated
| void JKQTBasePlotter::moveGraphBottom | ( | const JKQTPPlotElement * | gr | ) |
move the given graph gr to the bottom of all graphs
| void JKQTBasePlotter::moveGraphBottom | ( | int | idx | ) |
move the given graph to the top
| void JKQTBasePlotter::moveGraphDown | ( | const JKQTPPlotElement * | gr | ) |
move the given graph gr one item down (i.e. it is drawn earlier/lower in the z-stack)
| void JKQTBasePlotter::moveGraphDown | ( | int | idx | ) |
move the graph at position idx one item down (i.e. it is drawn earlier/lower in the z-stack)
| void JKQTBasePlotter::moveGraphTop | ( | const JKQTPPlotElement * | gr | ) |
move the given graph gr to the end of all graphs, so it is drawn
| void JKQTBasePlotter::moveGraphTop | ( | int | idx | ) |
move the given graph to the top
| void JKQTBasePlotter::moveGraphUp | ( | const JKQTPPlotElement * | gr | ) |
move the given graph gr one item up (i.e. it is drawn later/higher in the z-stack)
| void JKQTBasePlotter::moveGraphUp | ( | int | idx | ) |
move the graph at position idx one item up (i.e. it is drawn later/higher in the z-stack)
|
inline |
return x coordinate from x-pixel, using the primary axis
|
inline |
return y coordinate from y-pixel, using the primary axis
|
signal |
emitted when the plot scaling had to be recalculated
|
signal |
emitted when the plot has to be updated
|
slot |
print the current plot, if printer is nullptr a printer selection dialog is displayed
|
protected |
show the print preview window for a given print p
|
protectedslot |
internal function for print preview
|
protectedslot |
internal function for print preview
|
protectedslot |
internal function for print preview
|
protectedslot |
internal function for print preview
|
protectedslot |
internal function for print preview
|
protectedslot |
internal function for print preview
|
protectedslot |
internal function for print preview
|
protectedslot |
internal function for print preview
|
protectedslot |
internal function for print preview
|
protectedslot |
internal function for print preview
|
protectedslot |
internal function for print preview
|
protectedslot |
internal function for print preview
|
protectedslot |
internal function for print preview
|
protectedslot |
internal function for print preview
|
protectedslot |
internal function for print preview
|
protectedslot |
internal function for print preview
|
protected |
copy sub-properties of plotterStyle to sub-objects that require it (axes, axes in graphs ...) and emit a plot update
|
inline |
returns the given size in DTP points points (1/72inch = 0.353mm) to pixels (with given dots per inch)
|
inline |
returns the given size in DTP points points (1/72inch = 0.353mm) to pixels (with given dots per inch)
|
inline |
returns the given size in DTP points points (1/72inch = 0.353mm) to pixels (with given dots per inch)
|
inline |
emit plotUpdated(), which can be used by e.g. a widget class to update the displayed plot
| void JKQTBasePlotter::registerAdditionalAction | ( | const QString & | key, |
| QAction * | act ) |
this function registers additional actions to lstAdditionalPlotterActions, which are displayed in the context-menu
|
static |
register a user-defined QPaintDevice (with factory JKQTPPaintDeviceAdapter) as a plugin to JKQTBasePlotter/JKQTPlotter, which will use it to export graphics
|
static |
register a JKQTPSaveDataAdapter with JKQTPlotter/JKQTBasePlotter that can be used to export data from the internal datastore into a file
| void JKQTBasePlotter::resetMasterSynchronization | ( | SynchronizationDirection | synchronizeDirection = sdXYAxes | ) |
switches any synchronization off, that has been created by synchronizeToMaster()
| void JKQTBasePlotter::saveAsCSV | ( | const QString & | filename, |
| const QString & | decimalSeparator, | ||
| const QString & | commentInitializer ) |
save the current plot data as a Comma Separated Values (CSV) file
| filename | the file to save to, if filename is empty, a file open dialog will be shown |
| decimalSeparator | decimal separator for outpu |
| commentInitializer | line-start for comment lines |
example output:
This method uses JKQTBasePlotterStyle::CSVdecimalSeparator as decimal separator and JKQTBasePlotterStyle::CSVcommentInitializer as comment initializer!
|
slot |
save the current plot data as a Comma Separated Values (CSV) file
| filename | the file to save to, if filename is empty, a file open dialog will be shown |
This method uses JKQTBasePlotterStyle::CSVdecimalSeparator as decimal separator and JKQTBasePlotterStyle::CSVcommentInitializer as comment initializer!
|
slot |
save the current plot data as a Data Interchange Format file (see https://en.wikipedia.org/wiki/Data_Interchange_Format).
| filename | the file to save to, if filename is empty, a file open dialog will be shown |
|
slot |
save the current plot data as a Semicolon Separated Values (CSV) file for german Excel, i.e. with comma as decimal separator
| filename | the file to save to, if filename is empty, a file open dialog will be shown |
example output:
|
slot |
save the current plot data as a Matlab Script
| filename | the file to save to, if filename is empty, a file open dialog will be shown |
example output:
|
slot |
save the current plot as a PDF file, with the current widget aspect ratio, if filename is empty a file selection dialog is displayed
| filename | the filename to save to, if empty a file save dialog is displayed |
| displayPreview | if true, a save/print-preview dialog is displayed that allows to make some modifications to the generated image, otherwise the image is saved with default settings. |
true if the file was save successfully
|
slot |
save the current plot as a pixel image image (PNG ...), if filename is empty a file selection dialog is displayed
| filename | name of the stored file, if no outputFormat is given, the file format is deduced by the file extension in filename |
| displayPreview | if true a dialog is shown that allows to modify the generated output (zoo, scaling, ...) |
| outputFormat | specify the file format for the generated file |
| outputSizeIncrease | if given, the size of the generated pixel image is increased by this number of pixels in addition to the required space |
true on successThis function may generate any pixel-graphics format, supported by Qt and listed in QImageWriter::supportedImageFormats(). The parameters are comparable to the standard Qt functions like QImage::save(), which is also used internally.
| void JKQTBasePlotter::saveAsSemicolonSV | ( | const QString & | filename, |
| const QString & | decimalSeparator, | ||
| const QString & | commentInitializer ) |
save the current plot data as a Semicolon Separated Values (SSV) file
| filename | the file to save to, if filename is empty, a file open dialog will be shown |
| decimalSeparator | decimal separator for outpu |
| commentInitializer | line-start for comment lines |
example output for saveAsSemicolonSV(filename, ",","#"):
|
slot |
save the current plot data as a Semicolon Separated Values (SSV) file
| filename | the file to save to, if filename is empty, a file open dialog will be shown |
example output:
This method uses JKQTBasePlotterStyle::CSVdecimalSeparator as decimal separator and JKQTBasePlotterStyle::CSVcommentInitializer as comment initializer!
|
slot |
save the current plot as a SVG file, with the current widget aspect ratio, if filename is empty a file selection dialog is displayed
| filename | the filename to save to, if empty a file save dialog is displayed |
| displayPreview | if true, a save/print-preview dialog is displayed that allows to make some modifications to the generated image, otherwise the image is saved with default settings. |
true if the file was save successfully
|
slot |
save the current plot data as a SYmbolik LinK (SYLK) spreadsheet file (see https://en.wikipedia.org/wiki/Symbolic_Link_(SYLK) )
| filename | the file to save to, if filename is empty, a file open dialog will be shown |
| void JKQTBasePlotter::saveAsTabSV | ( | const QString & | filename, |
| const QString & | decimalSeparator, | ||
| const QString & | commentInitializer ) |
save the current plot data as a Tabulator Separated Values (CSV) file
| filename | the file to save to, if filename is empty, a file open dialog will be shown |
| decimalSeparator | decimal separator for outpu |
| commentInitializer | line-start for comment lines |
example output for saveAsTabSV(filename, ",","#"):
|
slot |
save the current plot data as a Tabulator Separated Values (CSV) file
| filename | the file to save to, if filename is empty, a file open dialog will be shown |
example output:
This method uses JKQTBasePlotterStyle::CSVdecimalSeparator as decimal separator and JKQTBasePlotterStyle::CSVcommentInitializer as comment initializer!
| void JKQTBasePlotter::saveCurrentPlotterStyle | ( | QSettings & | settings, |
| const QString & | group = "plots/" ) const |
store the current style properties for this JKQTBasePlotter with properties loaded from settings
| settings | the QSettings object to write to |
| group | group in settings to write to |
|
slot |
save the data used for the current plot. The file format is extracted from the file extension (csv, ...)
| filename | the filename to save to, if empty a file save dialog is displayed |
| format | The parameter format specifies the export format. if it is empty the format will be choosen according to the file extension, or if filename is also empty the format will be choosen according to what is selected in the file selection dialog. See below for a listing of supported values. |
true if the data was exported successfully.These values are supported for format (if format is not provided, the function tries to guess it from the file extensions liste below):
"csv", Comma Separated Values, dot as decimal separator (see also https://en.wikipedia.org/wiki/Comma-separated_values, extensions: *.csv , *.dat , see JKQTBasePlotter::saveAsCSV()"tab" Tab Separated Values, dot as decimal separator, extensions: *.txt , see JKQTBasePlotter::saveAsTabSV()"sem" or "ssv", Semicolon Separated Values, dot as decimal separator, extensions: *.sem , *.ssv , see JKQTBasePlotter::saveAsSemicolonSV()"gex", Semicolon Separated Values for German Excel, i.e. comma as decimal separator, extensions: *.gex , see JKQTBasePlotter::saveAsGerExcelCSV()"slk" or "sylk" , SYmbolik LinK (SYLK) spreadsheet (see https://en.wikipedia.org/wiki/Symbolic_Link_(SYLK) ), extensions: *.slk , *.sylk , see JKQTBasePlotter::saveAsSYLK()"dif", Data Interchange Format (see https://en.wikipedia.org/wiki/Data_Interchange_Format), extensions: *.dif , see JKQTBasePlotter::saveAsDIF()"m", Matlab Script, extensions: *.m , see JKQTBasePlotter::saveAsMatlab()In addition you can use the custom exporters implemented as JKQTPSaveDataAdapter and registered using JKQTBasePlotter::registerSaveDataAdapter(). For these you need to use format = "customN", where N is the index of the exporter in the list of registered exporters.
|
slot |
save the current plot as an image file, with the current widget aspect ratio, if filename is empty a file selection dialog is displayed. The image format is extracted from the file extension (jpeg, tiff, png, pdf, ...)
| filename | the filename to save to, if empty a file save dialog is displayed |
| displayPreview | if true, a save/print-preview dialog is displayed that allows to make some modifications to the generated image, otherwise the image is saved with default settings. |
true if the file was save successfullyThis function is comparable to saveAsPixelImage(), but it allows to save into any graphics format, including SVG and PF (if printer-support is compiled into the library). Also it may use the custom exporters implemented as JKQTPPaintDeviceAdapter and registered via JKQTBasePlotter::registerPaintDeviceAdapter().
| void JKQTBasePlotter::saveSettings | ( | QSettings & | settings, |
| const QString & | group = QString("plots/") ) const |
saves the plot properties into a <a href="http://doc.qt.io/qt-5/qsettings.html")">QSettings object.
This method only saves those properties that differ from their default value.
|
slot |
saves the plot user properties to the file sepcified by setUserSettigsFilename() and the prefix specified by setUserSettigsPrefix()
| void JKQTBasePlotter::saveUserSettings | ( | QSettings & | settings, |
| const QString & | group = QString("plots_user/") ) const |
saves the plot user properties into a <a href="http://doc.qt.io/qt-5/qsettings.html")">QSettings object.
|
slot |
sets absolutely limiting x-range of the plot
The user (or programmer) cannot zoom to a viewport that is larger than the range given to this function. This is implemented by calling JKQTPCoordinateAxis::setAbsoluteRange() for the major x-axes!
| xminn | absolute minimum of x-axis |
| xmaxx | absolute maximum of x-axis |
|
slot |
sets absolutely limiting x- and y-range of the plot
The user (or programmer) cannot zoom to a viewport that is larger than the range given to this function. This is implemented by calling JKQTPCoordinateAxis::setAbsoluteRange() for the major axes!
| xminn | absolute minimum of x-axis |
| xmaxx | absolute maximum of x-axis |
| yminn | absolute minimum of y-axis |
| ymaxx | absolute maximum of y-axis |
|
slot |
sets absolute minimum and maximum y-value to plot
The user (or programmer) cannot zoom to a viewport that is larger than the range given to this function. This is implemented by calling JKQTPCoordinateAxis::setAbsoluteRange() for the major y-axes!
| yminn | absolute minimum of y-axis |
| ymaxx | absolute maximum of y-axis |
|
slot |
set all graphs in the plotter invisible
|
slot |
set all graphs in the plotter visible
|
slot |
sets the data aspect ratio, enforced with setMaintainApsectRatio(true)
|
slot |
sets the axis aspect ratio, enforced with setMaintainAxisApsectRatio(true)
|
slot |
color of the background of the plot (widget area) when drawing (to the screen)
|
slot |
color of the background of the plot (widget area) when drawing (to the screen)
|
slot |
color of the background of the plot (widget area) when drawing (to the screen)
|
slot |
color of the background of the plot (widget area) when drawing (to the screen)
|
slot |
color of the background of the plot (widget area) when drawing (to the screen)
|
slot |
set the string used to introduce comments in text output when exporting data
|
slot |
set the decimal separator used when exporting data to text files
|
slot |
set the file format to use in SaveAs ... dialogs
| void JKQTBasePlotter::setCurrentPlotterStyle | ( | const JKQTBasePlotterStyle & | style | ) |
replace the current style properties for this JKQTBasePlotter
|
slot |
sets the current directory in which to open SaveAs ... dialogs
|
static |
set a global preset/default value for the userSettigsFilename and userSettigsPrefix properties of JKQTBasePlotter
These presets are application global and will be used ONLY on initialization of a JKQTBasePlotter. You can overwrite them on a local-basis for each JKQTBasePrinter separately. The changed values from this function call will only take effect for newly created plotters AFTER the function call!
|
slot |
default text color in the plot
|
slot |
default font name in the plot
|
slot |
default font size in the plot [pt]
| void JKQTBasePlotter::setEmittingPlotSignalsEnabled | ( | bool | __value | ) |
controls, whether the signals plotUpdated() are emitted
| void JKQTBasePlotter::setEmittingSignalsEnabled | ( | bool | enabled | ) |
specifies whether this class emits signals, like zoomChangedLocally() or beforePlotScalingRecaluclate()
|
slot |
color of the background of the plot (widget area) when exporting
|
slot |
color of the background of the plot (widget area) when exporting
|
slot |
color of the background of the plot (widget area) when exporting
|
slot |
color of the background of the plot (widget area) when exporting
|
slot |
color of the background of the plot (widget area) when exporting
|
protected |
multiplier for the font size
| void JKQTBasePlotter::setFontSizePrintMultiplier | ( | double | __value | ) |
multiplier which is used for font sizes when the plot is exported/printed
|
slot |
switch visibility of the i -th graph to visible
|
slot |
switch visibility of the i -th graph to visible
|
slot |
sets whether the major grid lines of the major axes are shown
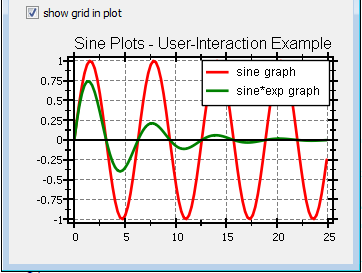
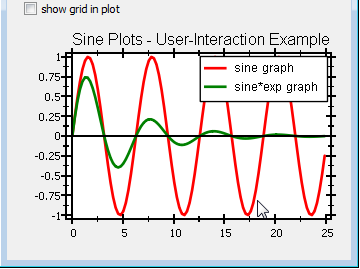
|
slot |
sets the color of all major grid lines (of the major x- and y-axis)
| void JKQTBasePlotter::setGridPrinting | ( | bool | __value | ) |
indicates whether the grid printing is activated
| void JKQTBasePlotter::setGridPrintingCurrentPos | ( | size_t | x, |
| size_t | y ) |
set the x- and y-positions of this JKQTPlotter in the grid-printing grid
| void JKQTBasePlotter::setGridPrintingCurrentX | ( | size_t | __value | ) |
x position of the current graph in grid printing
| void JKQTBasePlotter::setGridPrintingCurrentY | ( | size_t | __value | ) |
y position of the current graph in grid printing
|
slot |
sets the style of all Major grid lines
|
slot |
sets the width of all Major grid lines
|
slot |
key position inside or besides the plot area, see JKQTPKeyPositions for details and examples
|
protected |
multiplier or the line widths
| void JKQTBasePlotter::setLineWidthPrintMultiplier | ( | double | __value | ) |
multiplier which is used for linewidths when the plot is exported/printed
|
slot |
en-/disables the maintaining of the data aspect ratio
|
slot |
en-/disables the maintaining of the axis aspect ratio
|
slot |
sets the color of all minor grid lines (of the major x- and y-axis)
|
slot |
sets the style of all minor grid lines
|
slot |
sets the width of all minor grid lines
|
slot |
set all graphs invisible, except i
|
slot |
set all graphs invisible, except graph start, start+n, start+2*n, ...
|
protected |
this is an internal property that is used by the export/print system to control the "magnification". Usually this is 1.0 but if set !=1.0, it is used to scale the widgetWidth and widgetHeight before painting!
|
slot |
color of the plot's background (i.e. of the area within the coordinate axes rectangle)
|
slot |
color of the plot's background (i.e. of the area within the coordinate axes rectangle)
|
slot |
color of the plot's background (i.e. of the area within the coordinate axes rectangle)
|
slot |
color of the plot's background (i.e. of the area within the coordinate axes rectangle)
|
slot |
color of the plot's background (i.e. of the area within the coordinate axes rectangle)
|
slot |
|
slot |
|
slot |
|
slot |
|
slot |
|
slot |
if plotFrameVisible==true, JKQTBasePlotter will draw a rectangle/frame around the plot in this color
|
slot |
if plotFrameVisible==true, JKQTBasePlotter will draw a rectangle/frame around the plot, rounding the corners with this redius (<=0 -> no rounded rectangle) [pt]
|
slot |
if true, JKQTBasePlotter will draw a rectangle/frame around the plot
|
slot |
if plotFrameVisible==true, JKQTBasePlotter will draw a rectangle/frame around the plot in this width [pt]
|
slot |
set the plot label text
|
slot |
the plot label color
|
slot |
the plot label font name
|
slot |
the plot label font size [pt]
|
slot |
offset of the plot label from the next element of the graph, i.e. below the label [pt].
|
slot |
offset of the plot label from the top [pt].
|
protected |
|
slot |
indicates whether to plot a key
|
slot |
switches the visibility of the zero-axes associated with the major x- and y-axis
| showX | indicates whether to show the zero-axis associated with the x-axis (i.e. x==0 or the vertical zero-axis) |
| showY | indicates whether to show the zero-axis associated with the y-axis (i.e. y==0 or the horizontal zero-axis) |
|
slot |
switches the visibility of the zero-axes associated with the major x- and y-axis
| showXY | indicates whether to show the zero-axis associated with the x- |
|
slot |
specifies whether to use antialiasing for plotting the graphs
false to increase plotting speed of complex plots (with many graphs inside). You can reach a roughly three-fold speed improvement!
|
slot |
specifies whether to use antialiasing for plotting the coordinate system
|
slot |
specifies whether to use antialiasing when drawing any text
false to increase plotting speed of complex plots (with many graphs inside). You can reach a roughly three-fold speed improvement!
|
slot |
set filename, used by loadUserSettings() and saveUserSettings()
|
slot |
set filename and prefix, used by loadUserSettings() and saveUserSettings()
|
slot |
set prefix, used by loadUserSettings() and saveUserSettings()
|
slot |
|
slot |
|
slot |
|
slot |
|
slot |
sets the x-range of the plot (minimum and maximum x-value on the x-axis)
| xminn | absolute minimum of x-axis |
| xmaxx | absolute maximum of x-axis |
| affectsSecondaryAxes | if true, the secondary axes are affectedtoo, by using a relative zooming scheme, i.e. if a major axis range shrinks by 50%, also the secondary ranges shrink by 50% [default: false] |
Uppon setting, this function emits the signal zoomChangedLocally(), if emitting signals is activated at the moment (e.g. using setEmittingSignalsEnabled() ).
|
slot |
sets the x- and y-range of the plot (minimum and maximum values on the x-/y-axis)
| xminn | absolute minimum of x-axis |
| xmaxx | absolute maximum of x-axis |
| yminn | absolute minimum of y-axis |
| ymaxx | absolute maximum of y-axis |
| affectsSecondaryAxes | if true, the secondary axes are affectedtoo, by using a relative zooming scheme, i.e. if a major axis range shrinks by 50%, also the secondary ranges shrink by 50% [default: false] |
Uppon setting, this function emits the signal zoomChangedLocally(), if emitting signals is activated at the moment (e.g. using setEmittingSignalsEnabled() ).
|
slot |
sets the y-range of the plot (minimum and maximum y-value on the y-axis)
| yminn | absolute minimum of y-axis |
| ymaxx | absolute maximum of y-axis |
| affectsSecondaryAxes | if true, the secondary axes are affectedtoo, by using a relative zooming scheme, i.e. if a major axis range shrinks by 50%, also the secondary ranges shrink by 50% [default: false] |
Uppon setting, this function emits the signal zoomChangedLocally(), if emitting signals is activated at the moment (e.g. using setEmittingSignalsEnabled() ).
|
protectedslot |
internal function for getDataColumnsByUser()
| void JKQTBasePlotter::sortGraphs | ( | const std::function< bool(const JKQTPPlotElement *, const JKQTPPlotElement *)> & | compareLess | ) |
sort the graphs, using functor compareLess to find whether a first graph shall be before (i.e. less) than a second graph. After completing the operation, the graph is updated
| void JKQTBasePlotter::synchronizeToMaster | ( | JKQTBasePlotter * | master, |
| SynchronizationDirection | synchronizeDirection, | ||
| bool | synchronizeAxisLength = true, | ||
| bool | synchronizeZoomingMasterToSlave = true, | ||
| bool | synchronizeZoomingSlaveToMaster = true ) |
synchronize the plot borders (and zooming) with a given plotter (master --> slave/this)
This function allows two plotters to draw a graph with exactly the same height or width as in another graph. For example if you want to have two plotters which are positioned one above the other (and have the same widget widths, which could be guaranteed by a QLayout) you may want to make sure that their plotWidth s are always the same. In this case call
of the lower plotter plotter2 . Now whenever the size of plotter1 changes, also plotter2 is redrawn with the changed borders.
| master | the plotter widget to synchronize to |
| synchronizeDirection | direction in which to synchronize |
| synchronizeAxisLength | do you want the axis length to be synchronized? |
| synchronizeZoomingMasterToSlave | if set, also zooming in the master leads to a modification of the linked axes in the slave |
| synchronizeZoomingSlaveToMaster | if set, also zooming in the slave leads to a modification of the linked axes in the master |
|
protectedslot |
may be connected to zoomChangedLocally() of a different plot and synchronizes the local x-axis to the other x-axis
| void JKQTBasePlotter::synchronizeXToMaster | ( | JKQTBasePlotter * | master, |
| bool | synchronizeAxisLength = true, | ||
| bool | synchronizeZoomingMasterToSlave = true, | ||
| bool | synchronizeZoomingSlaveToMaster = true ) |
synchronize the plot x-axis width (and x-zooming) with a given master plotter (master --> slave/this)
| master | the plotter widget to synchronize to |
| synchronizeAxisLength | do you want the axis length to be synchronized? |
| synchronizeZoomingMasterToSlave | if set, also zooming in the master leads to a modification of the linked axes in the slave |
| synchronizeZoomingSlaveToMaster | if set, also zooming in the slave leads to a modification of the linked axes in the master |
synchronizeDirection=csXAxis
|
protectedslot |
may be connected to zoomChangedLocally() of a different plot and synchronizes the local x- and y-axis to the other x- and y-axis
|
protectedslot |
may be connected to zoomChangedLocally() of a different plot and synchronizes the local y-axis to the other y-axis
| void JKQTBasePlotter::synchronizeYToMaster | ( | JKQTBasePlotter * | master, |
| bool | synchronizeAxisLength = true, | ||
| bool | synchronizeZoomingMasterToSlave = true, | ||
| bool | synchronizeZoomingSlaveToMaster = true ) |
synchronize the plot y-axis height (and y-zooming) with a given master plotter (master --> slave/this)
| master | the plotter widget to synchronize to |
| synchronizeAxisLength | do you want the axis length to be synchronized? |
| synchronizeZoomingMasterToSlave | if set, also zooming in the master leads to a modification of the linked axes in the slave |
| synchronizeZoomingSlaveToMaster | if set, also zooming in the slave leads to a modification of the linked axes in the master |
synchronizeDirection=csXAxis
|
protectedslot |
internal function for print/export preview
| void JKQTBasePlotter::updateSecondaryAxes | ( | ) |
updates the secondary axes
The plot may contain (in addition to its primary axes) also secondary axes, that depend in their scaling (min,max, ...) on the primmary axes of the plot. This function updates/recalculates the scaling of these axes.
| void JKQTBasePlotter::useAsInternalDatastore | ( | JKQTPDatastore * | newStore | ) |
tells the plotter object to use the given external datastore and treat it as an internal one (i.e. free it when the plotter object ist destroyed.
| void JKQTBasePlotter::useExternalDatastore | ( | JKQTPDatastore * | newStore | ) |
tells the plotter object to use the given external datastore.
If the current datastore is internally managed, this method will free that object and use the supplied datastore with external management. If the current datastore is already external, this method will simply replace it by the new one.
| void JKQTBasePlotter::useInternalDatastore | ( | ) |
tells the plotter object to use an internal datastore. A new internal datastore object is generated only if the current datastore is not internal.
|
inline |
return x-pixel coordinate from x coordinate, using the primary axis
|
inline |
return y-pixel coordinate from y coordinate, using the primary axis
|
inlineslot |
sets the x- and y-range of the plot (minimum and maximum values on the x-/y-axis)
| xminn | absolute minimum of x-axis |
| xmaxx | absolute maximum of x-axis |
| yminn | absolute minimum of y-axis |
| ymaxx | absolute maximum of y-axis |
| affectsSecondaryAxes | if true, the secondary axes are affectedtoo, by using a relative zooming scheme, i.e. if a major axis range shrinks by 50%, also the secondary ranges shrink by 50% [default: false] |
Uppon setting, this function emits the signal zoomChangedLocally(), if emitting signals is activated at the moment (e.g. using setEmittingSignalsEnabled() ).
|
signal |
signal: emitted whenever the user selects a new x-y zoom range (in the major axes, e.g. setX(), setY(), setXY(), zoomToFit()... )
| newxmin | start of the selected x-range (in plot coordinates) |
| newxmax | end of the selected x-range (in plot coordinates) |
| newymin | start of the selected x-range (in plot coordinates) |
| newymax | end of the selected x-range (in plot coordinates) |
| sender | JKQTPlotter sending this event |
|
slot |
zooms into the graph (the same as turning the mouse wheel) by the given factor
|
slot |
zooms out of the graph (the same as turning the mouse wheel) by the given factor
|
slot |
this method zooms the graph so that all plotted datapoints are visible.
| zoomX | if set true (default) zooms the x axis |
| zoomY | if set true (default) zooms the y axis |
| includeX0 | if this is true zoomToFit() will ensure that  |
| includeY0 | if this is true zoomToFit() will ensure that  |
| scaleX | the plot will have a width of   |
| scaleY | the plot will have a height of   |
|
friend |
|
friend |
|
protected |
QAction which triggers copying of the data to the clipboard.
|
protected |
QAction which triggers copying of the data to the clipboard in Matlab format.
|
protected |
QAction which triggers copying of the image to the clipboard.
|
protected |
QAction which triggers the printing.
|
protected |
QAction which triggers the saving as CSV (data only)
|
protected |
QAction which triggers saving of the data used for the plot.
|
protected |
QAction which triggers the saving as PDF.
|
protected |
QAction which triggers the saving as pixel image.
|
protected |
QAction which triggers saving of the plot as an image.
|
protected |
QAction which triggers the saving as Scalable Vector Graphics (SVG)
|
protected |
QAction to show a table with all the plot data in the datastore.
|
protected |
QAction which triggers zoom all.
|
protected |
QAction which triggers zoom in.
|
protected |
QAction which triggers zoom out.
|
protected |
the aspect ratio of plotwidth and plotheight to maintain, if maintainAspectRatio==true
|
protected |
the aspect ratio of axis widths to maintain, if maintainAxisAspectRatio==true
When the axis aspect ratio is to be maintained and new axis ranges are set (e.g. when calling setXY() ), the given axis ranges are modified, so
|
protected |
the current file format to use in SaveDataAs ... dialogs
|
protected |
the current file format to use in SaveAs ... dialogs
|
protected |
the currently selected printer
|
protected |
the current directory in which to open SaveAs ... dialogs
|
protected |
|
protected |
|
protected |
an object which manages all data columns for this plotter class
|
protected |
indicates whether the datastore is managed (allocated/freed) internally or externally
|
protected |
controls, whether the signals plotUpdated() are emitted
|
protected |
specifies whether this class emits signals, like zoomChangedLocally() or beforePlotScalingRecaluclate()
|
private |
|
private |
|
protected |
multiplier for the font size
|
protected |
multiplier which is used for font sizes when the plot is exported/printed
|
protected |
|
staticprotected |
|
staticprotected |
|
staticprotected |
|
protected |
a vector that contains all graphs to be plottet in the system
|
protected |
indicates whether the grid printing is activated
|
protected |
this list contains all the columns of the current grid printing and stores its widths
|
protected |
x position of the current graph in grid printing
|
protected |
y position of the current graph in grid printing
|
protected |
list that manages all the additional graphs for grid printing mode
|
protected |
this list contains all the rows of the current grid printing and stores its heights
|
protected |
size of all plots in grid printing mode, filled by gridPrintingCalc()
|
protected |
calculated value: free space between widget top border and plot top border, as used to plot the graph
|
protected |
calculated value: free space between widget top border and plot top border, as used to plot the graph
|
protected |
calculated value: free space between widget top border and plot top border, as used to plot the graph
|
protected |
calculated value: free space between widget top border and plot top border, as used to plot the graph
|
protected |
calculated value: plot height in pixel inside the widget (calculated by calcPlotScaling() from plotBorderTop, plotBorderBottom and widgetHeight)
|
protected |
calculated value: size and location of the plot key
|
protected |
calculated value: description of free space between actual plot and widget borders
|
protected |
calculated value: plot width in pixel inside the widget (calculated by calcPlotScaling() from plotBorderLeft, plotBorderRight and widgetWidth)
|
protected |
calculated value: height of the plot title (or 0 if no title)
|
staticprotected |
|
staticprotected |
|
protected |
multiplier or the line widths
|
protected |
multiplier which is used for linewidths when the plot is exported/printed
|
protected |
this list contains additional actions, that can be registered by registerAdditionalAction(). They are shown in the context menu only and are e.g. used to display "save image data" actions. Each action may be in a category (key of map), which is displayed as a submenu of the context-menu!
|
protected |
model representing all Plots in this plotter and showing their visible/invisible state
|
protected |
key objects used for the main plot key
|
protected |
indicates whether the widget should maintain an aspect ratio of plotwidth and plotheight
|
protected |
indicates whether the axes should maintain an aspect ratio
When the axis aspect ratio is to be maintained and new axis ranges are set (e.g. when calling setXY() ), the given axis ranges are modified, so
|
protected |
the master plotter for x-dimension, this plotter is connected to.
|
protected |
the master plotter for y-dimension, this plotter is connected to.
|
protected |
synchronize plot height with masterPlotterY
|
protected |
synchronize plot width with masterPlotterX
|
protected |
used to plot LaTeX markup
|
protected |
this is an internal property that is used by the export/print system to control the "magnification". Usually this is 1.0 but if set !=1.0, it is used to scale the widgetWidth and widgetHeight before painting!
|
protected |
the plot label text
|
protected |
current style properties for this JKQTBasePlotter instance
|
private |
|
private |
|
private |
|
private |
|
private |
|
private |
|
private |
|
private |
|
private |
|
private |
|
private |
|
private |
|
private |
|
protected |
objects used a secondary x-axes
|
protected |
objects used a secondary y-axes
|
private |
|
private |
|
private |
|
protected |
indicates whether to use clipping (hack for printing, see print() )
|
protected |
internal: used to store a list of all currently used plot styles
|
protected |
filename for the ini file in which to save the user settings
|
protected |
prefix for the ini file in which to save the user settings
|
protected |
|
protected |
|
protected |
object used for the x-axis
|
protected |
object used for the y-axis