JKQTPlotter trunk/v5.0.0
an extensive Qt5+Qt6 Plotter framework (including a feature-richt plotter widget, a speed-optimized, but limited variant and a LaTeX equation renderer!), written fully in C/C++ and without external dependencies
Loading...
Searching...
No Matches
Example (JKQTPlotter): Laying out Several Plots

This project (see ./examples/multiplot/) shows how several JKQTPlotter widgets can be combined to in a layout (based on the Qt layouting system). It also shows how axes in such a layout can be linked to improve user experience.

The source code of the main application can be found in test_multiplot.cpp.

First three plots are generated and put into a QGridLayout:

// 1. create a widget
QWidget mainWidget;
mainWidget.setWindowTitle("JKQTPlotter(s) in a QGridLayout");
// 2. Create a QGridLayout for the plots and add it to the widget.
QGridLayout* layout=new QGridLayout();
mainWidget.setLayout(layout);
// 3.1 create a main plotter widget and add it to the layout
JKQTPlotter* plotMain=new JKQTPlotter(&mainWidget);
layout->addWidget(plotMain, 0,0);
JKQTPDatastore* ds=plotMain->getDatastore();
// 3.2 create a second and third plotter widget and add them to the
// layout below and at the bottom right of the plotMain.
// Also configure it to use the same datastore as plotMain
JKQTPlotter* plotResid=new JKQTPlotter(false, &mainWidget, ds);
layout->addWidget(plotResid, 1,0);
JKQTPlotter* plotResidHist=new JKQTPlotter(false, &mainWidget, ds);
layout->addWidget(plotResidHist, 1,1);
// 3.3 set relative sizes of the plots via the layout (small plots have 1/3 the width and height of the large plot
layout->setRowStretch(0,3);
layout->setRowStretch(1,1);
layout->setColumnStretch(0,3);
layout->setColumnStretch(1,1);
This class manages data columns (with entries of type double ), used by JKQTPlotter/JKQTBasePlotter t...
Definition jkqtpdatastorage.h:282
plotter widget for scientific plots (uses JKQTBasePlotter to do the actual drawing)
Definition jkqtplotter.h:364
JKQTPDatastore * getDatastore()
returns a pointer to the datastore used by this object
Definition jkqtplotter.h:611

With this simple setup, all three plots would be arranged by the QLayout, but they were all independent. This example could be part of a data fitting application, where the main plot shows data and a fit curve. A plot below that will display the residulas (errors) of the fit. Now if a user zooms one of the plots, he would expect that athe x-axes of the two plots are synchronized. The same for a third plot on the rhs of the residuals, which will show a residual histogram. This linking of the axes can be achieved by the following code:

// 3.3 synchronize width/x-axis of plotResid to width/x-axis of plotMain
plotResid->synchronizeToMaster(plotMain, JKQTBasePlotter::sdXAxis, true, true, true);
// 3.4 synchronize y-axis of width/plotResidHist to y-axis of width/plotResid
plotResidHist->synchronizeToMaster(plotResid, JKQTBasePlotter::sdYAxis, true, true, true);
@ sdXAxis
x-axis only
Definition jkqtpbaseplotter.h:1349
@ sdYAxis
y-axis only
Definition jkqtpbaseplotter.h:1350
void synchronizeToMaster(JKQTPlotter *master, JKQTBasePlotter::SynchronizationDirection synchronizeDirection, bool synchronizeAxisLength=true, bool synchronizeZoomingMasterToSlave=true, bool synchronizeZoomingSlaveToMaster=true)
synchronize the plot borders (and zooming) with a given plotter (master --> slave/this)

Finally: When printing or saving an image of the plots, the plotter will no know anything about the arrangement of the plots and the plots cannot be printed/drawn in the same arrangement as in the window. If you want to arrange the plots in the same layout in a printout, as in the window, you will have to tell the main plot, in which arrangement to print the plots:

// 3.6 ensure that the plot are printed/exported in whole, when printing in plotMain
plotMain->getPlotter()->setGridPrinting(true);
plotMain->getPlotter()->addGridPrintingPlotter(0,1,plotResid->getPlotter());
plotMain->getPlotter()->addGridPrintingPlotter(1,1,plotResidHist->getPlotter());
void addGridPrintingPlotter(size_t x, size_t y, JKQTBasePlotter *plotter)
add a new plotter for grid printing mode
void setGridPrinting(bool __value)
indicates whether the grid printing is activated
JKQTBasePlotter * getPlotter()
returns the JKQTBasePlotter object internally used for plotting
Definition jkqtplotter.h:404

In the first line, grid-printing (i.e. the layouted printing of several graphs) is activated. Then the arrangement of the two slave plots plotResid and plotResidHist is defined as (x,y)-shifts with respect to the master plot plotMain.

Now some data is generated and several curves are added to the graphs. See test_multiplot.cpp for the full source code.

Finally the axes and plots need a bit of formatting to make them look nicer:

// 6.1 axis labels, distributed over the several plots
plotMain->getYAxis()->setAxisLabel("y axis");
plotResid->getXAxis()->setAxisLabel("x axis");
plotResid->getYAxis()->setAxisLabel("residuals");
plotResidHist->getXAxis()->setAxisLabel("frequency");
// 6.2 switch off the tick labels on the axes that directly face another plot
// 6.3 show tick labels on the rhs y-axis of the residual histogram plot
// 6.4 hide keys in all plots but the main plot
plotResid->getPlotter()->setShowKey(false);
plotResidHist->getPlotter()->setShowKey(false);
// 6.5 hide position label and toolbars in the plots except main plot
plotResid->setToolbarEnabled(false);
plotResid->setMousePositionShown(false);
plotResidHist->setToolbarEnabled(false);
plotResidHist->setMousePositionShown(false);
plotMain->setToolbarEnabled(true);
void setShowKey(bool __value)
indicates whether to plot a key
void setDrawMode2(JKQTPCADrawMode __value)
draw mode of the secondary (right/top) axis
void setAxisLabel(const QString &__value)
axis label of the axis
void setDrawMode1(JKQTPCADrawMode __value)
draw mode of the main (left/bottom) axis
JKQTPVerticalAxisBase * getYAxis(JKQTPCoordinateAxisRef axis=JKQTPPrimaryAxis)
returns the y-axis objet of the plot
Definition jkqtplotter.h:713
void setMousePositionShown(bool __value)
specifies whether to display the current position of the mouse in the top border of the plot (this ma...
void setToolbarEnabled(bool __value)
returns whether the toolbar is enabled
JKQTPHorizontalAxisBase * getXAxis(JKQTPCoordinateAxisRef axis=JKQTPPrimaryAxis)
returns the x-axis objet of the plot
Definition jkqtplotter.h:711
@ JKQTPCADMLineTicksTickLabels
draw axis with ticks, line and tick labels
Definition jkqtptools.h:413
@ JKQTPCADMLineTicks
draw axis with ticks and line
Definition jkqtptools.h:414

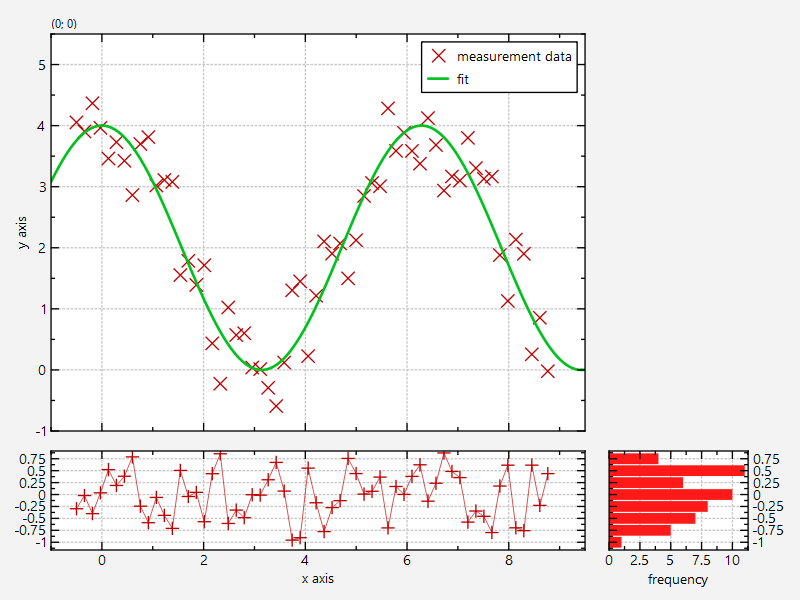
As a last step, the axes are scaled automatically, so the data fills the plots:

// 7. scale plots automatically to data
plotResid->zoomToFit();
plotResidHist->zoomToFit();
plotMain->zoomToFit();
void zoomToFit(bool zoomX=true, bool zoomY=true, bool includeX0=false, bool includeY0=false, double scaleX=1.05, double scaleY=1.05)
this method zooms the graph so that all plotted datapoints are visible.
Definition jkqtplotter.h:1039

The result looks like this:
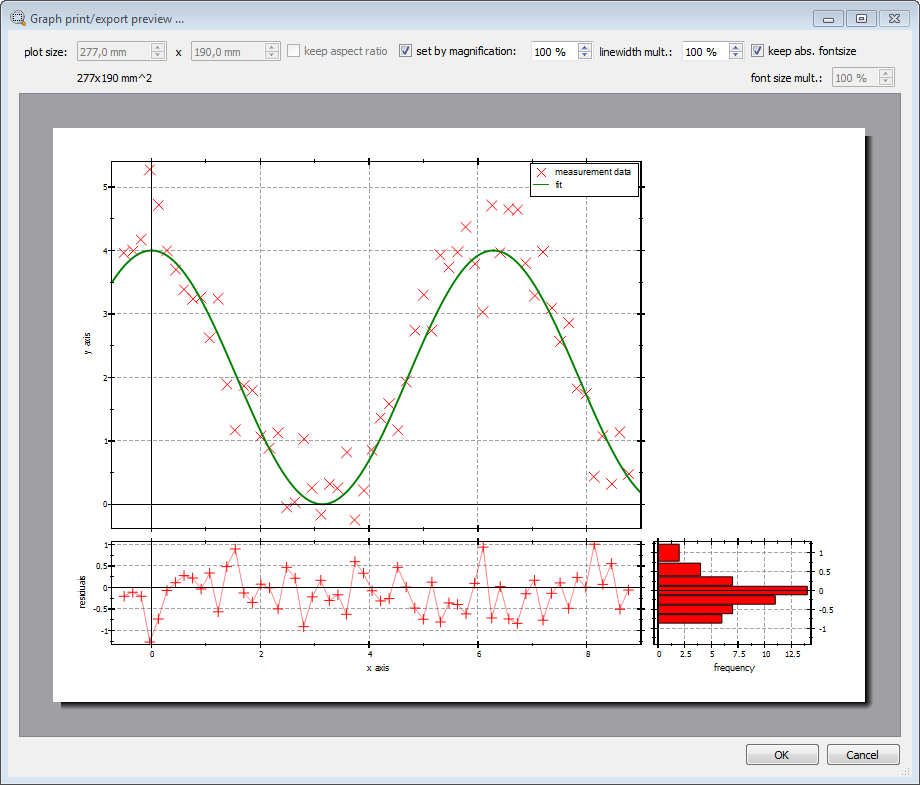
multiplot

You push the print button (print) to open a print preview dialog, which will give an impression of how the three plots will be arranged in a printout:

multiplot_printpreview

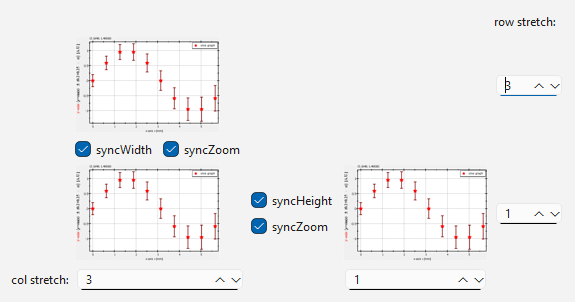
In addition this example also contains a Window that allows to control the plot layout and synchronization options:

multiplot_controlwindow