|
JKQTPlotter trunk/v5.0.0
an extensive Qt5+Qt6 Plotter framework (including a feature-richt plotter widget, a speed-optimized, but limited variant and a LaTeX equation renderer!), written fully in C/C++ and without external dependencies
|
|
JKQTPlotter trunk/v5.0.0
an extensive Qt5+Qt6 Plotter framework (including a feature-richt plotter widget, a speed-optimized, but limited variant and a LaTeX equation renderer!), written fully in C/C++ and without external dependencies
|
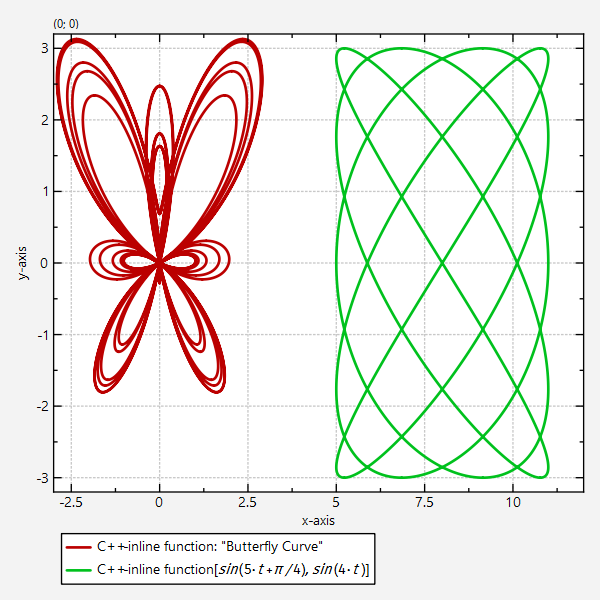
This project (see ./examples/evalcurve/) demonstrates how to plot mathematical functions as line graphs with JKQTPXYFunctionLineGraph. The functions may be defined as static C functions, C++ functors or c++ inline functions. The functions may simply depend on the parameter t, or on t and a vector of parameters.
The class uses an adaptive algorithm, which determines by the local slope, at how many points (or how close points) the functor has to be evaluated.
If you want to evaluate the parametric function explicitly, you can use JKQTPXYLineGraph or JKQTPXYParametrizedScatterGraph and have a look at the example ./examples/parametriccurve.
The example shows how to plot a simple C++ inline function:
Note that here a functor is defined, which calculates the points on a Butterfly Curve, i.e. a function mapping a parameter t to a two-dimensional point QPointF with complex functions for x and y. This function is evaluated on a range of values for t, set by
JKQTPXYFunctionLineGraph allows to use more complex functors alternatively: These depend on the variable tand a vector of parameters. Here is an example:
In the functor we can use the entries in the vector param as function parameters. The values in this vector are defined by
Alternatively they can also be taken from a column in the internal datastore. Then you have to call:
instead, where ColumnID is the ID of the column with the parameter values.
This code snippets above result in a plot like this:
This example describes how to draw 2D parametric curves. For (simpler) 1D-functions f(x) or f(y), see examples/functionplot .