|
| | JKQTPXYParametrizedScatterGraph (JKQTBasePlotter *parent=nullptr) |
| | class constructor
|
| | JKQTPXYParametrizedScatterGraph (JKQTPlotter *parent) |
| | class constructor
|
| virtual void | cbGetDataMinMax (double &imin, double &imax) override |
| | determine min/max data value of the image
|
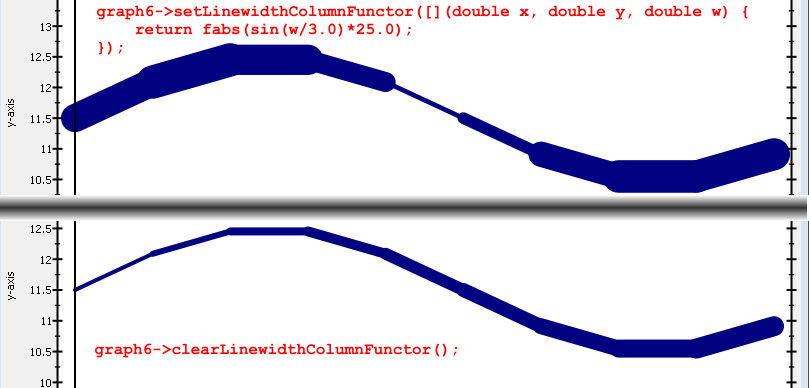
| void | clearLinewidthColumnFunctor () |
| | defines a standard (1:1) functor, which converts a value from the symbolColumn into an actual line width in pt
|
| void | clearSizeColumnFunctor () |
| | defines a standard (1:1) functor, which converts a value from the sizeColumn into an actual symbol size in pt
|
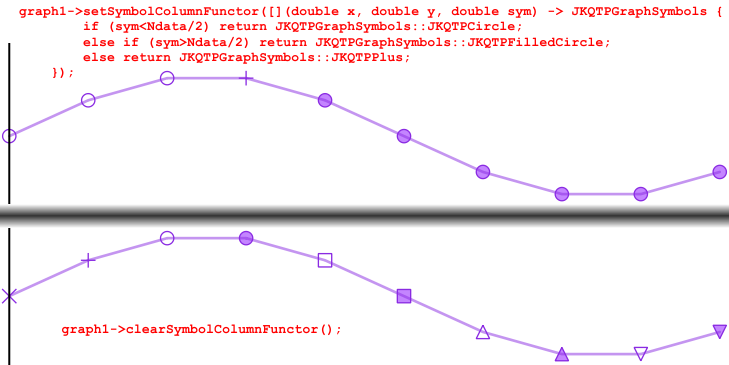
| void | clearSymbolColumnFunctor () |
| | defines a standard (1:1) functor, which converts a value from the symbolColumn into an actual symbol type
|
| virtual void | draw (JKQTPEnhancedPainter &painter) override |
| | plots the graph to the plotter object specified as parent
|
| virtual void | drawKeyMarker (JKQTPEnhancedPainter &painter, const QRectF &rect) override |
| | plots a key marker inside the specified rectangle rect
|
| virtual void | drawOutside (JKQTPEnhancedPainter &painter, QRect leftSpace, QRect rightSpace, QRect topSpace, QRect bottomSpace) override |
| | plots outside the actual plot field of view (e.g. color bars, scale bars, ...)
|
| int | getColorColumn () const |
| | this column contains the symbol color
|
| bool | getColorColumnContainsRGB () const |
| | if this is true, the value in the colorColumn is converted to an integer, representing a color in ARGB format (as in QRgb)
|
| bool | getDrawLine () const |
| | indicates whether to draw a line or not
|
| bool | getDrawLineInForeground () const |
| | indicates whether to draw the line behind or above the symbols
|
| double | getGridDeltaX () const |
| | if the gridModeForSymbolSize mode is actiavted (true), the plot assumes that the scatter symbols are ordered in a grid. It the uses the given griDeltaX and gridDeltaY to calculate the symbol size, so they fill the available space to a fraction gridSymbolFractionSize.
|
| double | getGridDeltaY () const |
| | if the gridModeForSymbolSize mode is actiavted (true), the plot assumes that the scatter symbols are ordered in a grid. It the uses the given griDeltaX and gridDeltaY to calculate the symbol size, so they fill the available space to a fraction gridSymbolFractionSize.
|
| bool | getGridModeForSymbolSize () const |
| | if the gridModeForSymbolSize mode is actiavted (true), the plot assumes that the scatter symbols are ordered in a grid. It the uses the given griDeltaX and gridDeltaY to calculate the symbol size, so they fill the available space to a fraction gridSymbolFractionSize.
|
| double | getGridSymbolFractionSize () const |
| | if the gridModeForSymbolSize mode is actiavted (true), the plot assumes that the scatter symbols are ordered in a grid. It the uses the given griDeltaX and gridDeltaY to calculate the symbol size, so they fill the available space to a fraction gridSymbolFractionSize.
|
| virtual QColor | getKeyLabelColor () const override |
| | returns the color to be used for the key label
|
| int | getLinewidthColumn () const |
| | this column contains the line width
|
| FunctorToWidth | getLinewidthColumnFunctor () |
| | returns the current functor, which converts a value from the symbolColumn into an actual line width in pt
|
| virtual void | getOutsideSize (JKQTPEnhancedPainter &painter, int &leftSpace, int &rightSpace, int &topSpace, int &bottomSpace) override |
| | if the graph plots outside the actual plot field of view (e.g. color bars, scale bars, ...)
|
| int | getSizeColumn () const |
| | this column contains the symbol size in pt
|
| FunctorToSize | getSizeColumnFunctor () |
| | returns the current functor, which converts a value from the sizeColumn into an actual symbol size in pt
|
| int | getSymbolColumn () const |
| | this column contains the symbol type
|
| FunctorToSymbol | getSymbolColumnFunctor () |
| | returns the current functor, which converts a value from the symbolColumn into an actual symbol type
|
| JKQTPColorDerivationMode | getSymbolFillDerivationMode () const |
| | specifies how to derive the symbol fill color from the symbol/line color
|
| void | setColor (QColor c) |
| | set color of line and symbol
|
| void | setColorColumn (int __value) |
| | this column contains the symbol color
|
| void | setColorColumn (size_t __value) |
| | this column contains the symbol color
|
| void | setColorColumnContainsRGB (bool __value) |
| | if this is true, the value in the colorColumn is converted to an integer, representing a color in ARGB format (as in QRgb)
|
| void | setDrawLine (bool __value) |
| | indicates whether to draw a line or not
|
| void | setDrawLineInForeground (bool __value) |
| | indicates whether to draw the line behind or above the symbols
|
| void | setGridDeltaX (double __value) |
| | if the gridModeForSymbolSize mode is actiavted (true), the plot assumes that the scatter symbols are ordered in a grid. It the uses the given griDeltaX and gridDeltaY to calculate the symbol size, so they fill the available space to a fraction gridSymbolFractionSize.
|
| void | setGridDeltaY (double __value) |
| | if the gridModeForSymbolSize mode is actiavted (true), the plot assumes that the scatter symbols are ordered in a grid. It the uses the given griDeltaX and gridDeltaY to calculate the symbol size, so they fill the available space to a fraction gridSymbolFractionSize.
|
| void | setGridModeForSymbolSize (bool __value) |
| | if the gridModeForSymbolSize mode is actiavted (true), the plot assumes that the scatter symbols are ordered in a grid. It the uses the given griDeltaX and gridDeltaY to calculate the symbol size, so they fill the available space to a fraction gridSymbolFractionSize.
|
| void | setGridSymbolFractionSize (double __value) |
| | if the gridModeForSymbolSize mode is actiavted (true), the plot assumes that the scatter symbols are ordered in a grid. It the uses the given griDeltaX and gridDeltaY to calculate the symbol size, so they fill the available space to a fraction gridSymbolFractionSize.
|
| void | setLinewidthColumn (int __value) |
| | this column contains the line width
|
| void | setLinewidthColumn (size_t __value) |
| | this column contains the line width
|
| void | setLinewidthColumnFunctor (FunctorToWidth ff) |
| | defines a functor, which converts a value from the symbolColumn into an actual line width in pt
|
| void | setMappedSymbolColumnFunctor (const QMap< double, JKQTPGraphSymbols > &symmap) |
| | defines a special functor, which converts a value from the symbolColumn into an actual symbol type, where the relation between value and symbol is defined by a map double->symbol
|
| virtual void | setParent (JKQTBasePlotter *parent) override |
| | sets the parent painter class
|
| void | setSizeColumn (int __value) |
| | this column contains the symbol size in pt
|
| void | setSizeColumn (size_t __value) |
| | this column contains the symbol size in pt
|
| void | setSizeColumnFunctor (FunctorToSize ff) |
| | defines a functor, which converts a value from the sizeColumn into an actual symbol size in pt
|
| void | setSymbolColumn (int __value) |
| | this column contains the symbol type
|
| void | setSymbolColumn (size_t __value) |
| | this column contains the symbol type
|
| void | setSymbolColumnFunctor (FunctorToSymbol ff) |
| | defines a functor, which converts a value from the symbolColumn into an actual symbol type
|
| void | setSymbolFillDerivationMode (JKQTPColorDerivationMode m) |
| | specifies how to derive the symbol fill color from the symbol/line color
|
| virtual bool | usesColumn (int c) const override |
| | returns true if the given column is used by the graph
|
| | JKQTPXYGraph (JKQTBasePlotter *parent=nullptr) |
| | class constructor
|
| DataSortOrder | getDataSortOrder () const |
| | if !=Unsorted, the data is sorted before plotting
|
| virtual int | getKeyColumn () const |
| | returns the column used as "key" for the current graph (typically this call getXColumn(), but for horizontal graphs like filled curves or barcharts it may call getYColumn() )
|
| virtual int | getValueColumn () const |
| | returns the column used as "value" for the current graph (typically this call getXColumn(), but for horizontal graphs like filled curves or barcharts it may call getYColumn() )
|
| int | getXColumn () const |
| | the column that contains the x-component of the datapoints
|
| virtual bool | getXMinMax (double &minx, double &maxx, double &smallestGreaterZero) override |
| | get the maximum and minimum x-value of the graph
|
| int | getYColumn () const |
| | the column that contains the y-component of the datapoints
|
| virtual bool | getYMinMax (double &miny, double &maxy, double &smallestGreaterZero) override |
| | get the maximum and minimum y-value of the graph
|
| virtual double | hitTest (const QPointF &posSystem, QPointF *closestSpotSystem=nullptr, QString *label=nullptr, HitTestMode mode=HitTestXY) const override |
| | Implmentation of JKQTPPlotElement::hitTest(), which searches through all graph points defined by xColumn and yColumn and returns a general x/y-label, also taking into account possibly known errors to the graphs (if it is derived from JKQTPXGraphErrorData and/or JKQTPYGraphErrorData.
|
| | JKQTPGraph (JKQTBasePlotter *parent=nullptr) |
| | class constructor
|
| virtual | ~JKQTPGraph ()=default |
| | default wirtual destructor
|
| | JKQTPPlotElement (JKQTBasePlotter *parent=nullptr) |
| | class constructor
|
| virtual | ~JKQTPPlotElement ()=default |
| | default wirtual destructor
|
| QPointF | backTransform (const QPointF &x) const |
| | tool routine that back-transforms a QPointF according to the parent's transformation rules (pixels --> plot coordinate)
|
| QPointF | backTransform (double x, double y) const |
| | tool routine that back-transforms a QPointF according to the parent's transformation rules (pixels --> plot coordinate)
|
| double | backtransformX (double x) const |
| | tool routine that backtransforms an x-coordinate (pixels --> plot coordinate) for this plot element, uses the axis referenced in xAxisRef
|
| double | backtransformY (double y) const |
| | tool routine that backtransforms a y-coordinate (pixels --> plot coordinate) for this plot element, uses the axis referenced in yAxisRef
|
| QImage | generateKeyMarker (QSize size=QSize(16, 16)) |
| | returns an image with a key marker inside
|
| JKQTBasePlotter * | getParent () |
| | returns the parent painter class
|
| const JKQTBasePlotter * | getParent () const |
| | returns the parent painter class
|
| QString | getTitle () const |
| | returns the the title of the plot
|
| const JKQTPCoordinateAxis * | getXAxis () const |
| | returns the actual x-Axis-object from the parent plotter, referenced in xAxisRef
|
| JKQTPCoordinateAxisRef | getXAxisRef () const |
| | indicates which coordinate axis to use for coordinate transforms in x-direction
|
| const JKQTPCoordinateAxis * | getYAxis () const |
| | returns the actual y-Axis-object from the parent plotter, referenced in yAxisRef
|
| JKQTPCoordinateAxisRef | getYAxisRef () const |
| | indicates which coordinate axis to use for coordinate transforms in y-direction
|
| bool | isHighlighted () const |
| | returns whether the graph is shown in a highlighted style in the plot
|
| bool | isVisible () const |
| | returns whether the graph is visible in the plot
|
| void | setAxes (JKQTPCoordinateAxisRef ref) |
| | set the coordinate axes to use for this plot element
|
| virtual void | setParent (JKQTPlotter *parent) |
| | sets the parent painter class
|
| void | setXAxis (JKQTPCoordinateAxisRef ref) |
| | indicates which coordinate axis to use for coordinate transforms in x-direction
|
| void | setYAxis (JKQTPCoordinateAxisRef ref) |
| | indicates which coordinate axis to use for coordinate transforms in y-direction
|
| QPointF | transform (const QPointF &x) const |
| | tool routine that transforms a QPointF according to the parent's transformation rules (plot coordinate --> pixels)
|
| QPolygonF | transform (const QPolygonF &x) const |
| | tool routine that transforms a QPolygonF according to the parent's transformation rules (plot coordinate --> pixels)
|
| QPointF | transform (double x, double y) const |
| | tool routine that transforms a QPointF according to the parent's transformation rules (plot coordinate --> pixels)
|
| QPainterPath | transformToLinePath (const QPolygonF &x) const |
| | tool routine that transforms a QPolygonF according to the parent's transformation rules and returns a (non-closed) path consisting of lines (plot coordinate --> pixels)
|
| QVector< double > | transformX (const QVector< double > &x) const |
| | transform all x-coordinates in a vector x
|
| double | transformX (double x) const |
| | tool routine that transforms an x-coordinate (plot coordinate --> pixels) for this plot element, uses the axis referenced in xAxisRef
|
| QVector< double > | transformY (const QVector< double > &x) const |
| | transform all y-coordinates in a vector x
|
| double | transformY (double y) const |
| | tool routine that transforms a y-coordinate (plot coordinate --> pixels) for this plot element, uses the axis referenced in yAxisRef
|
| | JKQTPGraphLineStyleMixin () |
| | class constructor
|
| virtual | ~JKQTPGraphLineStyleMixin () |
| QColor | getHighlightingLineColor () const |
| | get the color of the graph line when highlighted
|
| QPen | getHighlightingLinePen (JKQTPEnhancedPainter &painter, JKQTBasePlotter *parent) const |
| | constructs a QPen from the line styling properties
|
| QPen | getHighlightingLinePenForRects (JKQTPEnhancedPainter &painter, JKQTBasePlotter *parent) const |
| | constructs a QPen from the line styling properties, suitable for drawing rectangle with sharp corners
|
| QPen | getKeyLinePen (JKQTPEnhancedPainter &painter, const QRectF &rect, JKQTBasePlotter *parent) const |
| | constructs a QPen from the line styling properties, but uses getKeyLineWidthPx() for the width, i.e. constructs a pen for drawing lines in key-symbols
|
| double | getKeyLineWidthPx (JKQTPEnhancedPainter &painter, const QRectF &keyRect, const JKQTBasePlotter *parent) const |
| | returns the linewidth for drawing lines in a key entry with keyRect for the symbol, using painter and parent .
|
| QBrush | getLineBrush () const |
| | gets the brush used to fill the line area
|
| Qt::PenCapStyle | getLineCapStyle () const |
| | gets the cap style
|
| QColor | getLineColor () const |
| | get the color of the graph line
|
| qreal | getLineDashOffset () const |
| | returns the dash offset for a custom dash style
|
| QVector< qreal > | getLineDashPattern () const |
| | gets the dash pattern for a custom dash style
|
| Qt::PenJoinStyle | getLineJoinStyle () const |
| | returns the join style
|
| QPen | getLinePen (JKQTPEnhancedPainter &painter, JKQTBasePlotter *parent) const |
| | constructs a QPen from the line styling properties
|
| QPen | getLinePenForRects (JKQTPEnhancedPainter &painter, JKQTBasePlotter *parent) const |
| | constructs a QPen from the line styling properties, suitable for drawing rectangles with sharp edges
|
| Qt::PenStyle | getLineStyle () const |
| | get the style of the graph line
|
| double | getLineWidth () const |
| | get the line width of the graph line (in pt)
|
| void | initLineStyle (JKQTBasePlotter *parent, int &parentPlotStyle, JKQTPPlotStyleType styletype=JKQTPPlotStyleType::Default) |
| | initiaize the line style (from the parent plotter)
|
| void | setHighlightingLineColor (const QColor &__value) |
| | set the color of the graph line when highlighted
|
| void | setHighlightingLineColor (const QColor &__value, double alpha) |
| | set the color of the graph line when highlighted
|
| void | setLineBrush (const QBrush &style) |
| | sets the brush used to fill the line area
|
| void | setLineCapStyle (Qt::PenCapStyle style) |
| | sets the cap style
|
| void | setLineColor (const QColor &__value) |
| | set the color of the graph line
|
| void | setLineColor (const QColor &__value, double alpha) |
| | set the color of the graph line
|
| void | setLineColorInvertedFrom (QColor __noninvertedColor) |
| | sets the line-color as an inverted version of the given color
|
| void | setLineDashOffset (qreal offset) |
| | sets the dash offset for a custom dash style
|
| void | setLineDashPattern (const QVector< qreal > &pattern) |
| | sets the dash pattern for a custom dash style
|
| void | setLineJoinStyle (Qt::PenJoinStyle style) |
| | sets the join style
|
| void | setLineStyle (Qt::PenStyle __value) |
| | set the style of the graph line
|
| void | setLineWidth (double __value) |
| | set the line width of the graph line (in pt)
|
| | JKQTPGraphSymbolStyleMixin () |
| | class constructor
|
| virtual | ~JKQTPGraphSymbolStyleMixin () |
| QColor | getSymbolColor () const |
| | set the color of the graph symbols
|
| QColor | getSymbolFillColor () const |
| | set the color of filling of the graph symbols
|
| QString | getSymbolFontName () const |
| | get the font to be used for character symbols JKQTPCharacterSymbol+QChar('').unicode()
|
| double | getSymbolLineWidth () const |
| | get the line width of the graph symbol outline (in pt)
|
| double | getSymbolSize () const |
| | get the size (=diameter in pt) of the graph symbol (in pt)
|
| JKQTPGraphSymbols | getSymbolType () const |
| | get the type of the graph symbol
|
| void | initSymbolStyle (JKQTBasePlotter *parent, int &parentPlotStyle, JKQTPPlotStyleType styletype=JKQTPPlotStyleType::Default) |
| | initiaize the symbol style (from the parent plotter)
|
| void | setSymbolAlpha (double alpha) |
| | set alpha-value of symbol outline and filling
|
| void | setSymbolColor (const QColor &__value) |
| | set the color of the graph symbols
|
| void | setSymbolColor (const QColor &__value, double alpha) |
| | set the color of the graph symbols
|
| void | setSymbolFillColor (const QColor &__value) |
| | set the color of filling of the graph symbols
|
| void | setSymbolFillColor (const QColor &__value, double alpha) |
| | set the color of filling of the graph symbols
|
| void | setSymbolFontName (const QString &__value) |
| | set the font to be used for character symbols JKQTPCharacterSymbol+QChar('').unicode()
|
| void | setSymbolLineWidth (double __value) |
| | set the line width of the graph symbol outline (in pt)
|
| void | setSymbolSize (double __value) |
| | set the size (=diameter in pt) of the graph symbol (in pt)
|
| void | setSymbolType (JKQTPGraphSymbols __value) |
| | set the type of the graph symbol
|
| Public Member Functions inherited from JKQTPColorPaletteStyleAndToolsMixin |
| | JKQTPColorPaletteStyleAndToolsMixin (JKQTBasePlotter *parent) |
| virtual | ~JKQTPColorPaletteStyleAndToolsMixin () |
| virtual void | cbDrawOutside (JKQTPEnhancedPainter &painter, QRect leftSpace, QRect rightSpace, QRect topSpace, QRect bottomSpace) |
| | plots outside the actual plot field of view (e.g. color bars, scale bars, ...)
|
| virtual void | cbGetOutsideSize (JKQTPEnhancedPainter &painter, int &leftSpace, int &rightSpace, int &topSpace, int &bottomSpace) |
| | if the graph plots outside the actual plot field of view (e.g. color bars, scale bars, ...)
|
| virtual void | cbSetParent (JKQTBasePlotter *parent) |
| | set the parent class for internal objects (e.g. color bars)
|
| JKQTPMathImageColorRangeFailAction | getActionRangeMaxFail () const |
| | which action to take if a color is above imageMax and autoImageRange ==false
|
| JKQTPMathImageColorRangeFailAction | getActionRangeMinFail () const |
| | which action to take if a color is below imageMin and autoImageRange ==false
|
| bool | getAutoImageRange () const |
| | indicates whether to estimate min/max of the image automatically
|
| int | getColorBarOffset () const |
| | offset between outside space border and color bar
|
| double | getColorBarRelativeHeight () const |
| | height of the color bar, as multiple of plotHeight
|
| JKQTPVerticalIndependentAxis * | getColorBarRightAxis () |
| | object used for color bar axes at the right
|
| const JKQTPVerticalIndependentAxis * | getColorBarRightAxis () const |
| | object used for color bar axes at the right
|
| bool | getColorBarRightVisible () const |
| | right color bar visible
|
| JKQTPHorizontalIndependentAxis * | getColorBarTopAxis () |
| | object used for color bar axes at the top
|
| const JKQTPHorizontalIndependentAxis * | getColorBarTopAxis () const |
| | object used for color bar axes at the top
|
| bool | getColorBarTopVisible () const |
| | top color bar visible
|
| int | getColorBarWidth () const |
| | width of the color bar
|
| JKQTPMathImageColorPalette | getColorPalette () const |
| | palette for plotting an image
|
| double | getImageMax () const |
| | image value range maximum
|
| double | getImageMin () const |
| | image value range minimum
|
| QString | getImageName () const |
| | name of the image displayed above color bar (may contain LaTeX markup!)
|
| QString | getImageNameFontName () const |
| | font name when displaying imageName
|
| double | getImageNameFontSize () const |
| | font size in points when displaying imageName
|
| QColor | getInfColor () const |
| | color to use for an infinity value
|
| QColor | getNanColor () const |
| | color to use for a not-a-number value
|
| QColor | getRangeMaxFailColor () const |
| | color to use for some settings of rangeMaxFailAction
|
| QColor | getRangeMinFailColor () const |
| | color to use for some settings of rangeMinFailAction
|
| bool | getShowColorBar () const |
| | indicate whether to display a color bar
|
| void | setAutoImageRange (bool __value) |
| | indicates whether to estimate min/max of the image automatically
|
| void | setColorBarOffset (int __value) |
| | offset between outside space border and color bar
|
| void | setColorBarRelativeHeight (double __value) |
| | height of the color bar, as multiple of plotHeight
|
| void | setColorBarRightVisible (bool __value) |
| | right color bar visible
|
| void | setColorBarTopVisible (bool __value) |
| | top color bar visible
|
| void | setColorBarWidth (int __value) |
| | width of the color bar
|
| void | setColorPalette (const JKQTPMathImageColorPalette &__value) |
| | palette for plotting an image
|
| void | setColorPalette (int pal) |
| | palette for plotting an image
|
| void | setImageMax (double __value) |
| | image value range maximum
|
| void | setImageMin (double __value) |
| | image value range minimum
|
| void | setImageName (const QString &__value) |
| | name of the image displayed above color bar (may contain LaTeX markup!)
|
| void | setImageNameFontName (const QString &__value) |
| | font name when displaying imageName
|
| void | setImageNameFontSize (double __value) |
| | font size in points when displaying imageName
|
| void | setInfColor (const QColor &__value) |
| | color to use for an infinity value
|
| void | setNanColor (const QColor &__value) |
| | color to use for a not-a-number value
|
| void | setRangeMaxFailAction (const JKQTPMathImageColorRangeFailAction &__value) |
| | which action to take if a color is above imageMax and autoImageRange ==false
|
| void | setRangeMaxFailColor (const QColor &__value) |
| | color to use for some settings of rangeMaxFailAction
|
| void | setRangeMinFailAction (const JKQTPMathImageColorRangeFailAction &__value) |
| | which action to take if a color is below imageMin and autoImageRange ==false
|
| void | setRangeMinFailColor (const QColor &__value) |
| | color to use for some settings of rangeMinFailAction
|
| void | setShowColorBar (bool __value) |
| | indicate whether to display a color bar
|
|
| QColor | getLocalColor (int i) const |
| | retrns the local color for the i-th datapoint
|
| double | getLocalLineWidth (int i) |
| | retrns the local line width for the i-th datapoint
|
| double | getLocalSymbolSize (int i) |
| | retrns the local symbol size for the i-th datapoint
|
| JKQTPGraphSymbols | getLocalSymbolType (int i) |
| | retrns the local symbol type for the i-th datapoint
|
| int | getDataIndex (int i) const |
| | returns the index of the i-th datapoint (where i is an index into the SORTED datapoints)
|
| virtual bool | getIndexRange (int &imin, int &imax) const |
| | determines the range of row indexes available in the data columns of this graph
|
| virtual void | intSortData () |
| | sorts data according to the specified criterion in sortData ... The result is stored as a index-map in sorted Indices
|
| virtual void | drawErrorsAfter (JKQTPEnhancedPainter &) |
| | this function is used to plot error inidcators after plotting the graphs.
|
| virtual void | drawErrorsBefore (JKQTPEnhancedPainter &) |
| | this function is used to plot error inidcators before plotting the graphs.
|
| bool | getDataMinMax (int column, double &minx, double &maxx, double &smallestGreaterZero) |
| | get the maximum and minimum value of the given column
|
| void | addHitTestData (const HitTestLocation &loc) |
| | clear the internal datastore for hitTest()
|
| void | addHitTestData (const QPointF &pos_, const QString &label_) |
| | clear the internal datastore for hitTest()
|
| void | addHitTestData (const QPointF &pos_, int index_, const QString &label_) |
| | clear the internal datastore for hitTest()
|
| void | addHitTestData (const QPointF &pos_, int index_=-1, const JKQTPDatastore *datastore=nullptr) |
| | clear the internal datastore for hitTest(), this variant uses formatHitTestDefaultLabel() to auto-generate the label
|
| void | addHitTestData (double x_, double y_, const QString &label_) |
| | add a new point on the graph to the internal datastore for hitTest()
|
| void | addHitTestData (double x_, double y_, int index_, const QString &label_) |
| | clear the internal datastore for hitTest()
|
| void | addHitTestData (double x_, double y_, int index_=-1, const JKQTPDatastore *datastore=nullptr) |
| | add a new point on the graph to the internal datastore for hitTest(), this variant uses formatHitTestDefaultLabel() to auto-generate the label
|
| void | clearHitTestData () |
| | clear the internal datastore for hitTest()
|
| virtual QString | formatHitTestDefaultLabel (double x, double y, int index=-1, const JKQTPDatastore *datastore=nullptr) const |
| | tool-function for hitTest(), which formats a default label, taking into account the x- and y-position (both provided) and optionally the errors of these positions.
|
| void | reserveHitTestData (int points) |
| | reserve list entries for up to points graph points in the internal datastore for hitTest()
|
| QString | xFloatToString (double v, int past_comma=-1) const |
| | converts a x-value v into a string, taking into account the type of x-axis
|
| QString | yFloatToString (double v, int past_comma=-1) const |
| | converts a x-value v into a string, taking into account the type of x-axis
|
| double | getKeySymbolLineWidthPx (JKQTPEnhancedPainter &painter, const QRectF &keyRect, const JKQTBasePlotter *parent, double maxSymbolSizeFracton=0.9) const |
| | returns the symbol linewidth for drawing symbols in a key entry with keyRect for the symbol, using painter and parent . maxSymbolSizeFracton specifies the maximum fraction of keyRect to be used for the symbol.
|
| double | getKeySymbolSizePx (JKQTPEnhancedPainter &painter, const QRectF &keyRect, const JKQTBasePlotter *parent, double maxSymbolSizeFracton=0.9) const |
| | returns the symbol size for drawing symbols in a key entry with keyRect for the symbol, using painter and parent . maxSymbolSizeFracton specifies the maximum fraction of keyRect to be used for the symbol.
|
| QBrush | getSymbolBrush (JKQTPEnhancedPainter &painter, JKQTBasePlotter *parent) const |
| | constructs a QPen from the line styling properties
|
| QFont | getSymbolFont () const |
| | generate a QFont for darwing symbols
|
| QPen | getSymbolPen (JKQTPEnhancedPainter &painter, JKQTBasePlotter *parent) const |
| | constructs a QPen from the line styling properties
|
| void | plotStyledSymbol (JKQTBasePlotter *parent, JKQTPEnhancedPainter &painter, double x, double y) const |
| | plot a symbol at location x,y (in painter coordinates), using the current style
|
| void | plotStyledSymbol (JKQTBasePlotter *parent, JKQTPEnhancedPainter &painter, double x, double y, double symbolSize) const |
| | plot a symbol at location x,y (in painter coordinates), using the current style
|
| void | plotStyledSymbol (JKQTBasePlotter *parent, JKQTPEnhancedPainter &painter, double x, double y, JKQTPGraphSymbols type) const |
| | plot a symbol at location x,y (in painter coordinates), using the current style
|
| void | plotStyledSymbol (JKQTBasePlotter *parent, JKQTPEnhancedPainter &painter, double x, double y, QColor color, QColor fillColor) const |
| | plot a symbol at location x,y (in painter coordinates), using the current style
|