QVector<double> RANDVAL;
std::map<int, double> hist;
for (int i=-5; i<=15; i++) hist[i]=0;
std::random_device rd;
std::mt19937 gen{rd()};
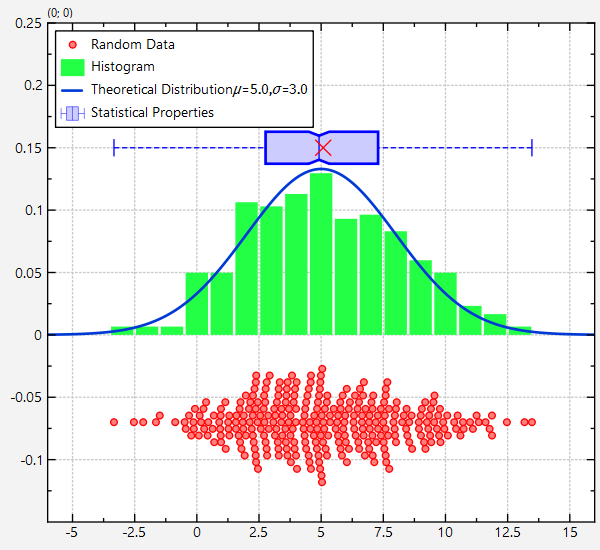
const double th_mean=5;
const double th_std=3;
std::normal_distribution<> d{th_mean,th_std};
size_t NDATA=301;
double sum=0;
double square_sum=0;
for (size_t i=0; i<NDATA; i++) {
const double v=d(gen);
RANDVAL<<v;
++hist[std::round(v)];
sum+=v;
square_sum+=(v*v);
}
for (auto& hi: hist) {
hi.second=hi.second/static_cast<double>(NDATA);
}
qSort(RANDVAL);
const double rndMean=sum/static_cast<double>(NDATA);
const double rndMin=RANDVAL.first();
const double rndMax=RANDVAL.last();
const double rndMedian=RANDVAL[RANDVAL.size()/2];
const double rndQ25=RANDVAL[RANDVAL.size()/4];
const double rndQ75=RANDVAL[RANDVAL.size()*3/4];
const double rndMedianConfidence=2.0*1.57*fabs(rndQ75-rndQ25)/sqrt(static_cast<double>(NDATA));
std::pair<size_t,size_t> columnHIST = ds->
addCopiedMap(hist,
"HIST_X",
"HIST_Y");
graphRANDVALS->setFillColor(graphRANDVALS->getColor().lighter(180));
return 1.0/(th_std*sqrt(2.0*M_PI))*exp(-0.5*(x-th_mean)*(x-th_mean)/th_std/th_std);
});
graphTheoDist->
setTitle(QString(
"Theoretical Distribution $\\mu=%1, \\sigma=%2$").arg(th_mean,0,
'f', 1).arg(th_std,0,
'f', 1));
graphBoxPlot->
setTitle(
"Statistical Properties");
plot.show();
plot.resize(800,800);
void setUseAntiAliasingForSystem(bool __value)
specifies whether to use antialiasing for plotting the coordinate system
void setUseAntiAliasingForGraphs(bool __value)
specifies whether to use antialiasing for plotting the graphs
void setKeyPosition(const JKQTPKeyPosition &__value)
key position inside or besides the plot area, see JKQTPKeyPositions for details and examples
void setUseAntiAliasingForText(bool __value)
specifies whether to use antialiasing when drawing any text
This implements a vertical bar graph with bars between and .
Definition jkqtpbarchart.h:51
void setMin(double __value)
the minimum value to be used for the boxplot
void setMedianConfidenceIntervalWidth(double __value)
the width of the confidence interval around the median
void setPos(double __value)
the position of the boxplot on the "other" axis
void setMedian(double __value)
the median value to be used for the boxplot
void setMax(double __value)
the maximum value to be used for the boxplot
void setMean(double __value)
the mean value to be used for the boxplot
void setPercentile75(double __value)
the 75% percentile value to be used for the boxplot
void setPercentile25(double __value)
the 25% percentile value to be used for the boxplot
This implements a horizontal (notched) boxplot where the data is directly given to the object and not...
Definition jkqtpboxplot.h:229
This class manages data columns (with entries of type double ), used by JKQTPlotter/JKQTBasePlotter t...
Definition jkqtpdatastorage.h:282
size_t addCopiedColumn(QVector< double > &&data, const QString &name)
add a column with data from data, ownership of the memory behind data is transfered to the datastore
Definition jkqtpdatastorage.h:777
std::pair< size_t, size_t > addCopiedMap(TIterator first, TIterator last, const QString &nameKey=QString("map_key"), const QString &nameValue=QString("map_value"))
copies the contents of the map-like container c into two columns of the datastore,...
Definition jkqtpdatastorage.h:1229
virtual void setPlotFunctionFunctor(jkqtpPlotFunctionType &&__value)
sets a functor to be plotted
void setBoxplotColor(QColor c, JKQTBasePlotter *parent)
set the color of the graph (colors all elements, based on the given color c )
void setBoxWidthAbsolute(double __value)
width of box in pt.
void setMeanSize(double __value)
set the size (=diameter in pt) of the symbol for the mean (in pt)
void setWhiskerLineStyle(Qt::PenStyle __value)
set the line style of whisker lines
void setFillColor(const QColor &__value)
set the color of the graph filling
void setLineWidth(double __value)
set the line width of the graph line (in pt)
QColor getLineColor() const
get the color of the graph line
void setSymbolSize(double __value)
set the size (=diameter in pt) of the graph symbol (in pt)
void setSymbolType(JKQTPGraphSymbols __value)
set the type of the graph symbol
virtual void setTitle(const QString &__value)
sets the title of the plot (for display in key!).
void setDataColumn(int __value)
the column that contains the datapoints
@ X
the data for a JKQTPSingleColumnGraph is data belonging to the x-axis of the plot
Definition jkqtpgraphsbase.h:892
void setDataDirection(DataDirection __value)
interpret the data from dataColumn either as X- or Y-data
plots a 1-column set of data-values with symbols onto a JKQtPlotter/JKQtBasePlotter....
Definition jkqtpsinglecolumnsymbols.h:53
@ BeeSwarmScatter
missing coordinate scatters around position and the algorithm tries to prevent overlay of two symbols...
Definition jkqtpsinglecolumnsymbols.h:61
void setColor(QColor col)
set symbol color and fill color at the same time
void setPosition(double __value)
missing coordinate, i.e. if the data from dataColumn is interpreted as x-values, this is the y-positi...
void setPositionScatterStyle(ScatterStyle __value)
how to distribute the datapoints from dataColumn at the location position
This implements line plots where the data is taken from a user supplied function .
Definition jkqtpevaluatedfunction.h:289
void setYColumn(int __value)
the column that contains the y-component of the datapoints
void setXColumn(int __value)
the column that contains the x-component of the datapoints
plotter widget for scientific plots (uses JKQTBasePlotter to do the actual drawing)
Definition jkqtplotter.h:374
void zoomToFit(bool zoomX=true, bool zoomY=true, bool includeX0=false, bool includeY0=false, double scaleX=1.05, double scaleY=1.05)
this method zooms the graph so that all plotted datapoints are visible.
Definition jkqtplotter.h:1051
JKQTBasePlotter * getPlotter()
returns the JKQTBasePlotter object internally used for plotting
Definition jkqtplotter.h:414
size_t addGraph(JKQTPPlotElement *gr)
Definition jkqtplotter.h:796
JKQTPDatastore * getDatastore()
returns a pointer to the datastore used by this object
Definition jkqtplotter.h:621
@ JKQTPKeyInsideTopLeft
the key is positioned inside on the top-left
Definition jkqtptools.h:585