This project (see boxplot demonstrates how to use JKQTPlotter to draw box plots using the classes JKQTPBoxplotVerticalGraph and JKQTPBoxplotHorizontalGraph.
Note that this example explains how to add boxplots to a graph by hand, i.e. by calculating all the statistical properties for the boxplots by hand. The internal JKQTPlotter Statistics Library offers methods to perform these calculations, which are explained in the tutorial Advanced 1-Dimensional Statistics with JKQTPDatastore in detail. Additional advanced styling of boxplots is covered by the example Styling different aspects of boxplots.
The source code of the main application is (see boxplot.cpp.
After adding all necessary data to the JKQTDatastore:
QVector<double> POS, POSY, MEDIAN, MEAN, Q25, Q75, MIN, MAX;
POS << 1 << 4 << 7 << 10;
POSY << -1 << -2 << -3 << -4;
MIN << 2 << 3 << 2.5 << 6;
Q25 << 4 << 4.5 << 5 << 7;
MEDIAN << 5 << 6 << 7 << 9;
MEAN << 5.5 << 5.2 << 8 << 8;
Q75 << 6 << 7 << 9 << 11;
MAX << 8 << 7.5 << 11 << 12;
size_t columnPOS=ds->addCopiedColumn(POS, "POS");
size_t columnPOSY=ds->addCopiedColumn(POSY, "POSY");
size_t columnMIN=ds->addCopiedColumn(MIN, "MIN");
size_t columnQ25=ds->addCopiedColumn(Q25, "Q25");
size_t columnMEDIAN=ds->addCopiedColumn(MEDIAN, "MEDIAN");
size_t columnMEAN=ds->addCopiedColumn(MEAN, "MEAN");
size_t columnQ75=ds->addCopiedColumn(Q75, "Q75");
size_t columnMAX=ds->addCopiedColumn(MAX, "MAX");
... you can generate the JKQTPBoxplotVerticalGraph:
void setPercentile25Column(int __value)
the column that contains the 25% percentile-component of the datapoints
void setMinColumn(int __value)
the column that contains the minimum-component of the datapoints
void setPositionColumn(int __value)
the column that contains the x-component of the datapoints
void setMedianColumn(int __value)
the column that contains the median-component of the datapoints
void setMeanColumn(int __value)
the column that contains the median-component of the datapoints.
void setMaxColumn(int __value)
the column that contains the maximum-component of the datapoints
void setPercentile75Column(int __value)
the column that contains the 75% percentile-component of the datapoints
This implements vertical boxplots, optionally also a notched boxplot.
Definition jkqtpboxplot.h:102
virtual void setTitle(const QString &__value)
sets the title of the plot (for display in key!).
You can further style the plot by e.g. setting:
graphh->setFillColor(graphh->getLineColor().lighter());
graphh->setWhiskerLineStyle(Qt::DashLine);
graphh->setWhiskerLineColor(graphh->getLineColor().darker());
graphh->setWhiskerCapLineStyle(Qt::SolidLine);
graphh->setWhiskerCapLineColor(graphh->getLineColor().darker());
graphh->setWhiskerCapLineWidth(graphh->getLineWidth()*2.5);
graphh->setMeanFillColor(QColor("silver"));
graphh->setMedianLineColor(QColor("darkgreen"));
graphh->setBoxWidthRelative(0.75);
The result looks like this:
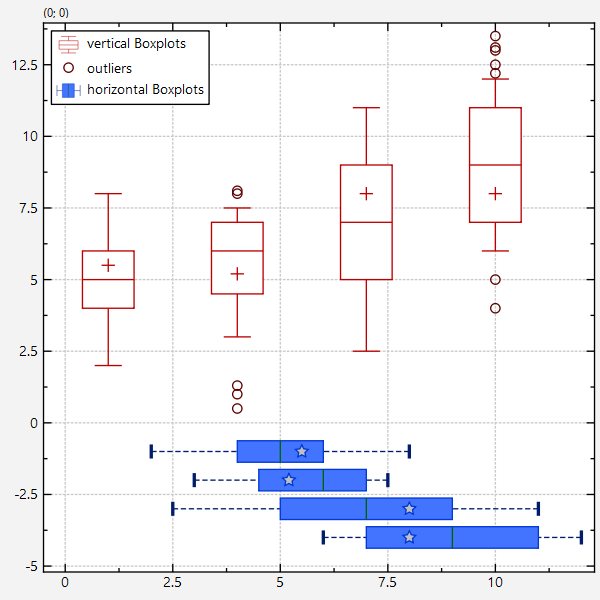
In addition to the simple box plots, the image above also shows outliers as small circles. these need to be drawn with a separate JKQTPXYLineGraph:
QVector<double> OUTLIERSX, OUTLIERSY;
OUTLIERSX << 4 << 4 << 4 << 4 << 4 << 10 << 10 << 10 << 10 << 10 << 10 << 10;
OUTLIERSY << 1 << 0.5 << 1.3 << 8 << 8.1 << 5 << 4 << 12.2 << 13 << 12.5 << 13.5 << 13.1;
...
size_t columnOUTLIERSX=ds->addCopiedColumn(OUTLIERSX, "OUTLIERSX");
size_t columnOUTLIERSY=ds->addCopiedColumn(OUTLIERSY, "OUTLIERSY");
...
graphOutliers->setXColumn(columnOUTLIERSX);
graphOutliers->setYColumn(columnOUTLIERSY);
graphOutliers->setTitle("outliers");
graphOutliers->setColor(graph->getColor().darker());
graphOutliers->setFillColor(QColor("white"));
graphOutliers->setDrawLine(false);
graphOutliers->setSymbolSize(7);
This implements xy line plots. This also alows to draw symbols at the data points.
Definition jkqtplines.h:61