JKQTPlotter trunk/v5.0.0
an extensive Qt5+Qt6 Plotter framework (including a feature-richt plotter widget, a speed-optimized, but limited variant and a LaTeX equation renderer!), written fully in C/C++ and without external dependencies
Loading...
Searching...
No Matches
Example (JKQTPlotter): Styling different aspects of boxplots

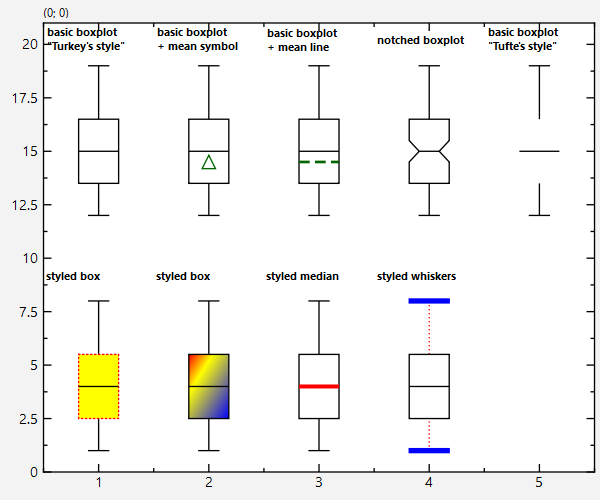
This project (see test_styledboxplot demonstrates how to style different aspects of boxplots and how to draw different types and styles of boxplots. For a simple introduction into how to use boxplots, see Plotting Box Plots and Plotting a Statistical Distribution of Data.

Note that this example explains how to style boxplots. The example Boxplots explains basics of how to create boxplots. The internal JKQTPlotter Statistics Library offers methods to calculate the statistical properties necessary for boxplots, which is explained in the tutorial Advanced 1-Dimensional Statistics with JKQTPDatastore in detail.

The link http://vita.had.co.nz/papers/boxplots.pdf leads to a paper that described the history and different types of boxplots.

The source code of the main application can be found in test_styledboxplot.cpp. The major parts that are concerned with the styling are:

// 2. create a basic boxplot
plot.addGraph(graphBoxPlot=new JKQTPBoxplotVerticalElement(&plot));
plot.addGraph(new JKQTPGeoText(&plot, x-dx/2.0, y0+9, "\\textbf{\\begin{matrix}basic boxplot\\\\\"Turkey's style\"\\end{matrix}}", 8, QColor("black")));
graphBoxPlot->setPos(x);
graphBoxPlot->setMin(y0+1);
graphBoxPlot->setPercentile25(y0+2.5);
graphBoxPlot->setMedian(y0+4);
graphBoxPlot->setPercentile75(y0+5.5);
graphBoxPlot->setMax(y0+8);
// set color of all elements
graphBoxPlot->setBoxplotColor(QColor("black"),QColor("white"), plot.getPlotter());
// ...
// ...
// 3. create a basic boxplot with mean as symbol
// ...
// set mean value to show mean symbol
graphBoxPlot->setMean(y0+3.5);
graphBoxPlot->setDrawMean(true);
graphBoxPlot->setMeanMode(JKQTPGraphBoxplotStyleMixin::MeanAsSymbol);
graphBoxPlot->setMeanColor(QColor("darkgreen"));
graphBoxPlot->setMeanSymbolType(JKQTPFilledTriangle);
// ...
// ...
// 4. create a basic boxplot with mean as line
// ...
// set mean value to show mean symbol
graphBoxPlot->setMean(y0+3.5);
graphBoxPlot->setDrawMean(true);
graphBoxPlot->setMeanMode(JKQTPGraphBoxplotStyleMixin::MeanAsLine);
graphBoxPlot->setMeanColor(QColor("darkgreen"));
graphBoxPlot->setMeanLineStyle(Qt::DashLine);
graphBoxPlot->setMeanLineWidth(2);
// ...
// ...
// 5. create a notched boxplot
// ...
// for a notched plot, you need to set the confidence interval
graphBoxPlot->setMedianConfidenceIntervalWidth(1);
graphBoxPlot->setDrawNotch(true);
graphBoxPlot->setRelativeNotchIndent(y0+0.5);
// ...
// ...
// 6. create a notched boxplot
// ...
// restyle as Tufte's box-less
graphBoxPlot->setDrawBox(false);
// ...
// ...
// 7. style box
// ...
// style box line&fill
graphBoxPlot->setLineColor(QColor("red"));
graphBoxPlot->setLineStyle(Qt::DotLine);
graphBoxPlot->setLineWidth(1);
graphBoxPlot->setFillColor(QColor("yellow"));
// ...
// ...
// 8. fancy style box
// ...
// style box fill
QLinearGradient linearGrad(QPointF(0, 0), QPointF(1, 1));
QColor c1(Qt::red);
QColor c2(Qt::yellow);
QColor c3(Qt::blue);
linearGrad.setColorAt(0, c1);
linearGrad.setColorAt(0.3, c2);
linearGrad.setColorAt(1, c3);
// use this CoordinateMode, so the gradient fills the whole graph area
linearGrad.setCoordinateMode(QGradient::ObjectBoundingMode);
graphBoxPlot->setFillGradient(linearGrad);
// ...
// ...
// 9. style median
// ...
// style box line
graphBoxPlot->setMedianLineColor(QColor("red"));
graphBoxPlot->setMedianLineWidth(3);
// ...
// ...
// 10. style whiskers&caps
// ...
// style box line
graphBoxPlot->setWhiskerLineColor(QColor("red"));
graphBoxPlot->setWhiskerLineStyle(Qt::DotLine);
graphBoxPlot->setWhiskerLineWidth(1);
graphBoxPlot->setWhiskerCapLineColor(QColor("blue"));
graphBoxPlot->setWhiskerCapLineStyle(Qt::SolidLine);
graphBoxPlot->setWhiskerCapLineWidth(4);
graphBoxPlot->setRelativeWhiskerWidth(0.9);
This implements a single vertical (notched) boxplot as a "geometric element", where the data is direc...
Definition jkqtpboxplot.h:188
This JKQTPPlotAnnotationElement is used to display text. It uses the JKQTMathText class in order to d...
Definition jkqtpgeoannotations.h:185
@ MeanAsLine
draw mean as a lie (specified by the pen settings in JKQTPGraphSymbolStyleMixin)
Definition jkqtpboxplotstylingmixins.h:204
@ MeanAsSymbol
draw mean as a symbol (specified by the settings in JKQTPGraphSymbolStyleMixin)
Definition jkqtpboxplotstylingmixins.h:203
@ JKQTPFilledTriangle
a filled triangle (tip at top)
Definition jkqtpdrawingtools.h:153

The result looks like this:

test_styledboxplot