|
JKQTPlotter trunk/v5.0.0
an extensive Qt5+Qt6 Plotter framework (including a feature-richt plotter widget, a speed-optimized, but limited variant and a LaTeX equation renderer!), written fully in C/C++ and without external dependencies
|
|
JKQTPlotter trunk/v5.0.0
an extensive Qt5+Qt6 Plotter framework (including a feature-richt plotter widget, a speed-optimized, but limited variant and a LaTeX equation renderer!), written fully in C/C++ and without external dependencies
|
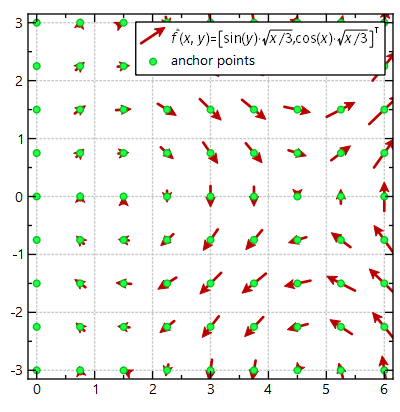
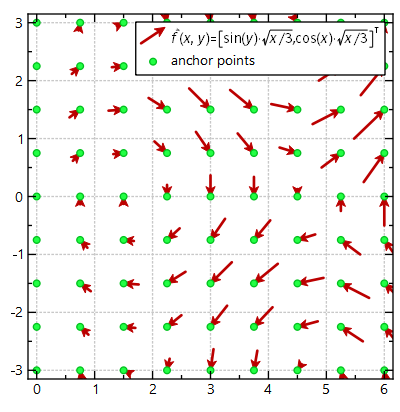
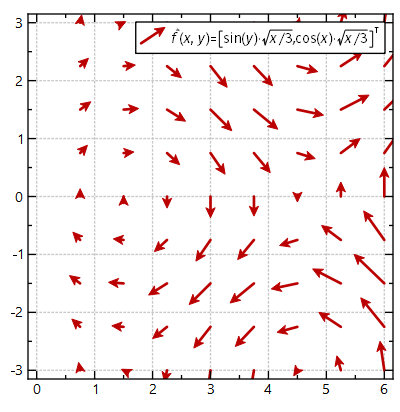
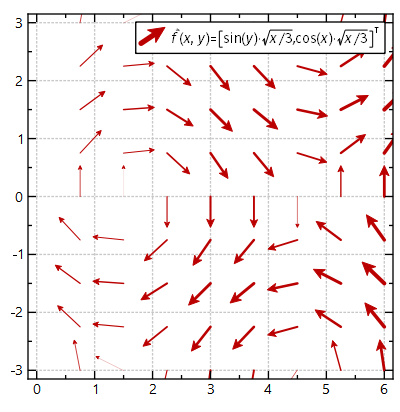
This graph plots a vector field, i.e. a set of vectors (dx,dy) or (angle,length) at positions (x,y). This class immplements the most basic form of vector plot, i.e. the vector are drawn with a length corresponding to their magnitude. More...
#include <jkqtpvectorfield.h>
Public Types | |
| enum | VectorAnchorPoint { AnchorBottom , AnchorMid , AnchorTip } |
indicates the position of the point | |
| enum | VectorLengthMode { AutoscaleLength , LengthFromData , IgnoreLength } |
| indicates how the drawn vector's length is calculated from the data More... | |
| enum | VectorLineWidthMode { DefaultVectorLineWidth , AutoscaleLineWidthFromLength } |
| describes how the line width scales with the vector properties (or not) More... | |
| Public Types inherited from JKQTPXYAndVectorGraph | |
| enum | VectorDataLayout { DeltaXDeltaYLayout , AngleAndLengthLayout , DefaultVectorDataLayout =DeltaXDeltaYLayout } |
| values from this enum indicates how to interpret the data columns provided to this graph More... | |
| Public Types inherited from JKQTPXYGraph | |
| enum | DataSortOrder { Unsorted =0 , SortedX =1 , SortedY =2 } |
| specifies how to sort the data in a JKQTPXYGraph before drawing More... | |
| Public Types inherited from JKQTPPlotElement | |
| enum | HitTestMode { HitTestXY , HitTestXOnly , HitTestYOnly } |
| modes of operation for the function hitTest() More... | |
Public Member Functions | |
| JKQTPVectorFieldGraph (JKQTBasePlotter *parent=nullptr) | |
| class constructor | |
| JKQTPVectorFieldGraph (JKQTPlotter *parent) | |
| class constructor | |
| virtual void | draw (JKQTPEnhancedPainter &painter) override |
| plots the graph to the plotter object specified as parent | |
| virtual void | drawKeyMarker (JKQTPEnhancedPainter &painter, const QRectF &rect) override |
| plots a key marker inside the specified rectangle rect | |
| VectorAnchorPoint | getAnchorPoint () const |
| defines where the vector is anchored | |
| double | getAutoscaleLengthFactor () const |
a scaling factor that can be used to modify the result of the autoscaling algorithm (m_vectorLengthMode ==AutoscaleLength) | |
| virtual QColor | getKeyLabelColor () const override |
| returns the color to be used for the key label | |
| double | getLengthScaleFactor () const |
if m_vectorLengthMode ==false, this is the scale-factor used to calculate the vector length | |
| double | getMinLineWIdth () const |
| minimum line-width in pt, used for some modes of m_vectorLineWidthMode | |
| VectorLengthMode | getVectorLengthMode () const |
| indicates how the length of the drawn vectors are determined from the data | |
| VectorLineWidthMode | getVectorLineWidthMode () const |
| determines how the line width of the vectors is derived. | |
| void | setAnchorPoint (VectorAnchorPoint newAnchorPoint) |
| defines where the vector is anchored | |
| void | setAutoscaleLengthFactor (double newAutoscaleLengthFactor) |
a scaling factor that can be used to modify the result of the autoscaling algorithm (m_vectorLengthMode ==AutoscaleLength) | |
| void | setLengthScaleFactor (double newLengthScaleFactor) |
if m_vectorLengthMode ==false, this is the scale-factor used to calculate the vector length | |
| void | setMinLineWidth (double lw) |
| minimum line-width in pt, used for some modes of m_vectorLineWidthMode | |
| void | setVectorLengthMode (VectorLengthMode newMode) |
| indicates how the length of the drawn vectors are determined from the data | |
| void | setVectorLineWidthMode (VectorLineWidthMode m) |
| determines how the line width of the vectors is derived. | |
| Public Member Functions inherited from JKQTPXYAndVectorGraph | |
| JKQTPXYAndVectorGraph (JKQTBasePlotter *parent=nullptr) | |
| class constructor | |
| virtual QString | formatHitTestDefaultLabel (double x, double y, int index=-1, const JKQTPDatastore *datastore=nullptr) const override |
| tool-function for hitTest(), which formats a default label, taking into account the x- and y-position (both provided) and optionally the errors of these positions. | |
| int | getAngleColumn () const |
| the column that contains the rotation angle [in radian] | |
| int | getDxColumn () const |
| the column that contains the delta along the x-axis. | |
| int | getDyColumn () const |
| the column that contains the delta along the y-axis. | |
| int | getLengthColumn () const |
| the column that contains the vector length | |
| VectorDataLayout | getVectorDataLayout () const |
| indicates, which column pairs to use (dxColumn, dyColumn), (angleColumn, lengthColumn), ... | |
| virtual bool | getXMinMax (double &minx, double &maxx, double &smallestGreaterZero) override |
| get the maximum and minimum x-value of the graph | |
| virtual bool | getYMinMax (double &miny, double &maxy, double &smallestGreaterZero) override |
| get the maximum and minimum y-value of the graph | |
| virtual double | hitTest (const QPointF &posSystem, QPointF *closestSpotSystem=nullptr, QString *label=nullptr, HitTestMode mode=HitTestXY) const override |
| Implmentation of JKQTPPlotElement::hitTest(), which searches through all graph points defined by xColumn and yColumn and returns a general x/y-label, also taking into account possibly known errors to the graphs (if it is derived from JKQTPXGraphErrorData and/or JKQTPYGraphErrorData. | |
| virtual bool | usesColumn (int column) const override |
returns true if the given column is used by the graph | |
| Public Member Functions inherited from JKQTPXYGraph | |
| JKQTPXYGraph (JKQTBasePlotter *parent=nullptr) | |
| class constructor | |
| DataSortOrder | getDataSortOrder () const |
if !=Unsorted, the data is sorted before plotting | |
| virtual int | getKeyColumn () const |
| returns the column used as "key" for the current graph (typically this call getXColumn(), but for horizontal graphs like filled curves or barcharts it may call getYColumn() ) | |
| virtual int | getValueColumn () const |
| returns the column used as "value" for the current graph (typically this call getXColumn(), but for horizontal graphs like filled curves or barcharts it may call getYColumn() ) | |
| int | getXColumn () const |
| the column that contains the x-component of the datapoints | |
| int | getYColumn () const |
| the column that contains the y-component of the datapoints | |
| Public Member Functions inherited from JKQTPGraph | |
| JKQTPGraph (JKQTBasePlotter *parent=nullptr) | |
| class constructor | |
| virtual | ~JKQTPGraph ()=default |
| default wirtual destructor | |
| Public Member Functions inherited from JKQTPPlotElement | |
| JKQTPPlotElement (JKQTBasePlotter *parent=nullptr) | |
| class constructor | |
| virtual | ~JKQTPPlotElement ()=default |
| default wirtual destructor | |
| QPointF | backTransform (const QPointF &x) const |
| tool routine that back-transforms a QPointF according to the parent's transformation rules (pixels --> plot coordinate) | |
| QPointF | backTransform (double x, double y) const |
| tool routine that back-transforms a QPointF according to the parent's transformation rules (pixels --> plot coordinate) | |
| double | backtransformX (double x) const |
| tool routine that backtransforms an x-coordinate (pixels --> plot coordinate) for this plot element, uses the axis referenced in xAxisRef | |
| double | backtransformY (double y) const |
| tool routine that backtransforms a y-coordinate (pixels --> plot coordinate) for this plot element, uses the axis referenced in yAxisRef | |
| virtual void | drawOutside (JKQTPEnhancedPainter &painter, QRect leftSpace, QRect rightSpace, QRect topSpace, QRect bottomSpace) |
| plots outside the actual plot field of view (e.g. color bars, scale bars, ...) | |
| QImage | generateKeyMarker (QSize size=QSize(16, 16)) |
| returns an image with a key marker inside | |
| virtual void | getOutsideSize (JKQTPEnhancedPainter &painter, int &leftSpace, int &rightSpace, int &topSpace, int &bottomSpace) |
| if the graph plots outside the actual plot field of view (e.g. color bars, scale bars, ...) | |
| JKQTBasePlotter * | getParent () |
| returns the parent painter class | |
| const JKQTBasePlotter * | getParent () const |
| returns the parent painter class | |
| QString | getTitle () const |
| returns the the title of the plot | |
| const JKQTPCoordinateAxis * | getXAxis () const |
| returns the actual x-Axis-object from the parent plotter, referenced in xAxisRef | |
| JKQTPCoordinateAxisRef | getXAxisRef () const |
| indicates which coordinate axis to use for coordinate transforms in x-direction | |
| const JKQTPCoordinateAxis * | getYAxis () const |
| returns the actual y-Axis-object from the parent plotter, referenced in yAxisRef | |
| JKQTPCoordinateAxisRef | getYAxisRef () const |
| indicates which coordinate axis to use for coordinate transforms in y-direction | |
| bool | isHighlighted () const |
| returns whether the graph is shown in a highlighted style in the plot | |
| bool | isVisible () const |
| returns whether the graph is visible in the plot | |
| void | setAxes (JKQTPCoordinateAxisRef ref) |
| set the coordinate axes to use for this plot element | |
| virtual void | setParent (JKQTBasePlotter *parent) |
| sets the parent painter class | |
| virtual void | setParent (JKQTPlotter *parent) |
| sets the parent painter class | |
| void | setXAxis (JKQTPCoordinateAxisRef ref) |
| indicates which coordinate axis to use for coordinate transforms in x-direction | |
| void | setYAxis (JKQTPCoordinateAxisRef ref) |
| indicates which coordinate axis to use for coordinate transforms in y-direction | |
| QPointF | transform (const QPointF &x) const |
| tool routine that transforms a QPointF according to the parent's transformation rules (plot coordinate --> pixels) | |
| QPolygonF | transform (const QPolygonF &x) const |
| tool routine that transforms a QPolygonF according to the parent's transformation rules (plot coordinate --> pixels) | |
| QPointF | transform (double x, double y) const |
| tool routine that transforms a QPointF according to the parent's transformation rules (plot coordinate --> pixels) | |
| QPainterPath | transformToLinePath (const QPolygonF &x) const |
| tool routine that transforms a QPolygonF according to the parent's transformation rules and returns a (non-closed) path consisting of lines (plot coordinate --> pixels) | |
| QVector< double > | transformX (const QVector< double > &x) const |
| transform all x-coordinates in a vector x | |
| double | transformX (double x) const |
| tool routine that transforms an x-coordinate (plot coordinate --> pixels) for this plot element, uses the axis referenced in xAxisRef | |
| QVector< double > | transformY (const QVector< double > &x) const |
| transform all y-coordinates in a vector x | |
| double | transformY (double y) const |
| tool routine that transforms a y-coordinate (plot coordinate --> pixels) for this plot element, uses the axis referenced in yAxisRef | |
| Public Member Functions inherited from JKQTPGraphDecoratedLineStyleMixin | |
| JKQTPGraphDecoratedLineStyleMixin () | |
| class constructor | |
| virtual | ~JKQTPGraphDecoratedLineStyleMixin () |
| double | calcHeadDecoratorSize (double line_width) const |
| calculates the tail decorator size from the line width line_width, using m_headDecoratorSizeFactor and a non-linear scaling function | |
| double | calcTailDecoratorSize (double line_width) const |
| calculates the tail decorator size from the line width line_width, using m_tailDecoratorSizeFactor and a non-linear scaling function | |
| double | getHeadDecoratorSizeFactor () const |
| head decorator size-factor, used to calculate the size of the arrow from the line width | |
| JKQTPLineDecoratorStyle | getHeadDecoratorStyle () const |
| get the head decorator style | |
| double | getTailDecoratorSizeFactor () const |
| tail decorator size-factor, used to calculate the size of the arrow from the line width | |
| JKQTPLineDecoratorStyle | getTailDecoratorStyle () const |
| get the tail decorator style | |
| void | initDecoratedLineStyle (JKQTBasePlotter *parent, int &parentPlotStyle, JKQTPPlotStyleType styletype=JKQTPPlotStyleType::Default) |
| initiaize the line style (from the parent plotter) | |
| void | setHeadDecoratorSizeFactor (const double &__value) |
| head decorator size-factor, used to calculate the size of the arrow from the line width | |
| void | setHeadDecoratorStyle (const JKQTPLineDecoratorStyle &__value) |
| set the head decorator style | |
| void | setTailDecoratorSizeFactor (const double &__value) |
| tail decorator size-factor, used to calculate the size of the arrow from the line width | |
| void | setTailDecoratorStyle (const JKQTPLineDecoratorStyle &__value) |
| set the tail decorator style | |
| Public Member Functions inherited from JKQTPGraphLineStyleMixin | |
| JKQTPGraphLineStyleMixin () | |
| class constructor | |
| virtual | ~JKQTPGraphLineStyleMixin () |
| QColor | getHighlightingLineColor () const |
| get the color of the graph line when highlighted | |
| QPen | getHighlightingLinePen (JKQTPEnhancedPainter &painter, JKQTBasePlotter *parent) const |
| constructs a QPen from the line styling properties | |
| QPen | getHighlightingLinePenForRects (JKQTPEnhancedPainter &painter, JKQTBasePlotter *parent) const |
| constructs a QPen from the line styling properties, suitable for drawing rectangle with sharp corners | |
| QPen | getKeyLinePen (JKQTPEnhancedPainter &painter, const QRectF &rect, JKQTBasePlotter *parent) const |
| constructs a QPen from the line styling properties, but uses getKeyLineWidthPx() for the width, i.e. constructs a pen for drawing lines in key-symbols | |
| double | getKeyLineWidthPx (JKQTPEnhancedPainter &painter, const QRectF &keyRect, const JKQTBasePlotter *parent) const |
| returns the linewidth for drawing lines in a key entry with keyRect for the symbol, using painter and parent . | |
| QBrush | getLineBrush () const |
| gets the brush used to fill the line area | |
| Qt::PenCapStyle | getLineCapStyle () const |
| gets the cap style | |
| QColor | getLineColor () const |
| get the color of the graph line | |
| qreal | getLineDashOffset () const |
| returns the dash offset for a custom dash style | |
| QVector< qreal > | getLineDashPattern () const |
| gets the dash pattern for a custom dash style | |
| Qt::PenJoinStyle | getLineJoinStyle () const |
| returns the join style | |
| QPen | getLinePen (JKQTPEnhancedPainter &painter, JKQTBasePlotter *parent) const |
| constructs a QPen from the line styling properties | |
| QPen | getLinePenForRects (JKQTPEnhancedPainter &painter, JKQTBasePlotter *parent) const |
| constructs a QPen from the line styling properties, suitable for drawing rectangles with sharp edges | |
| Qt::PenStyle | getLineStyle () const |
| get the style of the graph line | |
| double | getLineWidth () const |
| get the line width of the graph line (in pt) | |
| void | initLineStyle (JKQTBasePlotter *parent, int &parentPlotStyle, JKQTPPlotStyleType styletype=JKQTPPlotStyleType::Default) |
| initiaize the line style (from the parent plotter) | |
| void | setHighlightingLineColor (const QColor &__value) |
| set the color of the graph line when highlighted | |
| void | setHighlightingLineColor (const QColor &__value, double alpha) |
| set the color of the graph line when highlighted | |
| void | setLineBrush (const QBrush &style) |
| sets the brush used to fill the line area | |
| void | setLineCapStyle (Qt::PenCapStyle style) |
| sets the cap style | |
| void | setLineColor (const QColor &__value) |
| set the color of the graph line | |
| void | setLineColor (const QColor &__value, double alpha) |
| set the color of the graph line | |
| void | setLineColorInvertedFrom (QColor __noninvertedColor) |
| sets the line-color as an inverted version of the given color | |
| void | setLineDashOffset (qreal offset) |
| sets the dash offset for a custom dash style | |
| void | setLineDashPattern (const QVector< qreal > &pattern) |
| sets the dash pattern for a custom dash style | |
| void | setLineJoinStyle (Qt::PenJoinStyle style) |
| sets the join style | |
| void | setLineStyle (Qt::PenStyle __value) |
| set the style of the graph line | |
| void | setLineWidth (double __value) |
| set the line width of the graph line (in pt) | |
Protected Member Functions | |
| virtual QColor | getLocalVectorColor (int i, double x, double y, double dx, double dy) const |
| internal color functor, a customization point for derived classes | |
| double | getMaxVecLen () const |
| acess to internally calculated (before draw() actually draws) maximum vector length | |
| double | getMinVecLen () const |
| acess to internally calculated (before draw() actually draws) minimum vector length | |
| Protected Member Functions inherited from JKQTPXYAndVectorGraph | |
| virtual bool | getIndexRange (int &imin, int &imax) const override |
| determines the range of row indexes available in the data columns of this graph | |
| double | getVectorAngle (int i) const |
| QPointF | getVectorDxDy (int i) const |
this function interprets vectorDataLayout together with (dxColumn, dyColumn) or (angleColumn, lengthColumn) or ... and returns the i -th vectors  | |
| double | getVectorMagnitude (int i) const |
| Protected Member Functions inherited from JKQTPXYGraph | |
| int | getDataIndex (int i) const |
| returns the index of the i-th datapoint (where i is an index into the SORTED datapoints) | |
| virtual void | intSortData () |
| sorts data according to the specified criterion in sortData ... The result is stored as a index-map in sorted Indices | |
| Protected Member Functions inherited from JKQTPGraph | |
| virtual void | drawErrorsAfter (JKQTPEnhancedPainter &) |
| this function is used to plot error inidcators after plotting the graphs. | |
| virtual void | drawErrorsBefore (JKQTPEnhancedPainter &) |
| this function is used to plot error inidcators before plotting the graphs. | |
| bool | getDataMinMax (int column, double &minx, double &maxx, double &smallestGreaterZero) |
| get the maximum and minimum value of the given column | |
| Protected Member Functions inherited from JKQTPPlotElement | |
| void | addHitTestData (const HitTestLocation &loc) |
| clear the internal datastore for hitTest() | |
| void | addHitTestData (const QPointF &pos_, const QString &label_) |
| clear the internal datastore for hitTest() | |
| void | addHitTestData (const QPointF &pos_, int index_, const QString &label_) |
| clear the internal datastore for hitTest() | |
| void | addHitTestData (const QPointF &pos_, int index_=-1, const JKQTPDatastore *datastore=nullptr) |
| clear the internal datastore for hitTest(), this variant uses formatHitTestDefaultLabel() to auto-generate the label | |
| void | addHitTestData (double x_, double y_, const QString &label_) |
| add a new point on the graph to the internal datastore for hitTest() | |
| void | addHitTestData (double x_, double y_, int index_, const QString &label_) |
| clear the internal datastore for hitTest() | |
| void | addHitTestData (double x_, double y_, int index_=-1, const JKQTPDatastore *datastore=nullptr) |
| add a new point on the graph to the internal datastore for hitTest(), this variant uses formatHitTestDefaultLabel() to auto-generate the label | |
| void | clearHitTestData () |
| clear the internal datastore for hitTest() | |
| void | reserveHitTestData (int points) |
| reserve list entries for up to points graph points in the internal datastore for hitTest() | |
| QString | xFloatToString (double v, int past_comma=-1) const |
| converts a x-value v into a string, taking into account the type of x-axis | |
| QString | yFloatToString (double v, int past_comma=-1) const |
| converts a x-value v into a string, taking into account the type of x-axis | |
Properties | |
| VectorAnchorPoint | anchorPoint |
| bool | autoscaleLengthFactor |
| double | lengthScaleFactor |
| double | minLineWidth |
| VectorLengthMode | vectorLengthMode |
| VectorLineWidthMode | vectorLineWidthMode |
| Properties inherited from JKQTPXYAndVectorGraph | |
| int | angleColumn |
| the column that contains the rotation angle [in radian] | |
| int | dxColumn |
| the column that contains the delta along the x-axis. | |
| int | dyColumn |
| the column that contains the delta along the y-axis. | |
| int | lengthColumn |
| the column that contains the vector length | |
| VectorDataLayout | vectorDataLayout |
| indicates, which column pairs to use (dxColumn, dyColumn), (angleColumn, lengthColumn), ... | |
| Properties inherited from JKQTPXYGraph | |
| DataSortOrder | sortData |
if !=Unsorted, the data is sorted before plotting | |
| int | xColumn |
| the column that contains the x-component of the datapoints | |
| int | yColumn |
| the column that contains the y-component of the datapoints | |
| Properties inherited from JKQTPPlotElement | |
| bool | highlighted |
| indicates whether the graph is shown in a "highlghted" in the plot | |
| QString | title |
| title of the plot (for display in key!). If no title is supplied, no key entry is drawn. | |
| bool | visible |
| indicates whether the graph is visible in the plot | |
| JKQTPCoordinateAxisRef | xAxisRef |
| indicates which coordinate axis to use for coordinate transforms in x-direction | |
| JKQTPCoordinateAxisRef | yAxisRef |
| indicates which coordinate axis to use for coordinate transforms in y-direction | |
| Properties inherited from JKQTPGraphDecoratedLineStyleMixin | |
| double | headDecoratorSizeFactor |
| JKQTPLineDecoratorStyle | headDecoratorStyle |
| double | tailDecoratorSizeFactor |
| JKQTPLineDecoratorStyle | tailDecoratorStyle |
| Properties inherited from JKQTPGraphLineStyleMixin | |
| QColor | highlightingLineColor |
| QColor | lineColor |
| Qt::PenStyle | lineStyle |
| double | lineWidth |
Private Attributes | |
| VectorAnchorPoint | m_anchorPoint |
| defines where the vector is anchored | |
| double | m_autoscaleLengthFactor |
a scaling factor that can be used to modify the result of the autoscaling algorithm (m_vectorLengthMode ==AutoscaleLength) | |
| double | m_lengthScaleFactor |
if m_vectorLengthMode ==false, this is the scale-factor used to calculate the vector length | |
| double | m_maxVecLen |
| internally calculated (before draw() actually draws) maximum vector length | |
| double | m_minLineWidth |
| minimum line-width in pt, used for some modes of m_vectorLineWidthMode | |
| double | m_minVecLen |
| internally calculated (before draw() actually draws) minimum vector length | |
| VectorLengthMode | m_vectorLengthMode |
| indicates how the length of the drawn vectors are determined from the data | |
| VectorLineWidthMode | m_vectorLineWidthMode |
| determines how the line width of the vectors is derived. | |
Additional Inherited Members | |
| Public Slots inherited from JKQTPXYAndVectorGraph | |
| void | setAngleAndLengthColumn (int colAngle, int colLength) |
| det angleColumn and lengthColumn column at the same time! ALso ensures that vectorDataLayout is set accordingly. | |
| void | setAngleColumn (int col) |
| the column that contains the rotation angle [in radian] | |
| void | setDxColumn (int col) |
| the column that contains the delta along the x-axis. | |
| void | setDxDyColumn (int colDx, int colDy) |
| det dxColumn and dyColumn column at the same time! ALso ensures that vectorDataLayout is set accordingly. | |
| void | setDyColumn (int col) |
| the column that contains the delta along the y-axis. | |
| void | setLengthColumn (int col) |
| the column that contains the vector length | |
| Public Slots inherited from JKQTPXYGraph | |
| void | setDataSortOrder (DataSortOrder __value) |
if !=Unsorted, the data is sorted before plotting | |
| void | setDataSortOrder (int __value) |
if !=Unsorted, the data is sorted before plotting | |
| virtual void | setKeyColumn (int __value) |
| sets the column used as "key" for the current graph (typically this call setXColumn(), but for horizontal graphs like filled curves or barcharts it may call setYColumn() ) | |
| virtual void | setValueColumn (int __value) |
| sets the column used as "value" for the current graph (typically this call setXColumn(), but for horizontal graphs like filled curves or barcharts it may call setYColumn() ) | |
| void | setXColumn (int __value) |
| the column that contains the x-component of the datapoints | |
| void | setXColumn (size_t __value) |
| the column that contains the x-component of the datapoints | |
| void | setXYColumns (int xCol, int yCol) |
| sets xColumn and yColumn at the same time | |
| void | setXYColumns (QPair< int, int > xyColPair) |
| sets xColumn and yColumn at the same time | |
| void | setXYColumns (QPair< size_t, size_t > xyColPair) |
| sets xColumn and yColumn at the same time | |
| void | setXYColumns (size_t xCol, size_t yCol) |
| sets xColumn and yColumn at the same time | |
| void | setYColumn (int __value) |
| the column that contains the y-component of the datapoints | |
| void | setYColumn (size_t __value) |
| the column that contains the y-component of the datapoints | |
| Public Slots inherited from JKQTPPlotElement | |
| void | setHighlighted (bool __value) |
| sets whether the graph is drawn in a highlighted style in the plot | |
| virtual void | setTitle (const QString &__value) |
| sets the title of the plot (for display in key!). | |
| void | setVisible (bool __value) |
| sets whether the graph is visible in the plot | |
| Static Protected Member Functions inherited from JKQTPXYAndVectorGraph | |
| static double | getVectorAngle (const QPointF &v) |
calculates the rotation angle (3 o'clock is 0) in radians ![$ [0...2\pi] $](form_259_dark.png) | |
| static double | getVectorMagnitude (const QPointF &v) |
| calculates the magnitude/length of a vector v | |
| Protected Attributes inherited from JKQTPXYGraph | |
| QVector< int > | sortedIndices |
| this array contains the order of indices, in which to access the data in the data columns | |
| Protected Attributes inherited from JKQTPPlotElement | |
| QVector< HitTestLocation > | m_hitTestData |
| dataset with graph-points and associated data from the function hitTest() | |
| JKQTBasePlotter * | parent |
| the plotter object this object belongs to | |
| int | parentPlotStyle |
| internal storage for the used parent plot style | |
This graph plots a vector field, i.e. a set of vectors (dx,dy) or (angle,length) at positions (x,y). This class immplements the most basic form of vector plot, i.e. the vector are drawn with a length corresponding to their magnitude.
To achieve this, use code like this:
You have several options to influence the way the vectors are drawn:
indicates how the drawn vector's length is calculated from the data
describes how the line width scales with the vector properties (or not)
| Enumerator | |
|---|---|
| DefaultVectorLineWidth | line width is equal to JKQTPGraphLineStyleMixin::getLineWidth() for all vectors 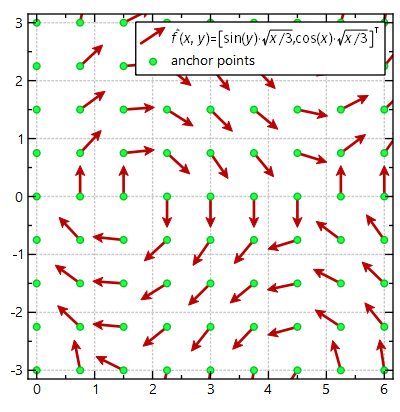
|
| AutoscaleLineWidthFromLength | line width is determined from the vector length. The maximum line width is given by JKQTPGraphLineStyleMixin::getLineWidth() and the minim line width by getMinLineWidth() 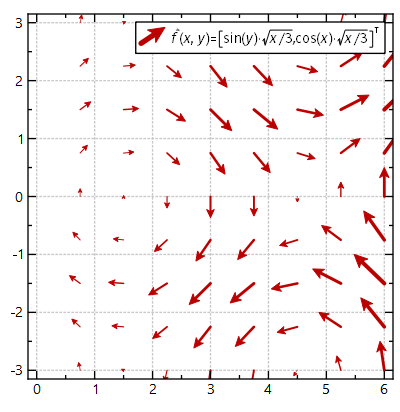
|
|
explicit |
class constructor
| JKQTPVectorFieldGraph::JKQTPVectorFieldGraph | ( | JKQTPlotter * | parent | ) |
class constructor
|
overridevirtual |
plots the graph to the plotter object specified as parent
Implements JKQTPPlotElement.
Reimplemented in JKQTPParametrizedVectorFieldGraph.
|
overridevirtual |
plots a key marker inside the specified rectangle rect
Implements JKQTPPlotElement.
Reimplemented in JKQTPParametrizedVectorFieldGraph.
| VectorAnchorPoint JKQTPVectorFieldGraph::getAnchorPoint | ( | ) | const |
defines where the vector is anchored
| double JKQTPVectorFieldGraph::getAutoscaleLengthFactor | ( | ) | const |
a scaling factor that can be used to modify the result of the autoscaling algorithm (m_vectorLengthMode ==AutoscaleLength)
The vector length is further scaled by this value.
|
overridevirtual |
returns the color to be used for the key label
Implements JKQTPPlotElement.
| double JKQTPVectorFieldGraph::getLengthScaleFactor | ( | ) | const |
if m_vectorLengthMode ==false, this is the scale-factor used to calculate the vector length
|
protectedvirtual |
internal color functor, a customization point for derived classes
Overwrite this in a derived class to be able to color each vector differently
Reimplemented in JKQTPParametrizedVectorFieldGraph.
|
inlineprotected |
acess to internally calculated (before draw() actually draws) maximum vector length
| double JKQTPVectorFieldGraph::getMinLineWIdth | ( | ) | const |
minimum line-width in pt, used for some modes of m_vectorLineWidthMode
|
inlineprotected |
acess to internally calculated (before draw() actually draws) minimum vector length
| VectorLengthMode JKQTPVectorFieldGraph::getVectorLengthMode | ( | ) | const |
indicates how the length of the drawn vectors are determined from the data
Several modes are possible:
== LengthFromData the vector is drawn from 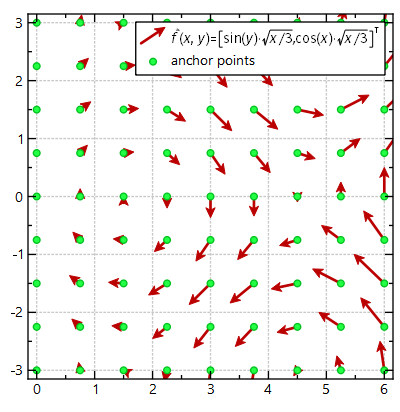
== AutoscaleLength the vector is drawn to q90VectorLength : autoscale=plotwidth/VectorPerWidth/q90VectorLength . 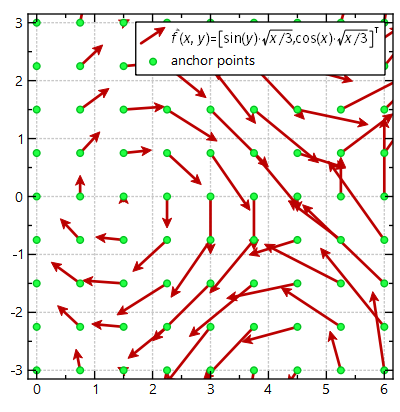
== IgnoreLength all vectors are drawn with the same length, which is determined from autoscale*m_autoscaleLengthFactor where autoscale is defined as above.
| VectorLineWidthMode JKQTPVectorFieldGraph::getVectorLineWidthMode | ( | ) | const |
determines how the line width of the vectors is derived.
| void JKQTPVectorFieldGraph::setAnchorPoint | ( | VectorAnchorPoint | newAnchorPoint | ) |
defines where the vector is anchored
| void JKQTPVectorFieldGraph::setAutoscaleLengthFactor | ( | double | newAutoscaleLengthFactor | ) |
a scaling factor that can be used to modify the result of the autoscaling algorithm (m_vectorLengthMode ==AutoscaleLength)
The vector length is further scaled by this value.
| void JKQTPVectorFieldGraph::setLengthScaleFactor | ( | double | newLengthScaleFactor | ) |
if m_vectorLengthMode ==false, this is the scale-factor used to calculate the vector length
| void JKQTPVectorFieldGraph::setMinLineWidth | ( | double | lw | ) |
minimum line-width in pt, used for some modes of m_vectorLineWidthMode
| void JKQTPVectorFieldGraph::setVectorLengthMode | ( | VectorLengthMode | newMode | ) |
indicates how the length of the drawn vectors are determined from the data
Several modes are possible:
== LengthFromData the vector is drawn from == AutoscaleLength the vector is drawn to q90VectorLength : autoscale=plotwidth/VectorPerWidth/q90VectorLength .
== IgnoreLength all vectors are drawn with the same length, which is determined from autoscale*m_autoscaleLengthFactor where autoscale is defined as above.
| void JKQTPVectorFieldGraph::setVectorLineWidthMode | ( | VectorLineWidthMode | m | ) |
determines how the line width of the vectors is derived.
|
private |
defines where the vector is anchored
|
private |
a scaling factor that can be used to modify the result of the autoscaling algorithm (m_vectorLengthMode ==AutoscaleLength)
The vector length is further scaled by this value.
|
private |
if m_vectorLengthMode ==false, this is the scale-factor used to calculate the vector length
|
private |
internally calculated (before draw() actually draws) maximum vector length
|
private |
minimum line-width in pt, used for some modes of m_vectorLineWidthMode
|
private |
internally calculated (before draw() actually draws) minimum vector length
|
private |
indicates how the length of the drawn vectors are determined from the data
Several modes are possible:
== LengthFromData the vector is drawn from == AutoscaleLength the vector is drawn to q90VectorLength : autoscale=plotwidth/VectorPerWidth/q90VectorLength .
== IgnoreLength all vectors are drawn with the same length, which is determined from autoscale*m_autoscaleLengthFactor where autoscale is defined as above.
|
private |
determines how the line width of the vectors is derived.
|
readwrite |
|
readwrite |
|
readwrite |
|
readwrite |
|
readwrite |
|
readwrite |