|
JKQTPlotter trunk/v5.0.0
an extensive Qt5+Qt6 Plotter framework (including a feature-richt plotter widget, a speed-optimized, but limited variant and a LaTeX equation renderer!), written fully in C/C++ and without external dependencies
|
|
JKQTPlotter trunk/v5.0.0
an extensive Qt5+Qt6 Plotter framework (including a feature-richt plotter widget, a speed-optimized, but limited variant and a LaTeX equation renderer!), written fully in C/C++ and without external dependencies
|
This JKQTPGeometricPlotElement is used to draw a bezier curve. More...
#include <jkqtpgeolines.h>
Public Member Functions | |
| JKQTPGeoBezierCurve (JKQTBasePlotter *parent) | |
| class constructor | |
| JKQTPGeoBezierCurve (JKQTBasePlotter *parent, const QPointF &start, const QPointF &control1, const QPointF &control2, const QPointF &end) | |
| class constructor with start, end and two control points (i.e. a cubic bezier curve) | |
| JKQTPGeoBezierCurve (JKQTBasePlotter *parent, const QPointF &start, const QPointF &control1, const QPointF &end) | |
| class constructor with start, end and one control point (i.e. a quadratic bezier curve) | |
| JKQTPGeoBezierCurve (JKQTPlotter *parent) | |
| class constructor | |
| JKQTPGeoBezierCurve (JKQTPlotter *parent, const QPointF &start, const QPointF &control1, const QPointF &control2, const QPointF &end) | |
| class constructor with start, end and two control points (i.e. a cubic bezier curve) | |
| JKQTPGeoBezierCurve (JKQTPlotter *parent, const QPointF &start, const QPointF &control1, const QPointF &end) | |
| class constructor with start, end and one control point (i.e. a quadratic bezier curve) | |
| virtual void | draw (JKQTPEnhancedPainter &painter) override |
| plots the graph to the plotter object specified as parent | |
| QPointF | getControl1 () const |
| get the control point 1 of the curve | |
| QPointF | getControl2 () const |
| get the control point 2 of the curve | |
| int | getDegree () const |
| get the degree of the curve (number of points -1) | |
| QPointF | getEnd () const |
| get the end point of the curve | |
| int | getNumberOfCOntrolPoints () const |
| get the number of control points (including start and end) | |
| QVector< QPointF > | getPoints () const |
| list with all control points of the bezier curve | |
| QPointF | getStart () const |
| get the start point of the curve | |
| virtual bool | getXMinMax (double &minx, double &maxx, double &smallestGreaterZero) override |
| get the maximum and minimum x-value of the graph | |
| virtual bool | getYMinMax (double &miny, double &maxy, double &smallestGreaterZero) override |
| get the maximum and minimum y-value of the graph | |
| void | setCubic (const QPointF &start, const QPointF &control1, const QPointF &control2, const QPointF &end) |
| set a cubic bezier curve (4 control points) | |
| void | setLine (const QPointF &start, const QPointF &end) |
| set a linear bezier curve (2 control points) | |
| void | setPoints (const QVector< QPointF > &__value) |
| list with all control points of the bezier curve | |
| void | setQuad (const QPointF &start, const QPointF &control1, const QPointF &end) |
| set a quadratic bezier curve (3 control points) | |
| void | setQuartic (const QPointF &start, const QPointF &control1, const QPointF &control2, const QPointF &control3, const QPointF &end) |
| set a cubic bezier curve (5 control points) | |
| Public Member Functions inherited from JKQTPGeoBaseDecoratedLine | |
| JKQTPGeoBaseDecoratedLine (JKQTBasePlotter *parent, DrawMode drawMode=DrawAsGraphicElement) | |
| class contructor | |
| JKQTPGeoBaseDecoratedLine (JKQTPLineDecoratorStyle headStyle, JKQTPLineDecoratorStyle tailStyle, JKQTBasePlotter *parent, DrawMode drawMode=DrawAsGraphicElement) | |
| class contructor | |
| virtual void | drawKeyMarker (JKQTPEnhancedPainter &painter, const QRectF &rect) override |
| plots a key marker inside the specified rectangle rect | |
| virtual QColor | getKeyLabelColor () const override |
| returns the color to be used for the key label | |
| virtual void | setAlpha (float alpha) |
| sets the alpha-channel of the color (i.e. its transparency) | |
| virtual void | setColor (QColor c) |
| set line color | |
| virtual void | setStyle (QColor color, double lineWidth) |
| set several of the style properties with one call | |
| virtual void | setStyle (QColor color, double lineWidth, Qt::PenStyle style) |
| set several of the style properties with one call | |
| virtual void | setStyle (QColor color, Qt::PenStyle style) |
| set several of the style properties with one call | |
| Public Member Functions inherited from JKQTPGeometricPlotElement | |
| JKQTPGeometricPlotElement (DrawMode drawMode=DrawAsGraphicElement, JKQTBasePlotter *parent=nullptr) | |
| class constructor | |
| virtual | ~JKQTPGeometricPlotElement () |
| default wirtual destructor | |
| DrawMode | getDrawMode () const |
| indicated whether to draw lines as graphic elements (even on non-linear coordinate systems), or as mathematically correct curves | |
| Public Member Functions inherited from JKQTPPlotElement | |
| JKQTPPlotElement (JKQTBasePlotter *parent=nullptr) | |
| class constructor | |
| virtual | ~JKQTPPlotElement ()=default |
| default wirtual destructor | |
| QPointF | backTransform (const QPointF &x) const |
| tool routine that back-transforms a QPointF according to the parent's transformation rules (pixels --> plot coordinate) | |
| QPointF | backTransform (double x, double y) const |
| tool routine that back-transforms a QPointF according to the parent's transformation rules (pixels --> plot coordinate) | |
| double | backtransformX (double x) const |
| tool routine that backtransforms an x-coordinate (pixels --> plot coordinate) for this plot element, uses the axis referenced in xAxisRef | |
| double | backtransformY (double y) const |
| tool routine that backtransforms a y-coordinate (pixels --> plot coordinate) for this plot element, uses the axis referenced in yAxisRef | |
| virtual void | drawOutside (JKQTPEnhancedPainter &painter, QRect leftSpace, QRect rightSpace, QRect topSpace, QRect bottomSpace) |
| plots outside the actual plot field of view (e.g. color bars, scale bars, ...) | |
| QImage | generateKeyMarker (QSize size=QSize(16, 16)) |
| returns an image with a key marker inside | |
| virtual void | getOutsideSize (JKQTPEnhancedPainter &painter, int &leftSpace, int &rightSpace, int &topSpace, int &bottomSpace) |
| if the graph plots outside the actual plot field of view (e.g. color bars, scale bars, ...) | |
| JKQTBasePlotter * | getParent () |
| returns the parent painter class | |
| const JKQTBasePlotter * | getParent () const |
| returns the parent painter class | |
| QString | getTitle () const |
| returns the the title of the plot | |
| const JKQTPCoordinateAxis * | getXAxis () const |
| returns the actual x-Axis-object from the parent plotter, referenced in xAxisRef | |
| JKQTPCoordinateAxisRef | getXAxisRef () const |
| indicates which coordinate axis to use for coordinate transforms in x-direction | |
| const JKQTPCoordinateAxis * | getYAxis () const |
| returns the actual y-Axis-object from the parent plotter, referenced in yAxisRef | |
| JKQTPCoordinateAxisRef | getYAxisRef () const |
| indicates which coordinate axis to use for coordinate transforms in y-direction | |
| virtual double | hitTest (const QPointF &posSystem, QPointF *closestSpotSystem=nullptr, QString *label=nullptr, HitTestMode mode=HitTestXY) const |
returns the closest distance of the plot element to the (screen pixel) position pos, or NAN | |
| bool | isHighlighted () const |
| returns whether the graph is shown in a highlighted style in the plot | |
| bool | isVisible () const |
| returns whether the graph is visible in the plot | |
| void | setAxes (JKQTPCoordinateAxisRef ref) |
| set the coordinate axes to use for this plot element | |
| virtual void | setParent (JKQTBasePlotter *parent) |
| sets the parent painter class | |
| virtual void | setParent (JKQTPlotter *parent) |
| sets the parent painter class | |
| void | setXAxis (JKQTPCoordinateAxisRef ref) |
| indicates which coordinate axis to use for coordinate transforms in x-direction | |
| void | setYAxis (JKQTPCoordinateAxisRef ref) |
| indicates which coordinate axis to use for coordinate transforms in y-direction | |
| QPointF | transform (const QPointF &x) const |
| tool routine that transforms a QPointF according to the parent's transformation rules (plot coordinate --> pixels) | |
| QPolygonF | transform (const QPolygonF &x) const |
| tool routine that transforms a QPolygonF according to the parent's transformation rules (plot coordinate --> pixels) | |
| QPointF | transform (double x, double y) const |
| tool routine that transforms a QPointF according to the parent's transformation rules (plot coordinate --> pixels) | |
| QPainterPath | transformToLinePath (const QPolygonF &x) const |
| tool routine that transforms a QPolygonF according to the parent's transformation rules and returns a (non-closed) path consisting of lines (plot coordinate --> pixels) | |
| QVector< double > | transformX (const QVector< double > &x) const |
| transform all x-coordinates in a vector x | |
| double | transformX (double x) const |
| tool routine that transforms an x-coordinate (plot coordinate --> pixels) for this plot element, uses the axis referenced in xAxisRef | |
| QVector< double > | transformY (const QVector< double > &x) const |
| transform all y-coordinates in a vector x | |
| double | transformY (double y) const |
| tool routine that transforms a y-coordinate (plot coordinate --> pixels) for this plot element, uses the axis referenced in yAxisRef | |
| Public Member Functions inherited from JKQTPGraphDecoratedLineStyleMixin | |
| JKQTPGraphDecoratedLineStyleMixin () | |
| class constructor | |
| virtual | ~JKQTPGraphDecoratedLineStyleMixin () |
| double | calcHeadDecoratorSize (double line_width) const |
| calculates the tail decorator size from the line width line_width, using m_headDecoratorSizeFactor and a non-linear scaling function | |
| double | calcTailDecoratorSize (double line_width) const |
| calculates the tail decorator size from the line width line_width, using m_tailDecoratorSizeFactor and a non-linear scaling function | |
| double | getHeadDecoratorSizeFactor () const |
| head decorator size-factor, used to calculate the size of the arrow from the line width | |
| JKQTPLineDecoratorStyle | getHeadDecoratorStyle () const |
| get the head decorator style | |
| double | getTailDecoratorSizeFactor () const |
| tail decorator size-factor, used to calculate the size of the arrow from the line width | |
| JKQTPLineDecoratorStyle | getTailDecoratorStyle () const |
| get the tail decorator style | |
| void | initDecoratedLineStyle (JKQTBasePlotter *parent, int &parentPlotStyle, JKQTPPlotStyleType styletype=JKQTPPlotStyleType::Default) |
| initiaize the line style (from the parent plotter) | |
| void | setHeadDecoratorSizeFactor (const double &__value) |
| head decorator size-factor, used to calculate the size of the arrow from the line width | |
| void | setHeadDecoratorStyle (const JKQTPLineDecoratorStyle &__value) |
| set the head decorator style | |
| void | setTailDecoratorSizeFactor (const double &__value) |
| tail decorator size-factor, used to calculate the size of the arrow from the line width | |
| void | setTailDecoratorStyle (const JKQTPLineDecoratorStyle &__value) |
| set the tail decorator style | |
| Public Member Functions inherited from JKQTPGraphLineStyleMixin | |
| JKQTPGraphLineStyleMixin () | |
| class constructor | |
| virtual | ~JKQTPGraphLineStyleMixin () |
| QColor | getHighlightingLineColor () const |
| get the color of the graph line when highlighted | |
| QPen | getHighlightingLinePen (JKQTPEnhancedPainter &painter, JKQTBasePlotter *parent) const |
| constructs a QPen from the line styling properties | |
| QPen | getHighlightingLinePenForRects (JKQTPEnhancedPainter &painter, JKQTBasePlotter *parent) const |
| constructs a QPen from the line styling properties, suitable for drawing rectangle with sharp corners | |
| QPen | getKeyLinePen (JKQTPEnhancedPainter &painter, const QRectF &rect, JKQTBasePlotter *parent) const |
| constructs a QPen from the line styling properties, but uses getKeyLineWidthPx() for the width, i.e. constructs a pen for drawing lines in key-symbols | |
| double | getKeyLineWidthPx (JKQTPEnhancedPainter &painter, const QRectF &keyRect, const JKQTBasePlotter *parent) const |
| returns the linewidth for drawing lines in a key entry with keyRect for the symbol, using painter and parent . | |
| QBrush | getLineBrush () const |
| gets the brush used to fill the line area | |
| Qt::PenCapStyle | getLineCapStyle () const |
| gets the cap style | |
| QColor | getLineColor () const |
| get the color of the graph line | |
| qreal | getLineDashOffset () const |
| returns the dash offset for a custom dash style | |
| QVector< qreal > | getLineDashPattern () const |
| gets the dash pattern for a custom dash style | |
| Qt::PenJoinStyle | getLineJoinStyle () const |
| returns the join style | |
| QPen | getLinePen (JKQTPEnhancedPainter &painter, JKQTBasePlotter *parent) const |
| constructs a QPen from the line styling properties | |
| QPen | getLinePenForRects (JKQTPEnhancedPainter &painter, JKQTBasePlotter *parent) const |
| constructs a QPen from the line styling properties, suitable for drawing rectangles with sharp edges | |
| Qt::PenStyle | getLineStyle () const |
| get the style of the graph line | |
| double | getLineWidth () const |
| get the line width of the graph line (in pt) | |
| void | initLineStyle (JKQTBasePlotter *parent, int &parentPlotStyle, JKQTPPlotStyleType styletype=JKQTPPlotStyleType::Default) |
| initiaize the line style (from the parent plotter) | |
| void | setHighlightingLineColor (const QColor &__value) |
| set the color of the graph line when highlighted | |
| void | setHighlightingLineColor (const QColor &__value, double alpha) |
| set the color of the graph line when highlighted | |
| void | setLineBrush (const QBrush &style) |
| sets the brush used to fill the line area | |
| void | setLineCapStyle (Qt::PenCapStyle style) |
| sets the cap style | |
| void | setLineColor (const QColor &__value) |
| set the color of the graph line | |
| void | setLineColor (const QColor &__value, double alpha) |
| set the color of the graph line | |
| void | setLineColorInvertedFrom (QColor __noninvertedColor) |
| sets the line-color as an inverted version of the given color | |
| void | setLineDashOffset (qreal offset) |
| sets the dash offset for a custom dash style | |
| void | setLineDashPattern (const QVector< qreal > &pattern) |
| sets the dash pattern for a custom dash style | |
| void | setLineJoinStyle (Qt::PenJoinStyle style) |
| sets the join style | |
| void | setLineStyle (Qt::PenStyle __value) |
| set the style of the graph line | |
| void | setLineWidth (double __value) |
| set the line width of the graph line (in pt) | |
Protected Attributes | |
| QVector< QPointF > | points |
| list with all control points of the bezier curve | |
| Protected Attributes inherited from JKQTPGeometricPlotElement | |
| DrawMode | m_drawMode |
| indicated whether to draw lines as graphic elements (even on non-linear coordinate systems), or as mathematically correct curves | |
| Protected Attributes inherited from JKQTPPlotElement | |
| QVector< HitTestLocation > | m_hitTestData |
| dataset with graph-points and associated data from the function hitTest() | |
| JKQTBasePlotter * | parent |
| the plotter object this object belongs to | |
| int | parentPlotStyle |
| internal storage for the used parent plot style | |
Additional Inherited Members | |
| Public Types inherited from JKQTPGeometricPlotElement | |
| enum | DrawMode { DrawAsGraphicElement , DrawAsMathematicalCurve } |
| indicates how to draw the geometric object More... | |
| Public Types inherited from JKQTPPlotElement | |
| enum | HitTestMode { HitTestXY , HitTestXOnly , HitTestYOnly } |
| modes of operation for the function hitTest() More... | |
| Public Slots inherited from JKQTPGeometricPlotElement | |
| void | setDrawMode (DrawMode mode) |
| indicated whether to draw lines as graphic elements (even on non-linear coordinate systems), or as mathematically correct curves | |
| Public Slots inherited from JKQTPPlotElement | |
| void | setHighlighted (bool __value) |
| sets whether the graph is drawn in a highlighted style in the plot | |
| virtual void | setTitle (const QString &__value) |
| sets the title of the plot (for display in key!). | |
| void | setVisible (bool __value) |
| sets whether the graph is visible in the plot | |
| Protected Member Functions inherited from JKQTPPlotElement | |
| void | addHitTestData (const HitTestLocation &loc) |
| clear the internal datastore for hitTest() | |
| void | addHitTestData (const QPointF &pos_, const QString &label_) |
| clear the internal datastore for hitTest() | |
| void | addHitTestData (const QPointF &pos_, int index_, const QString &label_) |
| clear the internal datastore for hitTest() | |
| void | addHitTestData (const QPointF &pos_, int index_=-1, const JKQTPDatastore *datastore=nullptr) |
| clear the internal datastore for hitTest(), this variant uses formatHitTestDefaultLabel() to auto-generate the label | |
| void | addHitTestData (double x_, double y_, const QString &label_) |
| add a new point on the graph to the internal datastore for hitTest() | |
| void | addHitTestData (double x_, double y_, int index_, const QString &label_) |
| clear the internal datastore for hitTest() | |
| void | addHitTestData (double x_, double y_, int index_=-1, const JKQTPDatastore *datastore=nullptr) |
| add a new point on the graph to the internal datastore for hitTest(), this variant uses formatHitTestDefaultLabel() to auto-generate the label | |
| void | clearHitTestData () |
| clear the internal datastore for hitTest() | |
| virtual QString | formatHitTestDefaultLabel (double x, double y, int index=-1, const JKQTPDatastore *datastore=nullptr) const |
| tool-function for hitTest(), which formats a default label, taking into account the x- and y-position (both provided) and optionally the errors of these positions. | |
| void | reserveHitTestData (int points) |
| reserve list entries for up to points graph points in the internal datastore for hitTest() | |
| QString | xFloatToString (double v, int past_comma=-1) const |
| converts a x-value v into a string, taking into account the type of x-axis | |
| QString | yFloatToString (double v, int past_comma=-1) const |
| converts a x-value v into a string, taking into account the type of x-axis | |
| Properties inherited from JKQTPGeometricPlotElement | |
| DrawMode | drawMode |
| Properties inherited from JKQTPPlotElement | |
| bool | highlighted |
| indicates whether the graph is shown in a "highlghted" in the plot | |
| QString | title |
| title of the plot (for display in key!). If no title is supplied, no key entry is drawn. | |
| bool | visible |
| indicates whether the graph is visible in the plot | |
| JKQTPCoordinateAxisRef | xAxisRef |
| indicates which coordinate axis to use for coordinate transforms in x-direction | |
| JKQTPCoordinateAxisRef | yAxisRef |
| indicates which coordinate axis to use for coordinate transforms in y-direction | |
| Properties inherited from JKQTPGraphDecoratedLineStyleMixin | |
| double | headDecoratorSizeFactor |
| JKQTPLineDecoratorStyle | headDecoratorStyle |
| double | tailDecoratorSizeFactor |
| JKQTPLineDecoratorStyle | tailDecoratorStyle |
| Properties inherited from JKQTPGraphLineStyleMixin | |
| QColor | highlightingLineColor |
| QColor | lineColor |
| Qt::PenStyle | lineStyle |
| double | lineWidth |
This JKQTPGeometricPlotElement is used to draw a bezier curve.
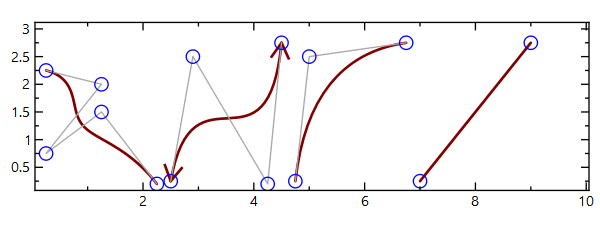
This class support JKQTPGeometricPlotElement::DrawMode::DrawAsMathematicalCurve , which will only have a significant effect with logarithmic axes. THe image above is the default JKQTPGeometricPlotElement::DrawMode::DrawAsGraphicElement on a linear axis.
On logarithmic axes (x&y) the two modes draw very different shapes:
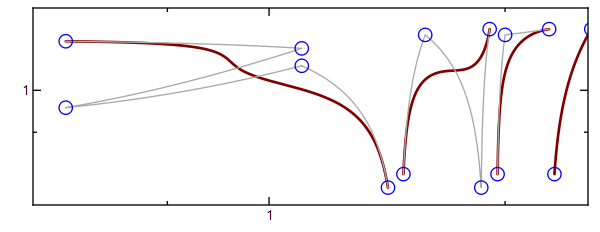
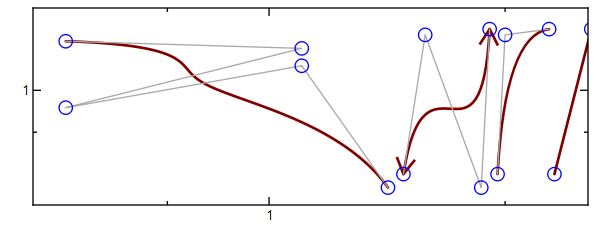
For DrawAsGraphicElement only the control points are converted to screen-coordinates, but drawing takes place in the (linear) screen-system. For DrawAsMathematicalCurve drawing is done in the log-coordinate system.
You can also activate line-end decorators (aka arrows) for this poly-line, by using code like this:
| JKQTPGeoBezierCurve::JKQTPGeoBezierCurve | ( | JKQTBasePlotter * | parent, |
| const QPointF & | start, | ||
| const QPointF & | control1, | ||
| const QPointF & | end ) |
class constructor with start, end and one control point (i.e. a quadratic bezier curve)
| parent | the parent plotter object |
| start | start point |
| control1 | control-point in between start and end |
| end | end point |
| JKQTPGeoBezierCurve::JKQTPGeoBezierCurve | ( | JKQTPlotter * | parent, |
| const QPointF & | start, | ||
| const QPointF & | control1, | ||
| const QPointF & | end ) |
class constructor with start, end and one control point (i.e. a quadratic bezier curve)
| parent | the parent plotter object |
| start | start point |
| control1 | control-point in between start and end |
| end | end point |
| JKQTPGeoBezierCurve::JKQTPGeoBezierCurve | ( | JKQTBasePlotter * | parent, |
| const QPointF & | start, | ||
| const QPointF & | control1, | ||
| const QPointF & | control2, | ||
| const QPointF & | end ) |
class constructor with start, end and two control points (i.e. a cubic bezier curve)
| parent | the parent plotter object |
| start | start point |
| control1 | 1st control-point in between start and end |
| control2 | 2nd control-point in between start and end |
| end | end point |
| JKQTPGeoBezierCurve::JKQTPGeoBezierCurve | ( | JKQTPlotter * | parent, |
| const QPointF & | start, | ||
| const QPointF & | control1, | ||
| const QPointF & | control2, | ||
| const QPointF & | end ) |
class constructor with start, end and two control points (i.e. a cubic bezier curve)
| parent | the parent plotter object |
| start | start point |
| control1 | 1st control-point in between start and end |
| control2 | 2nd control-point in between start and end |
| end | end point |
| JKQTPGeoBezierCurve::JKQTPGeoBezierCurve | ( | JKQTBasePlotter * | parent | ) |
class constructor
| parent | the parent plotter object |
| JKQTPGeoBezierCurve::JKQTPGeoBezierCurve | ( | JKQTPlotter * | parent | ) |
class constructor
| parent | the parent plotter object |
|
overridevirtual |
plots the graph to the plotter object specified as parent
Implements JKQTPPlotElement.
| QPointF JKQTPGeoBezierCurve::getControl1 | ( | ) | const |
get the control point 1 of the curve
| QPointF JKQTPGeoBezierCurve::getControl2 | ( | ) | const |
get the control point 2 of the curve
| int JKQTPGeoBezierCurve::getDegree | ( | ) | const |
get the degree of the curve (number of points -1)
| QPointF JKQTPGeoBezierCurve::getEnd | ( | ) | const |
get the end point of the curve
| int JKQTPGeoBezierCurve::getNumberOfCOntrolPoints | ( | ) | const |
get the number of control points (including start and end)
| QVector< QPointF > JKQTPGeoBezierCurve::getPoints | ( | ) | const |
list with all control points of the bezier curve
| QPointF JKQTPGeoBezierCurve::getStart | ( | ) | const |
get the start point of the curve
|
overridevirtual |
get the maximum and minimum x-value of the graph
The result is given in the two parameters which are call-by-reference parameters!
| [out] | minx | minimal x-value used in the graph |
| [out] | maxx | maximal x-value used in the graph |
| [out] | smallestGreaterZero | the smalles x-value in the graph, which is larger than 0 (this is used in auto-sizing for logarithmic axes) |
true on success, i.e. if there were datapoints in the plot, or false on failure (e.g. when the graph is empty) Implements JKQTPPlotElement.
|
overridevirtual |
get the maximum and minimum y-value of the graph
The result is given in the two parameters which are call-by-reference parameters!
| [out] | miny | minimal y-value used in the graph |
| [out] | maxy | maximal y-value used in the graph |
| [out] | smallestGreaterZero | the smalles y-value in the graph, which is larger than 0 (this is used in auto-sizing for logarithmic axes) |
true on success, i.e. if there were datapoints in the plot, or false on failure (e.g. when the graph is empty) Implements JKQTPPlotElement.
| void JKQTPGeoBezierCurve::setCubic | ( | const QPointF & | start, |
| const QPointF & | control1, | ||
| const QPointF & | control2, | ||
| const QPointF & | end ) |
set a cubic bezier curve (4 control points)
| void JKQTPGeoBezierCurve::setLine | ( | const QPointF & | start, |
| const QPointF & | end ) |
set a linear bezier curve (2 control points)
| void JKQTPGeoBezierCurve::setPoints | ( | const QVector< QPointF > & | __value | ) |
list with all control points of the bezier curve
| void JKQTPGeoBezierCurve::setQuad | ( | const QPointF & | start, |
| const QPointF & | control1, | ||
| const QPointF & | end ) |
set a quadratic bezier curve (3 control points)
| void JKQTPGeoBezierCurve::setQuartic | ( | const QPointF & | start, |
| const QPointF & | control1, | ||
| const QPointF & | control2, | ||
| const QPointF & | control3, | ||
| const QPointF & | end ) |
set a cubic bezier curve (5 control points)
|
protected |
list with all control points of the bezier curve