JKQTPlotter trunk/v5.0.0
an extensive Qt5+Qt6 Plotter framework (including a feature-richt plotter widget, a speed-optimized, but limited variant and a LaTeX equation renderer!), written fully in C/C++ and without external dependencies
Loading...
Searching...
No Matches
Example (JKQTPlotter): Plotting Bezier Curves

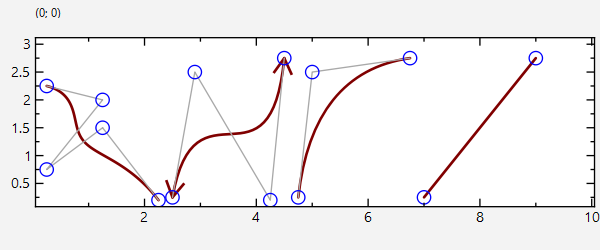
This project shows the capabilities of JKQTPlotter to also draw arrows as geometric elements, using JKQTPGeoBezierCurve.

The source code of the main application can be found in geo_bezier.cpp. First a plot is generated. Then several types of bezier curves are added to the plot and their control points shown.

Here is an example for drawing a cubic bézier curve:

bezCubic->setCubic(QPointF(0.25,0.25), QPointF(0.8,2.5), QPointF(3.25,0.2), QPointF(3.75,2.75));
bezCubic->setLineColor(QColor("maroon"));
plot.addGraph(bezCubic);
This JKQTPGeometricPlotElement is used to draw a bezier curve.
Definition jkqtpgeolines.h:486
void setCubic(const QPointF &start, const QPointF &control1, const QPointF &control2, const QPointF &end)
set a cubic bezier curve (4 control points)
void setTailDecoratorSizeFactor(const double &__value)
tail decorator size-factor, used to calculate the size of the arrow from the line width
void setHeadDecoratorSizeFactor(const double &__value)
head decorator size-factor, used to calculate the size of the arrow from the line width
void setLineColor(const QColor &__value)
set the color of the graph line
@ JKQTPArrow
a simple arrow tip, unfilled
Definition jkqtpdrawingtools.h:367

Finally we also add symbols for each control point and a poly-line connecting them:

plot.addGraph(l2=new JKQTPGeoPolyLines(&plot, bezCubic->getPoints()));
l2->setLineColor(QColor("darkgrey"));
l2->setLineWidth(1);
scatCubic->setXYColumns(plot.getDatastore()->addCopiedPoints(bezCubic->getPoints()));
scatCubic->setSymbolColor(QColor("blue"));
plot.addGraph(scatCubic);
QVector< QPointF > getPoints() const
list with all control points of the bezier curve
This JKQTPGeometricPlotElement is used to draw a poly line.
Definition jkqtpgeolines.h:378
void setLineWidth(double __value)
set the line width of the graph line (in pt)
void setSymbolColor(const QColor &__value)
set the color of the graph symbols
void setSymbolType(JKQTPGraphSymbols __value)
set the type of the graph symbol
void setXYColumns(size_t xCol, size_t yCol)
sets xColumn and yColumn at the same time
This implements xy scatter plots. This also alows to draw symbols at the data points.
Definition jkqtpscatter.h:59
@ JKQTPCircle
an unfilled circle
Definition jkqtpdrawingtools.h:148

Here is the resulting plot:

geo_bezier