|
JKQTPlotter trunk/v5.0.0
an extensive Qt5+Qt6 Plotter framework (including a feature-richt plotter widget, a speed-optimized, but limited variant and a LaTeX equation renderer!), written fully in C/C++ and without external dependencies
|
|
JKQTPlotter trunk/v5.0.0
an extensive Qt5+Qt6 Plotter framework (including a feature-richt plotter widget, a speed-optimized, but limited variant and a LaTeX equation renderer!), written fully in C/C++ and without external dependencies
|
This graph plots a vector field, i.e. a set of vectors (dx,dy) or (angle,length) at positions (x,y). This class is an extension of JKQTPVectorFieldGraph and additionally supports setting the line-color from an additional data column. More...
#include <jkqtpvectorfield.h>
Public Types | |
| enum | VectorColorMode { DefaultColor , ColorFromMagnitude , ColorFromAngle , ColorFromCustomColumn } |
| determines how the color of the vector is determined More... | |
| Public Types inherited from JKQTPVectorFieldGraph | |
| enum | VectorAnchorPoint { AnchorBottom , AnchorMid , AnchorTip } |
indicates the position of the point | |
| enum | VectorLengthMode { AutoscaleLength , LengthFromData , IgnoreLength } |
| indicates how the drawn vector's length is calculated from the data More... | |
| enum | VectorLineWidthMode { DefaultVectorLineWidth , AutoscaleLineWidthFromLength } |
| describes how the line width scales with the vector properties (or not) More... | |
| Public Types inherited from JKQTPXYAndVectorGraph | |
| enum | VectorDataLayout { DeltaXDeltaYLayout , AngleAndLengthLayout , DefaultVectorDataLayout =DeltaXDeltaYLayout } |
| values from this enum indicates how to interpret the data columns provided to this graph More... | |
| Public Types inherited from JKQTPXYGraph | |
| enum | DataSortOrder { Unsorted =0 , SortedX =1 , SortedY =2 } |
| specifies how to sort the data in a JKQTPXYGraph before drawing More... | |
| Public Types inherited from JKQTPPlotElement | |
| enum | HitTestMode { HitTestXY , HitTestXOnly , HitTestYOnly } |
| modes of operation for the function hitTest() More... | |
Public Member Functions | |
| JKQTPParametrizedVectorFieldGraph (JKQTBasePlotter *parent=nullptr) | |
| class constructor | |
| JKQTPParametrizedVectorFieldGraph (JKQTPlotter *parent) | |
| class constructor | |
| virtual void | cbGetDataMinMax (double &imin, double &imax) override |
| determine min/max data value of the image | |
| virtual void | draw (JKQTPEnhancedPainter &painter) override |
| plots the graph to the plotter object specified as parent | |
| virtual void | drawKeyMarker (JKQTPEnhancedPainter &painter, const QRectF &rect) override |
| plots a key marker inside the specified rectangle rect | |
| virtual void | drawOutside (JKQTPEnhancedPainter &painter, QRect leftSpace, QRect rightSpace, QRect topSpace, QRect bottomSpace) override |
| plots outside the actual plot field of view (e.g. color bars, scale bars, ...) | |
| int | getColorColumn () const |
| this column contains the symbol color | |
| bool | getColorColumnContainsRGB () const |
| if this is true, the value in the colorColumn is converted to an integer, representing a color in ARGB format (as in QRgb) | |
| virtual void | getOutsideSize (JKQTPEnhancedPainter &painter, int &leftSpace, int &rightSpace, int &topSpace, int &bottomSpace) override |
| if the graph plots outside the actual plot field of view (e.g. color bars, scale bars, ...) | |
| VectorColorMode | getVectorColorMode () const |
| indicates how color is determined from data (either from the vector or from m_colorColumn) | |
| void | setColorColumn (int __value) |
| this column contains the symbol color | |
| void | setColorColumn (size_t __value) |
| this column contains the symbol color | |
| void | setColorColumnContainsRGB (bool __value) |
| if this is true, the value in the colorColumn is converted to an integer, representing a color in ARGB format (as in QRgb) | |
| virtual void | setParent (JKQTBasePlotter *parent) override |
| sets the parent painter class | |
| void | setVectorColorMode (VectorColorMode __value) |
| indicates how color is determined from data (either from the vector or from m_colorColumn) | |
| virtual bool | usesColumn (int c) const override |
returns true if the given column is used by the graph | |
| Public Member Functions inherited from JKQTPVectorFieldGraph | |
| JKQTPVectorFieldGraph (JKQTBasePlotter *parent=nullptr) | |
| class constructor | |
| JKQTPVectorFieldGraph (JKQTPlotter *parent) | |
| class constructor | |
| VectorAnchorPoint | getAnchorPoint () const |
| defines where the vector is anchored | |
| double | getAutoscaleLengthFactor () const |
a scaling factor that can be used to modify the result of the autoscaling algorithm (m_vectorLengthMode ==AutoscaleLength) | |
| virtual QColor | getKeyLabelColor () const override |
| returns the color to be used for the key label | |
| double | getLengthScaleFactor () const |
if m_vectorLengthMode ==false, this is the scale-factor used to calculate the vector length | |
| double | getMinLineWIdth () const |
| minimum line-width in pt, used for some modes of m_vectorLineWidthMode | |
| VectorLengthMode | getVectorLengthMode () const |
| indicates how the length of the drawn vectors are determined from the data | |
| VectorLineWidthMode | getVectorLineWidthMode () const |
| determines how the line width of the vectors is derived. | |
| void | setAnchorPoint (VectorAnchorPoint newAnchorPoint) |
| defines where the vector is anchored | |
| void | setAutoscaleLengthFactor (double newAutoscaleLengthFactor) |
a scaling factor that can be used to modify the result of the autoscaling algorithm (m_vectorLengthMode ==AutoscaleLength) | |
| void | setLengthScaleFactor (double newLengthScaleFactor) |
if m_vectorLengthMode ==false, this is the scale-factor used to calculate the vector length | |
| void | setMinLineWidth (double lw) |
| minimum line-width in pt, used for some modes of m_vectorLineWidthMode | |
| void | setVectorLengthMode (VectorLengthMode newMode) |
| indicates how the length of the drawn vectors are determined from the data | |
| void | setVectorLineWidthMode (VectorLineWidthMode m) |
| determines how the line width of the vectors is derived. | |
| Public Member Functions inherited from JKQTPXYAndVectorGraph | |
| JKQTPXYAndVectorGraph (JKQTBasePlotter *parent=nullptr) | |
| class constructor | |
| virtual QString | formatHitTestDefaultLabel (double x, double y, int index=-1, const JKQTPDatastore *datastore=nullptr) const override |
| tool-function for hitTest(), which formats a default label, taking into account the x- and y-position (both provided) and optionally the errors of these positions. | |
| int | getAngleColumn () const |
| the column that contains the rotation angle [in radian] | |
| int | getDxColumn () const |
| the column that contains the delta along the x-axis. | |
| int | getDyColumn () const |
| the column that contains the delta along the y-axis. | |
| int | getLengthColumn () const |
| the column that contains the vector length | |
| VectorDataLayout | getVectorDataLayout () const |
| indicates, which column pairs to use (dxColumn, dyColumn), (angleColumn, lengthColumn), ... | |
| virtual bool | getXMinMax (double &minx, double &maxx, double &smallestGreaterZero) override |
| get the maximum and minimum x-value of the graph | |
| virtual bool | getYMinMax (double &miny, double &maxy, double &smallestGreaterZero) override |
| get the maximum and minimum y-value of the graph | |
| virtual double | hitTest (const QPointF &posSystem, QPointF *closestSpotSystem=nullptr, QString *label=nullptr, HitTestMode mode=HitTestXY) const override |
| Implmentation of JKQTPPlotElement::hitTest(), which searches through all graph points defined by xColumn and yColumn and returns a general x/y-label, also taking into account possibly known errors to the graphs (if it is derived from JKQTPXGraphErrorData and/or JKQTPYGraphErrorData. | |
| Public Member Functions inherited from JKQTPXYGraph | |
| JKQTPXYGraph (JKQTBasePlotter *parent=nullptr) | |
| class constructor | |
| DataSortOrder | getDataSortOrder () const |
if !=Unsorted, the data is sorted before plotting | |
| virtual int | getKeyColumn () const |
| returns the column used as "key" for the current graph (typically this call getXColumn(), but for horizontal graphs like filled curves or barcharts it may call getYColumn() ) | |
| virtual int | getValueColumn () const |
| returns the column used as "value" for the current graph (typically this call getXColumn(), but for horizontal graphs like filled curves or barcharts it may call getYColumn() ) | |
| int | getXColumn () const |
| the column that contains the x-component of the datapoints | |
| int | getYColumn () const |
| the column that contains the y-component of the datapoints | |
| Public Member Functions inherited from JKQTPGraph | |
| JKQTPGraph (JKQTBasePlotter *parent=nullptr) | |
| class constructor | |
| virtual | ~JKQTPGraph ()=default |
| default wirtual destructor | |
| Public Member Functions inherited from JKQTPPlotElement | |
| JKQTPPlotElement (JKQTBasePlotter *parent=nullptr) | |
| class constructor | |
| virtual | ~JKQTPPlotElement ()=default |
| default wirtual destructor | |
| QPointF | backTransform (const QPointF &x) const |
| tool routine that back-transforms a QPointF according to the parent's transformation rules (pixels --> plot coordinate) | |
| QPointF | backTransform (double x, double y) const |
| tool routine that back-transforms a QPointF according to the parent's transformation rules (pixels --> plot coordinate) | |
| double | backtransformX (double x) const |
| tool routine that backtransforms an x-coordinate (pixels --> plot coordinate) for this plot element, uses the axis referenced in xAxisRef | |
| double | backtransformY (double y) const |
| tool routine that backtransforms a y-coordinate (pixels --> plot coordinate) for this plot element, uses the axis referenced in yAxisRef | |
| QImage | generateKeyMarker (QSize size=QSize(16, 16)) |
| returns an image with a key marker inside | |
| JKQTBasePlotter * | getParent () |
| returns the parent painter class | |
| const JKQTBasePlotter * | getParent () const |
| returns the parent painter class | |
| QString | getTitle () const |
| returns the the title of the plot | |
| const JKQTPCoordinateAxis * | getXAxis () const |
| returns the actual x-Axis-object from the parent plotter, referenced in xAxisRef | |
| JKQTPCoordinateAxisRef | getXAxisRef () const |
| indicates which coordinate axis to use for coordinate transforms in x-direction | |
| const JKQTPCoordinateAxis * | getYAxis () const |
| returns the actual y-Axis-object from the parent plotter, referenced in yAxisRef | |
| JKQTPCoordinateAxisRef | getYAxisRef () const |
| indicates which coordinate axis to use for coordinate transforms in y-direction | |
| bool | isHighlighted () const |
| returns whether the graph is shown in a highlighted style in the plot | |
| bool | isVisible () const |
| returns whether the graph is visible in the plot | |
| void | setAxes (JKQTPCoordinateAxisRef ref) |
| set the coordinate axes to use for this plot element | |
| virtual void | setParent (JKQTPlotter *parent) |
| sets the parent painter class | |
| void | setXAxis (JKQTPCoordinateAxisRef ref) |
| indicates which coordinate axis to use for coordinate transforms in x-direction | |
| void | setYAxis (JKQTPCoordinateAxisRef ref) |
| indicates which coordinate axis to use for coordinate transforms in y-direction | |
| QPointF | transform (const QPointF &x) const |
| tool routine that transforms a QPointF according to the parent's transformation rules (plot coordinate --> pixels) | |
| QPolygonF | transform (const QPolygonF &x) const |
| tool routine that transforms a QPolygonF according to the parent's transformation rules (plot coordinate --> pixels) | |
| QPointF | transform (double x, double y) const |
| tool routine that transforms a QPointF according to the parent's transformation rules (plot coordinate --> pixels) | |
| QPainterPath | transformToLinePath (const QPolygonF &x) const |
| tool routine that transforms a QPolygonF according to the parent's transformation rules and returns a (non-closed) path consisting of lines (plot coordinate --> pixels) | |
| QVector< double > | transformX (const QVector< double > &x) const |
| transform all x-coordinates in a vector x | |
| double | transformX (double x) const |
| tool routine that transforms an x-coordinate (plot coordinate --> pixels) for this plot element, uses the axis referenced in xAxisRef | |
| QVector< double > | transformY (const QVector< double > &x) const |
| transform all y-coordinates in a vector x | |
| double | transformY (double y) const |
| tool routine that transforms a y-coordinate (plot coordinate --> pixels) for this plot element, uses the axis referenced in yAxisRef | |
| Public Member Functions inherited from JKQTPGraphDecoratedLineStyleMixin | |
| JKQTPGraphDecoratedLineStyleMixin () | |
| class constructor | |
| virtual | ~JKQTPGraphDecoratedLineStyleMixin () |
| double | calcHeadDecoratorSize (double line_width) const |
| calculates the tail decorator size from the line width line_width, using m_headDecoratorSizeFactor and a non-linear scaling function | |
| double | calcTailDecoratorSize (double line_width) const |
| calculates the tail decorator size from the line width line_width, using m_tailDecoratorSizeFactor and a non-linear scaling function | |
| double | getHeadDecoratorSizeFactor () const |
| head decorator size-factor, used to calculate the size of the arrow from the line width | |
| JKQTPLineDecoratorStyle | getHeadDecoratorStyle () const |
| get the head decorator style | |
| double | getTailDecoratorSizeFactor () const |
| tail decorator size-factor, used to calculate the size of the arrow from the line width | |
| JKQTPLineDecoratorStyle | getTailDecoratorStyle () const |
| get the tail decorator style | |
| void | initDecoratedLineStyle (JKQTBasePlotter *parent, int &parentPlotStyle, JKQTPPlotStyleType styletype=JKQTPPlotStyleType::Default) |
| initiaize the line style (from the parent plotter) | |
| void | setHeadDecoratorSizeFactor (const double &__value) |
| head decorator size-factor, used to calculate the size of the arrow from the line width | |
| void | setHeadDecoratorStyle (const JKQTPLineDecoratorStyle &__value) |
| set the head decorator style | |
| void | setTailDecoratorSizeFactor (const double &__value) |
| tail decorator size-factor, used to calculate the size of the arrow from the line width | |
| void | setTailDecoratorStyle (const JKQTPLineDecoratorStyle &__value) |
| set the tail decorator style | |
| Public Member Functions inherited from JKQTPGraphLineStyleMixin | |
| JKQTPGraphLineStyleMixin () | |
| class constructor | |
| virtual | ~JKQTPGraphLineStyleMixin () |
| QColor | getHighlightingLineColor () const |
| get the color of the graph line when highlighted | |
| QPen | getHighlightingLinePen (JKQTPEnhancedPainter &painter, JKQTBasePlotter *parent) const |
| constructs a QPen from the line styling properties | |
| QPen | getHighlightingLinePenForRects (JKQTPEnhancedPainter &painter, JKQTBasePlotter *parent) const |
| constructs a QPen from the line styling properties, suitable for drawing rectangle with sharp corners | |
| QPen | getKeyLinePen (JKQTPEnhancedPainter &painter, const QRectF &rect, JKQTBasePlotter *parent) const |
| constructs a QPen from the line styling properties, but uses getKeyLineWidthPx() for the width, i.e. constructs a pen for drawing lines in key-symbols | |
| double | getKeyLineWidthPx (JKQTPEnhancedPainter &painter, const QRectF &keyRect, const JKQTBasePlotter *parent) const |
| returns the linewidth for drawing lines in a key entry with keyRect for the symbol, using painter and parent . | |
| QBrush | getLineBrush () const |
| gets the brush used to fill the line area | |
| Qt::PenCapStyle | getLineCapStyle () const |
| gets the cap style | |
| QColor | getLineColor () const |
| get the color of the graph line | |
| qreal | getLineDashOffset () const |
| returns the dash offset for a custom dash style | |
| QVector< qreal > | getLineDashPattern () const |
| gets the dash pattern for a custom dash style | |
| Qt::PenJoinStyle | getLineJoinStyle () const |
| returns the join style | |
| QPen | getLinePen (JKQTPEnhancedPainter &painter, JKQTBasePlotter *parent) const |
| constructs a QPen from the line styling properties | |
| QPen | getLinePenForRects (JKQTPEnhancedPainter &painter, JKQTBasePlotter *parent) const |
| constructs a QPen from the line styling properties, suitable for drawing rectangles with sharp edges | |
| Qt::PenStyle | getLineStyle () const |
| get the style of the graph line | |
| double | getLineWidth () const |
| get the line width of the graph line (in pt) | |
| void | initLineStyle (JKQTBasePlotter *parent, int &parentPlotStyle, JKQTPPlotStyleType styletype=JKQTPPlotStyleType::Default) |
| initiaize the line style (from the parent plotter) | |
| void | setHighlightingLineColor (const QColor &__value) |
| set the color of the graph line when highlighted | |
| void | setHighlightingLineColor (const QColor &__value, double alpha) |
| set the color of the graph line when highlighted | |
| void | setLineBrush (const QBrush &style) |
| sets the brush used to fill the line area | |
| void | setLineCapStyle (Qt::PenCapStyle style) |
| sets the cap style | |
| void | setLineColor (const QColor &__value) |
| set the color of the graph line | |
| void | setLineColor (const QColor &__value, double alpha) |
| set the color of the graph line | |
| void | setLineColorInvertedFrom (QColor __noninvertedColor) |
| sets the line-color as an inverted version of the given color | |
| void | setLineDashOffset (qreal offset) |
| sets the dash offset for a custom dash style | |
| void | setLineDashPattern (const QVector< qreal > &pattern) |
| sets the dash pattern for a custom dash style | |
| void | setLineJoinStyle (Qt::PenJoinStyle style) |
| sets the join style | |
| void | setLineStyle (Qt::PenStyle __value) |
| set the style of the graph line | |
| void | setLineWidth (double __value) |
| set the line width of the graph line (in pt) | |
| Public Member Functions inherited from JKQTPColorPaletteStyleAndToolsMixin | |
| JKQTPColorPaletteStyleAndToolsMixin (JKQTBasePlotter *parent) | |
| virtual | ~JKQTPColorPaletteStyleAndToolsMixin () |
| virtual void | cbDrawOutside (JKQTPEnhancedPainter &painter, QRect leftSpace, QRect rightSpace, QRect topSpace, QRect bottomSpace) |
| plots outside the actual plot field of view (e.g. color bars, scale bars, ...) | |
| virtual void | cbGetOutsideSize (JKQTPEnhancedPainter &painter, int &leftSpace, int &rightSpace, int &topSpace, int &bottomSpace) |
| if the graph plots outside the actual plot field of view (e.g. color bars, scale bars, ...) | |
| virtual void | cbSetParent (JKQTBasePlotter *parent) |
| set the parent class for internal objects (e.g. color bars) | |
| JKQTPMathImageColorRangeFailAction | getActionRangeMaxFail () const |
which action to take if a color is above imageMax and autoImageRange ==false | |
| JKQTPMathImageColorRangeFailAction | getActionRangeMinFail () const |
which action to take if a color is below imageMin and autoImageRange ==false | |
| bool | getAutoImageRange () const |
| indicates whether to estimate min/max of the image automatically | |
| int | getColorBarOffset () const |
| offset between outside space border and color bar | |
| double | getColorBarRelativeHeight () const |
| height of the color bar, as multiple of plotHeight | |
| JKQTPVerticalIndependentAxis * | getColorBarRightAxis () |
| object used for color bar axes at the right | |
| const JKQTPVerticalIndependentAxis * | getColorBarRightAxis () const |
| object used for color bar axes at the right | |
| bool | getColorBarRightVisible () const |
| right color bar visible | |
| JKQTPHorizontalIndependentAxis * | getColorBarTopAxis () |
| object used for color bar axes at the top | |
| const JKQTPHorizontalIndependentAxis * | getColorBarTopAxis () const |
| object used for color bar axes at the top | |
| bool | getColorBarTopVisible () const |
| top color bar visible | |
| int | getColorBarWidth () const |
| width of the color bar | |
| JKQTPMathImageColorPalette | getColorPalette () const |
| palette for plotting an image | |
| double | getImageMax () const |
| image value range maximum | |
| double | getImageMin () const |
| image value range minimum | |
| QString | getImageName () const |
| name of the image displayed above color bar (may contain LaTeX markup!) | |
| QString | getImageNameFontName () const |
| font name when displaying imageName | |
| double | getImageNameFontSize () const |
| font size in points when displaying imageName | |
| QColor | getInfColor () const |
| color to use for an infinity value | |
| QColor | getNanColor () const |
| color to use for a not-a-number value | |
| QColor | getRangeMaxFailColor () const |
| color to use for some settings of rangeMaxFailAction | |
| QColor | getRangeMinFailColor () const |
| color to use for some settings of rangeMinFailAction | |
| bool | getShowColorBar () const |
| indicate whether to display a color bar | |
| void | setAutoImageRange (bool __value) |
| indicates whether to estimate min/max of the image automatically | |
| void | setColorBarOffset (int __value) |
| offset between outside space border and color bar | |
| void | setColorBarRelativeHeight (double __value) |
| height of the color bar, as multiple of plotHeight | |
| void | setColorBarRightVisible (bool __value) |
| right color bar visible | |
| void | setColorBarTopVisible (bool __value) |
| top color bar visible | |
| void | setColorBarWidth (int __value) |
| width of the color bar | |
| void | setColorPalette (const JKQTPMathImageColorPalette &__value) |
| palette for plotting an image | |
| void | setColorPalette (int pal) |
| palette for plotting an image | |
| void | setImageMax (double __value) |
| image value range maximum | |
| void | setImageMin (double __value) |
| image value range minimum | |
| void | setImageName (const QString &__value) |
| name of the image displayed above color bar (may contain LaTeX markup!) | |
| void | setImageNameFontName (const QString &__value) |
| font name when displaying imageName | |
| void | setImageNameFontSize (double __value) |
| font size in points when displaying imageName | |
| void | setInfColor (const QColor &__value) |
| color to use for an infinity value | |
| void | setNanColor (const QColor &__value) |
| color to use for a not-a-number value | |
| void | setRangeMaxFailAction (const JKQTPMathImageColorRangeFailAction &__value) |
which action to take if a color is above imageMax and autoImageRange ==false | |
| void | setRangeMaxFailColor (const QColor &__value) |
| color to use for some settings of rangeMaxFailAction | |
| void | setRangeMinFailAction (const JKQTPMathImageColorRangeFailAction &__value) |
which action to take if a color is below imageMin and autoImageRange ==false | |
| void | setRangeMinFailColor (const QColor &__value) |
| color to use for some settings of rangeMinFailAction | |
| void | setShowColorBar (bool __value) |
| indicate whether to display a color bar | |
Protected Member Functions | |
| virtual QColor | getLocalVectorColor (int i, double x, double y, double dx, double dy) const override |
| Protected Member Functions inherited from JKQTPVectorFieldGraph | |
| double | getMaxVecLen () const |
| acess to internally calculated (before draw() actually draws) maximum vector length | |
| double | getMinVecLen () const |
| acess to internally calculated (before draw() actually draws) minimum vector length | |
| Protected Member Functions inherited from JKQTPXYAndVectorGraph | |
| virtual bool | getIndexRange (int &imin, int &imax) const override |
| determines the range of row indexes available in the data columns of this graph | |
| double | getVectorAngle (int i) const |
| QPointF | getVectorDxDy (int i) const |
this function interprets vectorDataLayout together with (dxColumn, dyColumn) or (angleColumn, lengthColumn) or ... and returns the i -th vectors  | |
| double | getVectorMagnitude (int i) const |
| Protected Member Functions inherited from JKQTPXYGraph | |
| int | getDataIndex (int i) const |
| returns the index of the i-th datapoint (where i is an index into the SORTED datapoints) | |
| virtual void | intSortData () |
| sorts data according to the specified criterion in sortData ... The result is stored as a index-map in sorted Indices | |
| Protected Member Functions inherited from JKQTPGraph | |
| virtual void | drawErrorsAfter (JKQTPEnhancedPainter &) |
| this function is used to plot error inidcators after plotting the graphs. | |
| virtual void | drawErrorsBefore (JKQTPEnhancedPainter &) |
| this function is used to plot error inidcators before plotting the graphs. | |
| bool | getDataMinMax (int column, double &minx, double &maxx, double &smallestGreaterZero) |
| get the maximum and minimum value of the given column | |
| Protected Member Functions inherited from JKQTPPlotElement | |
| void | addHitTestData (const HitTestLocation &loc) |
| clear the internal datastore for hitTest() | |
| void | addHitTestData (const QPointF &pos_, const QString &label_) |
| clear the internal datastore for hitTest() | |
| void | addHitTestData (const QPointF &pos_, int index_, const QString &label_) |
| clear the internal datastore for hitTest() | |
| void | addHitTestData (const QPointF &pos_, int index_=-1, const JKQTPDatastore *datastore=nullptr) |
| clear the internal datastore for hitTest(), this variant uses formatHitTestDefaultLabel() to auto-generate the label | |
| void | addHitTestData (double x_, double y_, const QString &label_) |
| add a new point on the graph to the internal datastore for hitTest() | |
| void | addHitTestData (double x_, double y_, int index_, const QString &label_) |
| clear the internal datastore for hitTest() | |
| void | addHitTestData (double x_, double y_, int index_=-1, const JKQTPDatastore *datastore=nullptr) |
| add a new point on the graph to the internal datastore for hitTest(), this variant uses formatHitTestDefaultLabel() to auto-generate the label | |
| void | clearHitTestData () |
| clear the internal datastore for hitTest() | |
| void | reserveHitTestData (int points) |
| reserve list entries for up to points graph points in the internal datastore for hitTest() | |
| QString | xFloatToString (double v, int past_comma=-1) const |
| converts a x-value v into a string, taking into account the type of x-axis | |
| QString | yFloatToString (double v, int past_comma=-1) const |
| converts a x-value v into a string, taking into account the type of x-axis | |
Private Attributes | |
| int | m_colorColumn |
| this column contains the symbol color | |
| bool | m_colorColumnContainsRGB |
| if this is true, the value in the colorColumn is converted to an integer, representing a color in ARGB format (as in QRgb) | |
| double | m_intColMax |
| internally used to store the range of the color column | |
| double | m_intColMin |
| internally used to store the range of the color column | |
| VectorColorMode | m_vectorColorMode |
| indicates how color is determined from data (either from the vector or from m_colorColumn) | |
Additional Inherited Members | |
| Public Slots inherited from JKQTPXYAndVectorGraph | |
| void | setAngleAndLengthColumn (int colAngle, int colLength) |
| det angleColumn and lengthColumn column at the same time! ALso ensures that vectorDataLayout is set accordingly. | |
| void | setAngleColumn (int col) |
| the column that contains the rotation angle [in radian] | |
| void | setDxColumn (int col) |
| the column that contains the delta along the x-axis. | |
| void | setDxDyColumn (int colDx, int colDy) |
| det dxColumn and dyColumn column at the same time! ALso ensures that vectorDataLayout is set accordingly. | |
| void | setDyColumn (int col) |
| the column that contains the delta along the y-axis. | |
| void | setLengthColumn (int col) |
| the column that contains the vector length | |
| Public Slots inherited from JKQTPXYGraph | |
| void | setDataSortOrder (DataSortOrder __value) |
if !=Unsorted, the data is sorted before plotting | |
| void | setDataSortOrder (int __value) |
if !=Unsorted, the data is sorted before plotting | |
| virtual void | setKeyColumn (int __value) |
| sets the column used as "key" for the current graph (typically this call setXColumn(), but for horizontal graphs like filled curves or barcharts it may call setYColumn() ) | |
| virtual void | setValueColumn (int __value) |
| sets the column used as "value" for the current graph (typically this call setXColumn(), but for horizontal graphs like filled curves or barcharts it may call setYColumn() ) | |
| void | setXColumn (int __value) |
| the column that contains the x-component of the datapoints | |
| void | setXColumn (size_t __value) |
| the column that contains the x-component of the datapoints | |
| void | setXYColumns (int xCol, int yCol) |
| sets xColumn and yColumn at the same time | |
| void | setXYColumns (QPair< int, int > xyColPair) |
| sets xColumn and yColumn at the same time | |
| void | setXYColumns (QPair< size_t, size_t > xyColPair) |
| sets xColumn and yColumn at the same time | |
| void | setXYColumns (size_t xCol, size_t yCol) |
| sets xColumn and yColumn at the same time | |
| void | setYColumn (int __value) |
| the column that contains the y-component of the datapoints | |
| void | setYColumn (size_t __value) |
| the column that contains the y-component of the datapoints | |
| Public Slots inherited from JKQTPPlotElement | |
| void | setHighlighted (bool __value) |
| sets whether the graph is drawn in a highlighted style in the plot | |
| virtual void | setTitle (const QString &__value) |
| sets the title of the plot (for display in key!). | |
| void | setVisible (bool __value) |
| sets whether the graph is visible in the plot | |
| Static Public Member Functions inherited from JKQTPColorPaletteStyleAndToolsMixin | |
| static QIcon | getPaletteIcon (int i) |
| get QIcon representing the given palette | |
| static QIcon | getPaletteIcon (JKQTPMathImageColorPalette palette) |
| get QIcon representing the given palette | |
| static QImage | getPaletteImage (int i, size_t width) |
| get QIcon representing the given palette | |
| static QImage | getPaletteImage (JKQTPMathImageColorPalette palette, size_t width) |
| get QIcon representing the given palette | |
| static QIcon | getPaletteKeyIcon (int i) |
| get QIcon representing the given palette | |
| static QIcon | getPaletteKeyIcon (JKQTPMathImageColorPalette palette) |
| get QIcon representing the given palette | |
| static QImage | getPaletteKeyImage (int i, size_t width, size_t height) |
| get QIcon representing the given palette | |
| static QImage | getPaletteKeyImage (JKQTPMathImageColorPalette palette, size_t width, size_t height) |
| get QIcon representing the given palette | |
| static QStringList | getPalettes () |
| get list with all available palettes | |
| static int | getPalettesCount () |
| get list with all available palettes | |
| Static Protected Member Functions inherited from JKQTPXYAndVectorGraph | |
| static double | getVectorAngle (const QPointF &v) |
calculates the rotation angle (3 o'clock is 0) in radians ![$ [0...2\pi] $](form_254_dark.png) | |
| static double | getVectorMagnitude (const QPointF &v) |
| calculates the magnitude/length of a vector v | |
| Protected Attributes inherited from JKQTPXYGraph | |
| QVector< int > | sortedIndices |
| this array contains the order of indices, in which to access the data in the data columns | |
| Protected Attributes inherited from JKQTPPlotElement | |
| QVector< HitTestLocation > | m_hitTestData |
| dataset with graph-points and associated data from the function hitTest() | |
| JKQTBasePlotter * | parent |
| the plotter object this object belongs to | |
| int | parentPlotStyle |
| internal storage for the used parent plot style | |
| Protected Attributes inherited from JKQTPColorPaletteStyleAndToolsMixin | |
| bool | autoImageRange |
| indicates whether to estimate min/max of the image automatically | |
| JKQTBasePlotter * | cbParent |
| int | colorBarOffset |
| offset between outside space border and color bar | |
| double | colorBarRelativeHeight |
| height of the color bar, as multiple of plotHeight | |
| JKQTPVerticalIndependentAxis * | colorBarRightAxis |
| object used for color bar axes at the right | |
| bool | colorBarRightVisible |
| right color bar visible | |
| JKQTPHorizontalIndependentAxis * | colorBarTopAxis |
| object used for color bar axes at the top | |
| bool | colorBarTopVisible |
| top color bar visible | |
| int | colorBarWidth |
| width of the color bar | |
| double | imageMax |
| image value range maximum | |
| double | imageMin |
| image value range minimum | |
| QString | imageName |
| name of the image displayed above color bar (may contain LaTeX markup!) | |
| QString | imageNameFontName |
| font name when displaying imageName | |
| double | imageNameFontSize |
| font size in points when displaying imageName | |
| QColor | infColor |
| color to use for an infinity value | |
| QColor | nanColor |
| color to use for a not-a-number value | |
| JKQTPMathImageColorPalette | palette |
| palette for plotting an image | |
| JKQTPMathImageColorRangeFailAction | rangeMaxFailAction |
which action to take if a color is above imageMax and autoImageRange ==false | |
| QColor | rangeMaxFailColor |
| color to use for some settings of rangeMaxFailAction | |
| JKQTPMathImageColorRangeFailAction | rangeMinFailAction |
which action to take if a color is below imageMin and autoImageRange ==false | |
| QColor | rangeMinFailColor |
| color to use for some settings of rangeMinFailAction | |
| bool | showColorBar |
| indicate whether to display a color bar | |
| Properties inherited from JKQTPVectorFieldGraph | |
| VectorAnchorPoint | anchorPoint |
| bool | autoscaleLengthFactor |
| double | lengthScaleFactor |
| double | minLineWidth |
| VectorLengthMode | vectorLengthMode |
| VectorLineWidthMode | vectorLineWidthMode |
| Properties inherited from JKQTPXYAndVectorGraph | |
| int | angleColumn |
| the column that contains the rotation angle [in radian] | |
| int | dxColumn |
| the column that contains the delta along the x-axis. | |
| int | dyColumn |
| the column that contains the delta along the y-axis. | |
| int | lengthColumn |
| the column that contains the vector length | |
| VectorDataLayout | vectorDataLayout |
| indicates, which column pairs to use (dxColumn, dyColumn), (angleColumn, lengthColumn), ... | |
| Properties inherited from JKQTPXYGraph | |
| DataSortOrder | sortData |
if !=Unsorted, the data is sorted before plotting | |
| int | xColumn |
| the column that contains the x-component of the datapoints | |
| int | yColumn |
| the column that contains the y-component of the datapoints | |
| Properties inherited from JKQTPPlotElement | |
| bool | highlighted |
| indicates whether the graph is shown in a "highlghted" in the plot | |
| QString | title |
| title of the plot (for display in key!). If no title is supplied, no key entry is drawn. | |
| bool | visible |
| indicates whether the graph is visible in the plot | |
| JKQTPCoordinateAxisRef | xAxisRef |
| indicates which coordinate axis to use for coordinate transforms in x-direction | |
| JKQTPCoordinateAxisRef | yAxisRef |
| indicates which coordinate axis to use for coordinate transforms in y-direction | |
| Properties inherited from JKQTPGraphDecoratedLineStyleMixin | |
| double | headDecoratorSizeFactor |
| JKQTPLineDecoratorStyle | headDecoratorStyle |
| double | tailDecoratorSizeFactor |
| JKQTPLineDecoratorStyle | tailDecoratorStyle |
| Properties inherited from JKQTPGraphLineStyleMixin | |
| QColor | highlightingLineColor |
| QColor | lineColor |
| Qt::PenStyle | lineStyle |
| double | lineWidth |
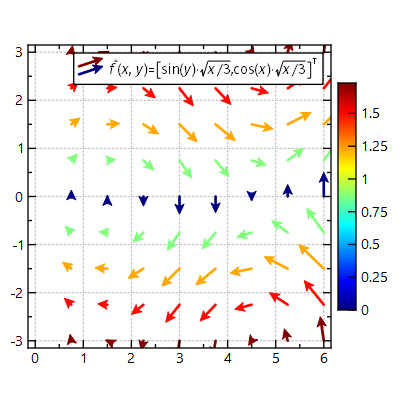
This graph plots a vector field, i.e. a set of vectors (dx,dy) or (angle,length) at positions (x,y). This class is an extension of JKQTPVectorFieldGraph and additionally supports setting the line-color from an additional data column.
To achieve this, use code like this:
Use setVectorColorMode() if you don't want to use a custom column, but just use the vector's magnitude/length or rotation angle as parameter for the color.
determines how the color of the vector is determined
| Enumerator | |
|---|---|
| DefaultColor | no color-coding, just use getLineColor() 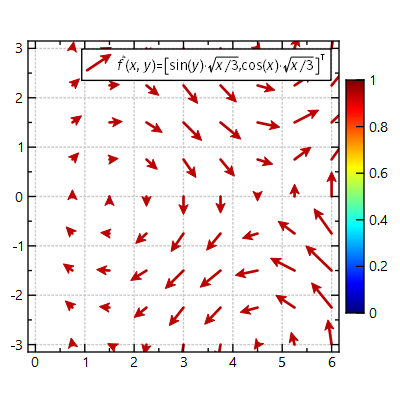
|
| ColorFromMagnitude | color-coding by vector magnitude/length 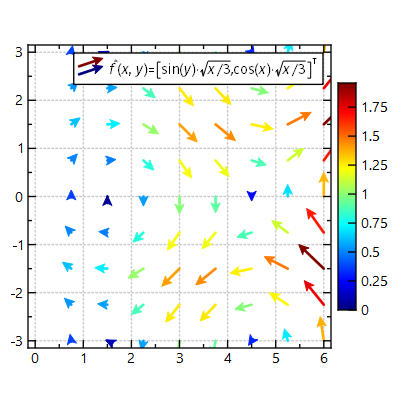
|
| ColorFromAngle | color-coding by vector angle 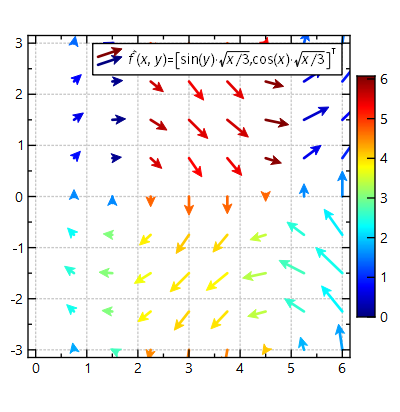
|
| ColorFromCustomColumn | color-coding from getColorColumn() column
|
|
explicit |
class constructor
| JKQTPParametrizedVectorFieldGraph::JKQTPParametrizedVectorFieldGraph | ( | JKQTPlotter * | parent | ) |
class constructor
|
overridevirtual |
determine min/max data value of the image
Implements JKQTPColorPaletteStyleAndToolsMixin.
|
overridevirtual |
plots the graph to the plotter object specified as parent
Reimplemented from JKQTPVectorFieldGraph.
|
overridevirtual |
plots a key marker inside the specified rectangle rect
Reimplemented from JKQTPVectorFieldGraph.
|
overridevirtual |
plots outside the actual plot field of view (e.g. color bars, scale bars, ...)
The four value supplied tell the method where to draw (inside one of the rectangles).
Reimplemented from JKQTPPlotElement.
| int JKQTPParametrizedVectorFieldGraph::getColorColumn | ( | ) | const |
this column contains the symbol color
| bool JKQTPParametrizedVectorFieldGraph::getColorColumnContainsRGB | ( | ) | const |
if this is true, the value in the colorColumn is converted to an integer, representing a color in ARGB format (as in QRgb)
|
overrideprotectedvirtual |
\copdydoc JKQTPVectorFieldGraph::getLocalVectorColor()
Reimplemented from JKQTPVectorFieldGraph.
|
overridevirtual |
if the graph plots outside the actual plot field of view (e.g. color bars, scale bars, ...)
Reimplemented from JKQTPPlotElement.
| VectorColorMode JKQTPParametrizedVectorFieldGraph::getVectorColorMode | ( | ) | const |
indicates how color is determined from data (either from the vector or from m_colorColumn)
| void JKQTPParametrizedVectorFieldGraph::setColorColumn | ( | int | __value | ) |
this column contains the symbol color
| void JKQTPParametrizedVectorFieldGraph::setColorColumn | ( | size_t | __value | ) |
this column contains the symbol color
| void JKQTPParametrizedVectorFieldGraph::setColorColumnContainsRGB | ( | bool | __value | ) |
if this is true, the value in the colorColumn is converted to an integer, representing a color in ARGB format (as in QRgb)
|
overridevirtual |
sets the parent painter class
Reimplemented from JKQTPPlotElement.
| void JKQTPParametrizedVectorFieldGraph::setVectorColorMode | ( | VectorColorMode | __value | ) |
indicates how color is determined from data (either from the vector or from m_colorColumn)
|
overridevirtual |
returns true if the given column is used by the graph
This virtual function indicates whether a given column is used by this graph. Override this function in your derived graphs to indicate to JKQTPlotter / JKQTBasePlotter , which columns from the internal JKQTPDatastore are actually used. This information can be used e.g. for graph-specific data-export.
Reimplemented from JKQTPXYAndVectorGraph.
|
private |
this column contains the symbol color
|
private |
if this is true, the value in the colorColumn is converted to an integer, representing a color in ARGB format (as in QRgb)
|
private |
internally used to store the range of the color column
|
private |
internally used to store the range of the color column
|
private |
indicates how color is determined from data (either from the vector or from m_colorColumn)