|
JKQTPlotter trunk/v5.0.0
an extensive Qt5+Qt6 Plotter framework (including a feature-richt plotter widget, a speed-optimized, but limited variant and a LaTeX equation renderer!), written fully in C/C++ and without external dependencies
|
|
JKQTPlotter trunk/v5.0.0
an extensive Qt5+Qt6 Plotter framework (including a feature-richt plotter widget, a speed-optimized, but limited variant and a LaTeX equation renderer!), written fully in C/C++ and without external dependencies
|
This is a base-class for all bar graphs with vertical or horizontal orientation (the orientation is implemented in dervied classes!) More...
#include <jkqtpbarchartbase.h>
Classes | |
| struct | SimpleFillBrushFunctorAdaptor |
| adapter that converts a SimpleFillBrushFunctor to a FillBrushFunctor More... | |
Public Types | |
| typedef std::function< void(JKQTPEnhancedPainter &painter, const QRectF &bar_px, const QPointF &datapoint, Qt::Orientation orientation, JKQTPBarGraphBase *graph)> | CustomDrawingFunctor |
| functor for custom drawing of bars | |
| typedef std::function< QBrush(double key, double value, JKQTPEnhancedPainter &painter, JKQTPBarGraphBase *graph)> | FillBrushFunctor |
| a type of functor for FillMode::FunctorFilling | |
| enum | FillMode { SingleFilling =0 , TwoColorFilling =1 , FunctorFilling =2 } |
| specifies how the area below the graph is filled More... | |
| typedef std::function< QBrush(double key, double value)> | SimpleFillBrushFunctor |
| a simplified type of functor for FillMode::FunctorFilling | |
| Public Types inherited from JKQTPXYGraph | |
| enum | DataSortOrder { Unsorted =0 , SortedX =1 , SortedY =2 } |
| specifies how to sort the data in a JKQTPXYGraph before drawing More... | |
| Public Types inherited from JKQTPPlotElement | |
| enum | HitTestMode { HitTestXY , HitTestXOnly , HitTestYOnly } |
| modes of operation for the function hitTest() More... | |
Public Slots | |
| virtual void | autoscaleBarWidthAndShift (double maxWidth=0.75, double shrinkFactor=0.9) |
| finds all bar charts of the same orientation and determines width and shift, so they stand side by side | |
| void | autoscaleBarWidthAndShiftSeparatedGroups (double groupWidth=0.75) |
equivalent to autoscaleBarWidthAndShift(groupWidth,0.9); | |
| void | setBarHeightColumn (int column) |
| returns xColumn or yColumn, whichever is used for the height of the bars (depending on whether the barchart is vertical or horizontal | |
| void | setBarHeightColumn (size_t column) |
| returns xColumn or yColumn, whichever is used for the height of the bars (depending on whether the barchart is vertical or horizontal | |
| void | setBarPositionColumn (int column) |
| returns xColumn or yColumn, whichever is used for the position of the bars (depending on whether the barchart is vertical or horizontal | |
| void | setBarPositionColumn (size_t column) |
| returns xColumn or yColumn, whichever is used for the position of the bars (depending on whether the barchart is vertical or horizontal | |
| virtual void | setColor (QColor c) |
| set outline and fill color at the same time | |
| void | setCustomDrawingFunctor (const JKQTPBarGraphBase::CustomDrawingFunctor &f) |
this allows to provide custom drawing code for the bars. It is called for every visible bar if activated by setUseCustomDrawFunctor(true) . | |
| void | setCustomDrawingFunctor (JKQTPBarGraphBase::CustomDrawingFunctor &&f) |
this allows to provide custom drawing code for the bars. It is called for every visible bar if activated by setUseCustomDrawFunctor(true) . | |
| void | setDrawBaseline (bool __value) |
| indicates whether to draw a line with style m_baselineStyle at the baseline-value | |
| void | setFillBrushFunctor (const JKQTPBarGraphBase::FillBrushFunctor &f) |
| functor, used to determine the color in m_fillMode==FunctorFilling | |
| void | setFillBrushFunctor (const JKQTPBarGraphBase::SimpleFillBrushFunctor &f) |
| functor, used to determine the color in m_fillMode==FunctorFilling | |
| void | setFillBrushFunctor (JKQTPBarGraphBase::FillBrushFunctor &&f) |
| functor, used to determine the color in m_fillMode==FunctorFilling | |
| void | setFillBrushFunctor (JKQTPBarGraphBase::SimpleFillBrushFunctor &&f) |
| functor, used to determine the color in m_fillMode==FunctorFilling | |
| void | setFillMode (JKQTPBarGraphBase::FillMode mode) |
| specifies how the area of the graph is filles | |
| void | setLineColorDerivationModeForSpecialFill (const JKQTPColorDerivationMode &m) |
| defines how to derive the line color in m_fillMode!=SingleFilling | |
| void | setRectRadius (double all) |
| sets the corner radius of the bars for both ends | |
| void | setRectRadius (double atValue, double atBaseline) |
| sets the corner radius of the bars for both ends | |
| void | setRectRadiusAtBaseline (double __value) |
| corner radius (in pt) for bars at the "baseline" end | |
| void | setRectRadiusAtValue (double __value) |
| corner radius (in pt) for bars at the "value" end | |
| void | setShift (double __value) |
| the shift of the bargraphs, relative to the distance between the current and the next x-value | |
| void | setStackSeparation (double __value) |
| separation (in pt) between two bars in a stack of bars | |
| void | setUseCustomDrawFunctor (bool enabled) |
| enabled custom drawing by m_customDrawFunctor | |
| void | setWidth (double __value) |
| the width of the bargraphs, relative to the distance between the current and the next x-value | |
| Public Slots inherited from JKQTPXYBaselineGraph | |
| void | setBaseline (double __value) |
| baseline of the plot (NOTE: 0 is interpreted as until plot border in log-mode!!!) | |
| Public Slots inherited from JKQTPXYGraph | |
| void | setDataSortOrder (DataSortOrder __value) |
if !=Unsorted, the data is sorted before plotting | |
| void | setDataSortOrder (int __value) |
if !=Unsorted, the data is sorted before plotting | |
| virtual void | setKeyColumn (int __value) |
| sets the column used as "key" for the current graph (typically this call setXColumn(), but for horizontal graphs like filled curves or barcharts it may call setYColumn() ) | |
| virtual void | setValueColumn (int __value) |
| sets the column used as "value" for the current graph (typically this call setXColumn(), but for horizontal graphs like filled curves or barcharts it may call setYColumn() ) | |
| void | setXColumn (int __value) |
| the column that contains the x-component of the datapoints | |
| void | setXColumn (size_t __value) |
| the column that contains the x-component of the datapoints | |
| void | setXYColumns (int xCol, int yCol) |
| sets xColumn and yColumn at the same time | |
| void | setXYColumns (QPair< int, int > xyColPair) |
| sets xColumn and yColumn at the same time | |
| void | setXYColumns (QPair< size_t, size_t > xyColPair) |
| sets xColumn and yColumn at the same time | |
| void | setXYColumns (size_t xCol, size_t yCol) |
| sets xColumn and yColumn at the same time | |
| void | setYColumn (int __value) |
| the column that contains the y-component of the datapoints | |
| void | setYColumn (size_t __value) |
| the column that contains the y-component of the datapoints | |
| Public Slots inherited from JKQTPPlotElement | |
| void | setHighlighted (bool __value) |
| sets whether the graph is drawn in a highlighted style in the plot | |
| virtual void | setTitle (const QString &__value) |
| sets the title of the plot (for display in key!). | |
| void | setVisible (bool __value) |
| sets whether the graph is visible in the plot | |
Public Member Functions | |
| JKQTPBarGraphBase (JKQTBasePlotter *parent=nullptr) | |
| class constructor | |
| JKQTPBarGraphBase (JKQTPlotter *parent) | |
| class constructor | |
| JKQTPGraphLineStyleMixin & | baselineStyle () |
if m_drawBaseline ==true then this style is used to draw the baseline | |
| const JKQTPGraphLineStyleMixin & | baselineStyle () const |
if m_drawBaseline ==true then this style is used to draw the baseline | |
| virtual void | drawKeyMarker (JKQTPEnhancedPainter &painter, const QRectF &rect) override |
| plots a key marker inside the specified rectangle rect | |
| JKQTPGraphFillStyleMixin & | fillStyleBelow () |
if m_fillMode ==FillAboveAndBelowDifferently then this fill style is used below the baseline and the default fill style is used above | |
| const JKQTPGraphFillStyleMixin & | fillStyleBelow () const |
if m_fillMode ==FillAboveAndBelowDifferently then this fill style is used below the baseline and the default fill style is used above | |
| int | getBarHeightColumn () const |
| returns xColumn or yColumn, whichever is used for the height of the bars (depending on whether the barchart is vertical or horizontal | |
| int | getBarPositionColumn () const |
| returns xColumn or yColumn, whichever is used for the position of the bars (depending on whether the barchart is vertical or horizontal | |
| bool | getDrawBaseline () const |
| indicates whether to draw a line with style m_baselineStyle at the baseline-value | |
| FillBrushFunctor & | getFillBrushFunctor () |
| functor, used to determine the color in m_fillMode==FunctorFilling | |
| const FillBrushFunctor & | getFillBrushFunctor () const |
| functor, used to determine the color in m_fillMode==FunctorFilling | |
| FillMode | getFillMode () const |
| specifies how the area of the graph is filles | |
| virtual QColor | getKeyLabelColor () const override |
| returns the color to be used for the key label | |
| JKQTPColorDerivationMode | getLineColorDerivationModeForSpecialFill () const |
| defines how to derive the line color in m_fillMode!=SingleFilling | |
| double | getRectRadiusAtBaseline () const |
| corner radius (in pt) for bars at the "baseline" end | |
| double | getRectRadiusAtValue () const |
| corner radius (in pt) for bars at the "value" end | |
| double | getShift () const |
| the shift of the bargraphs, relative to the distance between the current and the next x-value | |
| double | getStackSeparation () const |
| separation (in pt) between two bars in a stack of bars | |
| double | getWidth () const |
| the width of the bargraphs, relative to the distance between the current and the next x-value | |
| void | setFillColor_and_darkenedColor (QColor fill, int colorDarker=200) |
sets the fill color and the color together, where fillColor is set to fill and the line-color is set to fill.darker(colorDarker) | |
| bool | usesCustomDrawFunctor () const |
| enabled custom drawing by m_customDrawFunctor | |
| Public Member Functions inherited from JKQTPXYBaselineGraph | |
| JKQTPXYBaselineGraph (JKQTBasePlotter *parent=nullptr) | |
| class constructor | |
| double | getBaseline () const |
| baseline of the plot (NOTE: 0 is interpreted as until plot border in log-mode!!!) | |
| Public Member Functions inherited from JKQTPXYGraph | |
| JKQTPXYGraph (JKQTBasePlotter *parent=nullptr) | |
| class constructor | |
| DataSortOrder | getDataSortOrder () const |
if !=Unsorted, the data is sorted before plotting | |
| virtual int | getKeyColumn () const |
| returns the column used as "key" for the current graph (typically this call getXColumn(), but for horizontal graphs like filled curves or barcharts it may call getYColumn() ) | |
| virtual int | getValueColumn () const |
| returns the column used as "value" for the current graph (typically this call getXColumn(), but for horizontal graphs like filled curves or barcharts it may call getYColumn() ) | |
| int | getXColumn () const |
| the column that contains the x-component of the datapoints | |
| virtual bool | getXMinMax (double &minx, double &maxx, double &smallestGreaterZero) override |
| get the maximum and minimum x-value of the graph | |
| int | getYColumn () const |
| the column that contains the y-component of the datapoints | |
| virtual bool | getYMinMax (double &miny, double &maxy, double &smallestGreaterZero) override |
| get the maximum and minimum y-value of the graph | |
| virtual double | hitTest (const QPointF &posSystem, QPointF *closestSpotSystem=nullptr, QString *label=nullptr, HitTestMode mode=HitTestXY) const override |
| Implmentation of JKQTPPlotElement::hitTest(), which searches through all graph points defined by xColumn and yColumn and returns a general x/y-label, also taking into account possibly known errors to the graphs (if it is derived from JKQTPXGraphErrorData and/or JKQTPYGraphErrorData. | |
| virtual bool | usesColumn (int column) const override |
returns true if the given column is used by the graph | |
| Public Member Functions inherited from JKQTPGraph | |
| JKQTPGraph (JKQTBasePlotter *parent=nullptr) | |
| class constructor | |
| virtual | ~JKQTPGraph ()=default |
| default wirtual destructor | |
| Public Member Functions inherited from JKQTPPlotElement | |
| JKQTPPlotElement (JKQTBasePlotter *parent=nullptr) | |
| class constructor | |
| virtual | ~JKQTPPlotElement ()=default |
| default wirtual destructor | |
| QPointF | backTransform (const QPointF &x) const |
| tool routine that back-transforms a QPointF according to the parent's transformation rules (pixels --> plot coordinate) | |
| QPointF | backTransform (double x, double y) const |
| tool routine that back-transforms a QPointF according to the parent's transformation rules (pixels --> plot coordinate) | |
| double | backtransformX (double x) const |
| tool routine that backtransforms an x-coordinate (pixels --> plot coordinate) for this plot element, uses the axis referenced in xAxisRef | |
| double | backtransformY (double y) const |
| tool routine that backtransforms a y-coordinate (pixels --> plot coordinate) for this plot element, uses the axis referenced in yAxisRef | |
| virtual void | draw (JKQTPEnhancedPainter &painter)=0 |
| plots the graph to the plotter object specified as parent | |
| virtual void | drawOutside (JKQTPEnhancedPainter &painter, QRect leftSpace, QRect rightSpace, QRect topSpace, QRect bottomSpace) |
| plots outside the actual plot field of view (e.g. color bars, scale bars, ...) | |
| QImage | generateKeyMarker (QSize size=QSize(16, 16)) |
| returns an image with a key marker inside | |
| virtual void | getOutsideSize (JKQTPEnhancedPainter &painter, int &leftSpace, int &rightSpace, int &topSpace, int &bottomSpace) |
| if the graph plots outside the actual plot field of view (e.g. color bars, scale bars, ...) | |
| JKQTBasePlotter * | getParent () |
| returns the parent painter class | |
| const JKQTBasePlotter * | getParent () const |
| returns the parent painter class | |
| QString | getTitle () const |
| returns the the title of the plot | |
| const JKQTPCoordinateAxis * | getXAxis () const |
| returns the actual x-Axis-object from the parent plotter, referenced in xAxisRef | |
| JKQTPCoordinateAxisRef | getXAxisRef () const |
| indicates which coordinate axis to use for coordinate transforms in x-direction | |
| const JKQTPCoordinateAxis * | getYAxis () const |
| returns the actual y-Axis-object from the parent plotter, referenced in yAxisRef | |
| JKQTPCoordinateAxisRef | getYAxisRef () const |
| indicates which coordinate axis to use for coordinate transforms in y-direction | |
| bool | isHighlighted () const |
| returns whether the graph is shown in a highlighted style in the plot | |
| bool | isVisible () const |
| returns whether the graph is visible in the plot | |
| void | setAxes (JKQTPCoordinateAxisRef ref) |
| set the coordinate axes to use for this plot element | |
| virtual void | setParent (JKQTBasePlotter *parent) |
| sets the parent painter class | |
| virtual void | setParent (JKQTPlotter *parent) |
| sets the parent painter class | |
| void | setXAxis (JKQTPCoordinateAxisRef ref) |
| indicates which coordinate axis to use for coordinate transforms in x-direction | |
| void | setYAxis (JKQTPCoordinateAxisRef ref) |
| indicates which coordinate axis to use for coordinate transforms in y-direction | |
| QPointF | transform (const QPointF &x) const |
| tool routine that transforms a QPointF according to the parent's transformation rules (plot coordinate --> pixels) | |
| QPolygonF | transform (const QPolygonF &x) const |
| tool routine that transforms a QPolygonF according to the parent's transformation rules (plot coordinate --> pixels) | |
| QPointF | transform (double x, double y) const |
| tool routine that transforms a QPointF according to the parent's transformation rules (plot coordinate --> pixels) | |
| QPainterPath | transformToLinePath (const QPolygonF &x) const |
| tool routine that transforms a QPolygonF according to the parent's transformation rules and returns a (non-closed) path consisting of lines (plot coordinate --> pixels) | |
| QVector< double > | transformX (const QVector< double > &x) const |
| transform all x-coordinates in a vector x | |
| double | transformX (double x) const |
| tool routine that transforms an x-coordinate (plot coordinate --> pixels) for this plot element, uses the axis referenced in xAxisRef | |
| QVector< double > | transformY (const QVector< double > &x) const |
| transform all y-coordinates in a vector x | |
| double | transformY (double y) const |
| tool routine that transforms a y-coordinate (plot coordinate --> pixels) for this plot element, uses the axis referenced in yAxisRef | |
| Public Member Functions inherited from JKQTPGraphLineStyleMixin | |
| JKQTPGraphLineStyleMixin () | |
| class constructor | |
| virtual | ~JKQTPGraphLineStyleMixin () |
| QColor | getHighlightingLineColor () const |
| get the color of the graph line when highlighted | |
| QPen | getHighlightingLinePen (JKQTPEnhancedPainter &painter, JKQTBasePlotter *parent) const |
| constructs a QPen from the line styling properties | |
| QPen | getHighlightingLinePenForRects (JKQTPEnhancedPainter &painter, JKQTBasePlotter *parent) const |
| constructs a QPen from the line styling properties, suitable for drawing rectangle with sharp corners | |
| QPen | getKeyLinePen (JKQTPEnhancedPainter &painter, const QRectF &rect, JKQTBasePlotter *parent) const |
| constructs a QPen from the line styling properties, but uses getKeyLineWidthPx() for the width, i.e. constructs a pen for drawing lines in key-symbols | |
| double | getKeyLineWidthPx (JKQTPEnhancedPainter &painter, const QRectF &keyRect, const JKQTBasePlotter *parent) const |
| returns the linewidth for drawing lines in a key entry with keyRect for the symbol, using painter and parent . | |
| QBrush | getLineBrush () const |
| gets the brush used to fill the line area | |
| Qt::PenCapStyle | getLineCapStyle () const |
| gets the cap style | |
| QColor | getLineColor () const |
| get the color of the graph line | |
| qreal | getLineDashOffset () const |
| returns the dash offset for a custom dash style | |
| QVector< qreal > | getLineDashPattern () const |
| gets the dash pattern for a custom dash style | |
| Qt::PenJoinStyle | getLineJoinStyle () const |
| returns the join style | |
| QPen | getLinePen (JKQTPEnhancedPainter &painter, JKQTBasePlotter *parent) const |
| constructs a QPen from the line styling properties | |
| QPen | getLinePenForRects (JKQTPEnhancedPainter &painter, JKQTBasePlotter *parent) const |
| constructs a QPen from the line styling properties, suitable for drawing rectangles with sharp edges | |
| Qt::PenStyle | getLineStyle () const |
| get the style of the graph line | |
| double | getLineWidth () const |
| get the line width of the graph line (in pt) | |
| void | initLineStyle (JKQTBasePlotter *parent, int &parentPlotStyle, JKQTPPlotStyleType styletype=JKQTPPlotStyleType::Default) |
| initiaize the line style (from the parent plotter) | |
| void | setHighlightingLineColor (const QColor &__value) |
| set the color of the graph line when highlighted | |
| void | setHighlightingLineColor (const QColor &__value, double alpha) |
| set the color of the graph line when highlighted | |
| void | setLineBrush (const QBrush &style) |
| sets the brush used to fill the line area | |
| void | setLineCapStyle (Qt::PenCapStyle style) |
| sets the cap style | |
| void | setLineColor (const QColor &__value) |
| set the color of the graph line | |
| void | setLineColor (const QColor &__value, double alpha) |
| set the color of the graph line | |
| void | setLineColorInvertedFrom (QColor __noninvertedColor) |
| sets the line-color as an inverted version of the given color | |
| void | setLineDashOffset (qreal offset) |
| sets the dash offset for a custom dash style | |
| void | setLineDashPattern (const QVector< qreal > &pattern) |
| sets the dash pattern for a custom dash style | |
| void | setLineJoinStyle (Qt::PenJoinStyle style) |
| sets the join style | |
| void | setLineStyle (Qt::PenStyle __value) |
| set the style of the graph line | |
| void | setLineWidth (double __value) |
| set the line width of the graph line (in pt) | |
| Public Member Functions inherited from JKQTPGraphFillStyleMixin | |
| JKQTPGraphFillStyleMixin () | |
| class constructor | |
| virtual | ~JKQTPGraphFillStyleMixin () |
| QBrush | getFillBrush (JKQTPEnhancedPainter &painter, JKQTBasePlotter *parent) const |
| constructs a QBrush from the graph fill styling properties | |
| QColor | getFillColor () const |
| set the color of the graph filling | |
| const QGradient * | getFillGradient () const |
| get the gradient object of the graph filling | |
| Qt::BrushStyle | getFillStyle () const |
| get the fill style of the graph | |
| QPixmap | getFillTexture () const |
| set the color of the graph filling | |
| QImage | getFillTextureImage () const |
| set the color of the graph filling | |
| void | initFillStyle (JKQTBasePlotter *parent, int &parentPlotStyle, JKQTPPlotStyleType styletype=JKQTPPlotStyleType::Default) |
| initiaize the fill style (from the parent plotter) | |
| void | initFillStyleInvertedColor (JKQTPGraphFillStyleMixin *other) |
| initiaize the fill style from another JKQTPGraphFillStyleMixin other by inverting its fill color | |
| void | setFillBrush (const QBrush &b) |
| sets a fill brush (overwrites all internal properties!) | |
| void | setFillColor (const QColor &__value) |
| set the color of the graph filling | |
| void | setFillColor (const QColor &__value, double alpha) |
| set the color of the graph filling | |
| void | setFillGradient (const QGradient &__value) |
| set the filling of the graph to a gradient and sets fill style to a gradient setting | |
| void | setFillStyle (Qt::BrushStyle __value) |
| set the fill style of the graph | |
| void | setFillTexture (const QImage &__value) |
| set the color of the graph filling and sets fill style to Qt::TexturePattern | |
| void | setFillTexture (const QPixmap &__value) |
| set the color of the graph filling and sets fill style to Qt::TexturePattern | |
| void | setFillTransform (const QTransform &b) |
| sets a fill transformation | |
Protected Member Functions | |
| virtual bool | considerForAutoscaling (JKQTPBarGraphBase *other) const =0 |
this function is used by autoscaleBarWidthAndShift() to determine whether a given graph shall be taken into account when autoscaling. Typically this returns true for all JKQTPBarGraphBase-derived objects with the same orientation (horizontal or vertical). For stacked graphs it excludes everything except the bottom of the stack | |
| virtual FillBrushFunctor | constructFillBrushFunctor () const |
| returns a FillBrushFunctor that is appropriate for the currently selected m_fillMode | |
| virtual double | getParentStackedMax (int index) const |
| used to generate stacked plots: returns the upper boundary of the parent plot in a stack, for the index-th datapoint | |
| bool | getPositionsMinMax (double &mmin, double &mmax, double &smallestGreaterZero) |
| get the maximum and minimum value of the box positions of the graph | |
| bool | getValuesMinMax (double &mmin, double &mmax, double &smallestGreaterZero) |
| get the maximum and minimum value in the box-elongation (i.e. value) direction of the graph | |
| virtual bool | hasStackParent () const |
returns true, if a stack parent is set (if available) | |
| Protected Member Functions inherited from JKQTPXYBaselineGraph | |
| bool | getMinMaxWithBaseline (int dataColumn, double &minv, double &maxv, double &smallestGreaterZero) |
| can be called by JKQTPGraph::getXMinMax() or JKQTPGraph::getYMinMax() calculates min/max/... for data from the given column, including the baseline | |
| bool | getMinMaxWithErrorsAndBaseline (int dataColumn, int errorColumn, int errorColumnLower, bool errorSymmetric, double &minv, double &maxv, double &smallestGreaterZero) |
| can be called by JKQTPGraph::getXMinMax() or JKQTPGraph::getYMinMax() calculates min/max/... for data from the given column, including the baseline and an optional error | |
| Protected Member Functions inherited from JKQTPXYGraph | |
| int | getDataIndex (int i) const |
| returns the index of the i-th datapoint (where i is an index into the SORTED datapoints) | |
| virtual bool | getIndexRange (int &imin, int &imax) const |
| determines the range of row indexes available in the data columns of this graph | |
| virtual void | intSortData () |
| sorts data according to the specified criterion in sortData ... The result is stored as a index-map in sorted Indices | |
| Protected Member Functions inherited from JKQTPGraph | |
| virtual void | drawErrorsAfter (JKQTPEnhancedPainter &) |
| this function is used to plot error inidcators after plotting the graphs. | |
| virtual void | drawErrorsBefore (JKQTPEnhancedPainter &) |
| this function is used to plot error inidcators before plotting the graphs. | |
| bool | getDataMinMax (int column, double &minx, double &maxx, double &smallestGreaterZero) |
| get the maximum and minimum value of the given column | |
| Protected Member Functions inherited from JKQTPPlotElement | |
| void | addHitTestData (const HitTestLocation &loc) |
| clear the internal datastore for hitTest() | |
| void | addHitTestData (const QPointF &pos_, const QString &label_) |
| clear the internal datastore for hitTest() | |
| void | addHitTestData (const QPointF &pos_, int index_, const QString &label_) |
| clear the internal datastore for hitTest() | |
| void | addHitTestData (const QPointF &pos_, int index_=-1, const JKQTPDatastore *datastore=nullptr) |
| clear the internal datastore for hitTest(), this variant uses formatHitTestDefaultLabel() to auto-generate the label | |
| void | addHitTestData (double x_, double y_, const QString &label_) |
| add a new point on the graph to the internal datastore for hitTest() | |
| void | addHitTestData (double x_, double y_, int index_, const QString &label_) |
| clear the internal datastore for hitTest() | |
| void | addHitTestData (double x_, double y_, int index_=-1, const JKQTPDatastore *datastore=nullptr) |
| add a new point on the graph to the internal datastore for hitTest(), this variant uses formatHitTestDefaultLabel() to auto-generate the label | |
| void | clearHitTestData () |
| clear the internal datastore for hitTest() | |
| virtual QString | formatHitTestDefaultLabel (double x, double y, int index=-1, const JKQTPDatastore *datastore=nullptr) const |
| tool-function for hitTest(), which formats a default label, taking into account the x- and y-position (both provided) and optionally the errors of these positions. | |
| void | reserveHitTestData (int points) |
| reserve list entries for up to points graph points in the internal datastore for hitTest() | |
| QString | xFloatToString (double v, int past_comma=-1) const |
| converts a x-value v into a string, taking into account the type of x-axis | |
| QString | yFloatToString (double v, int past_comma=-1) const |
| converts a x-value v into a string, taking into account the type of x-axis | |
Protected Attributes | |
| JKQTPGraphLineStyleMixin | m_baselineStyle |
if m_drawBaseline ==true then this style is used to draw the baseline | |
| CustomDrawingFunctor | m_customDrawFunctor |
this allows to provide custom drawing code for the bars. It is called for every visible bar if activated by setUseCustomDrawFunctor(true) . | |
| bool | m_drawBaseline |
| indicates whether to draw a line with style m_baselineStyle at the baseline-value | |
| FillBrushFunctor | m_fillBrushFunctor |
| functor, used to determine the color in m_fillMode==FunctorFilling | |
| FillMode | m_fillMode |
| specifies how the area of the graph is filles | |
| JKQTPGraphFillStyleMixin | m_fillStyleBelow |
if m_fillMode ==FillAboveAndBelowDifferently then this fill style is used below the baseline and the default fill style is used above | |
| JKQTPColorDerivationMode | m_lineColorDerivationModeForSpecialFill |
| defines how to derive the line color in m_fillMode!=SingleFilling | |
| double | m_stackSeparation |
| separation (in pt) between two bars in a stack of bars | |
| bool | m_useCustomDrawFunctor |
| enabled custom drawing by m_customDrawFunctor | |
| double | rectRadiusAtBaseline |
| corner radius (in pt) for bars at the "baseline" end | |
| double | rectRadiusAtValue |
| corner radius (in pt) for bars at the "value" end | |
| double | shift |
| the shift of the bargraphs, relative to the distance between the current and the next x-value | |
| double | width |
| the width of the bargraphs, relative to the distance between the current and the next x-value | |
| Protected Attributes inherited from JKQTPXYBaselineGraph | |
| double | m_baseline |
| baseline of the plot (NOTE: 0 is interpreted as until plot border in log-mode!!!) | |
| Protected Attributes inherited from JKQTPXYGraph | |
| QVector< int > | sortedIndices |
| this array contains the order of indices, in which to access the data in the data columns | |
| Protected Attributes inherited from JKQTPPlotElement | |
| QVector< HitTestLocation > | m_hitTestData |
| dataset with graph-points and associated data from the function hitTest() | |
| JKQTBasePlotter * | parent |
| the plotter object this object belongs to | |
| int | parentPlotStyle |
| internal storage for the used parent plot style | |
Additional Inherited Members | |
| Properties inherited from JKQTPXYBaselineGraph | |
| double | baseline |
| Properties inherited from JKQTPXYGraph | |
| DataSortOrder | sortData |
if !=Unsorted, the data is sorted before plotting | |
| int | xColumn |
| the column that contains the x-component of the datapoints | |
| int | yColumn |
| the column that contains the y-component of the datapoints | |
| Properties inherited from JKQTPPlotElement | |
| bool | highlighted |
| indicates whether the graph is shown in a "highlghted" in the plot | |
| QString | title |
| title of the plot (for display in key!). If no title is supplied, no key entry is drawn. | |
| bool | visible |
| indicates whether the graph is visible in the plot | |
| JKQTPCoordinateAxisRef | xAxisRef |
| indicates which coordinate axis to use for coordinate transforms in x-direction | |
| JKQTPCoordinateAxisRef | yAxisRef |
| indicates which coordinate axis to use for coordinate transforms in y-direction | |
| Properties inherited from JKQTPGraphLineStyleMixin | |
| QColor | highlightingLineColor |
| QColor | lineColor |
| Qt::PenStyle | lineStyle |
| double | lineWidth |
| Properties inherited from JKQTPGraphFillStyleMixin | |
| QColor | fillColor |
| Qt::BrushStyle | fillStyle |
This is a base-class for all bar graphs with vertical or horizontal orientation (the orientation is implemented in dervied classes!)
This class provides basic properties and functionality for plotting a bargraph. The latter is defined by a series of datapoints (x,y=f(x)) . Bars are then drawn fromm a baseline (often =0 ) to the value y=f(x) at each position x. Thus the class is derived from JKQTPXYBaselineGraph, which provides a baseline as well as columns for x and y values.
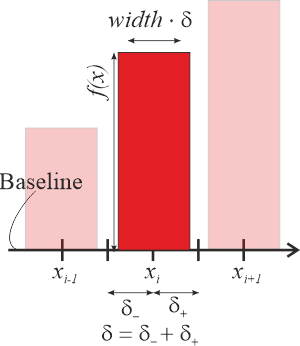
The width of each bar is determined from its distance to its direct neighbors. It occupies a fraction "width" (JKQTPBarGraphBase::setWidth(), JKQTPBarGraphBase::getWidth() ) of the available space. Typically width=0.9 so the bars occupy most space, but do not touch:
If you draw several JKQTPBarGraphBase of the same orientation (vertical or honrizontal) into the same plot, these will by default overlap, if all of the use the same x-values and have the same initial width parameter. Typically in such a case, you want to group the bars by x-values and ensure they are drawn side-by-side and do not overlap (or overlap slightly in a controlled way).
To achieve this, an addition shift parameter (JKQTPBarGraphBase::setShift(), JKQTPBarGraphBase::getShift() ) was introduced, which moves each bar inside the available space:
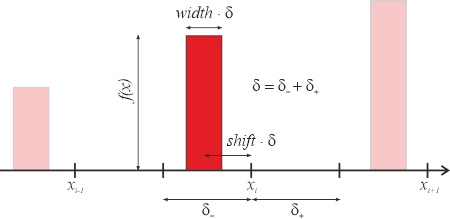
By default the shift parameter (see JKQTPBarGraphBase::setShift() ) is, so the bar is centered at the x-value (i.e. shift=0 ).
You can now use shift to separate three JKQTPBarGraphBase in a graph, by setting e.g.:
*        width=0.3
*        shift=-0.3 / 0 / +0.3
*
For convenience, two functions are provided (JKQTPBarGraphBase::autoscaleBarWidthAndShift(), JKQTPBarGraphBase::autoscaleBarWidthAndShiftSeparatedGroups() ) that can be applied to any JKQTPBarGraphBase in the plot and will calculate all bargraphs' shift and width parameter in such a way that the graphs appear tidied up into groups as above. With these functions you don't have to calculate the shift and width values by hand! A call always only affects the JKQTPBarGraphBase in the plot with the same orientation (vertical or horizontal).
This results in a bargraph, as shown here:

There are several options that allow to style the barchraph. The most direct way is to use the setters from
that are available in the class and that allow directly chaning the appearance. It is also possibly to draw the baseline itself (JKQTPBarGraphBase::setDrawBaseline(true) ). Its style is defined in JKQTPBarGraphBase::baselineStyle() .
Several convenience functions allow to set these properties in a simplified way:
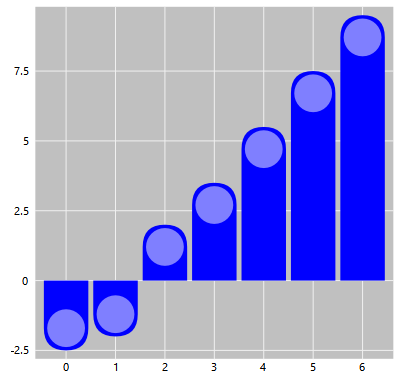
By default this class will draw boxes for each bar. They can be rounded at the corners by setting:
You can also use JKQTPBarGraphBase::setFillMode(JKQTPBarGraphBase::FillMode::TwoColorFilling), which uses different fill styles for bars above and below the baseline of the graph:
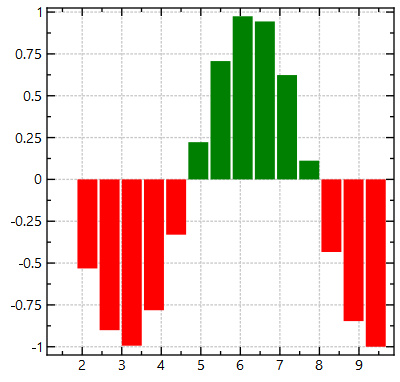
The styles for above the baseline is set by the inherited JKQTPGraphLineStyleMixin and JKQTPGraphFillStyleMixin. The alternate "below" style, can be modified using
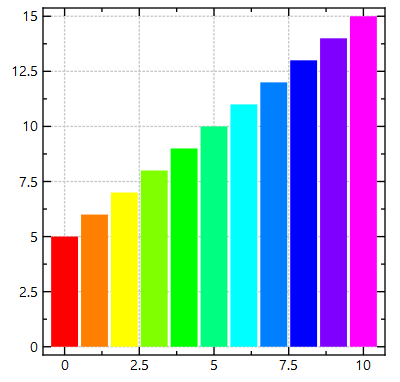
If you use JKQTPBarGraphBase::setFillMode(JKQTPBarGraphBase::FillMode::FunctorFilling) you can specify the fill style (in the form of a QBruch) for each bar by a custom functor, e.g.
The result may look like this:
You can also completely customize the drawing by defining a custom draw functor. This allows to draw other shapes than the typical bars:
See Example (JKQTPlotter): Barchart With Custom Draw Functor for a detailed example.
The result may look like this:
| typedef std::function<void(JKQTPEnhancedPainter& painter, const QRectF& bar_px, const QPointF& datapoint, Qt::Orientation orientation, JKQTPBarGraphBase* graph)> JKQTPBarGraphBase::CustomDrawingFunctor |
functor for custom drawing of bars
| typedef std::function<QBrush(double key, double value,JKQTPEnhancedPainter &painter, JKQTPBarGraphBase* graph)> JKQTPBarGraphBase::FillBrushFunctor |
a type of functor for FillMode::FunctorFilling
| typedef std::function<QBrush(double key, double value)> JKQTPBarGraphBase::SimpleFillBrushFunctor |
a simplified type of functor for FillMode::FunctorFilling
specifies how the area below the graph is filled
| Enumerator | |
|---|---|
| SingleFilling | the whole area is filled with the same color/pattern
|
| TwoColorFilling | the area above and below baseline with the two different colors/pattern
|
| FunctorFilling | a functor (use setFillBrushFunctor() to define one) is used to determine the fill color
|
| JKQTPBarGraphBase::JKQTPBarGraphBase | ( | JKQTBasePlotter * | parent = nullptr | ) |
class constructor
| JKQTPBarGraphBase::JKQTPBarGraphBase | ( | JKQTPlotter * | parent | ) |
class constructor
|
virtualslot |
finds all bar charts of the same orientation and determines width and shift, so they stand side by side
| maxWidth | the maximum (relative) width, that all bars will span of the (doubled) inter-bar distance |
| shrinkFactor | factor, by which the bar are shrinked compared to the available space |
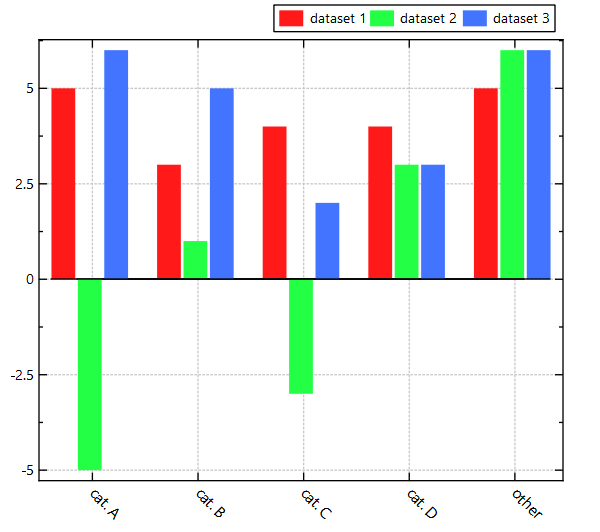
Using autoscaleBarWidthAndSHift(0.75,1.0) You can separate the different groups by soe distance, but the bars touch each other:
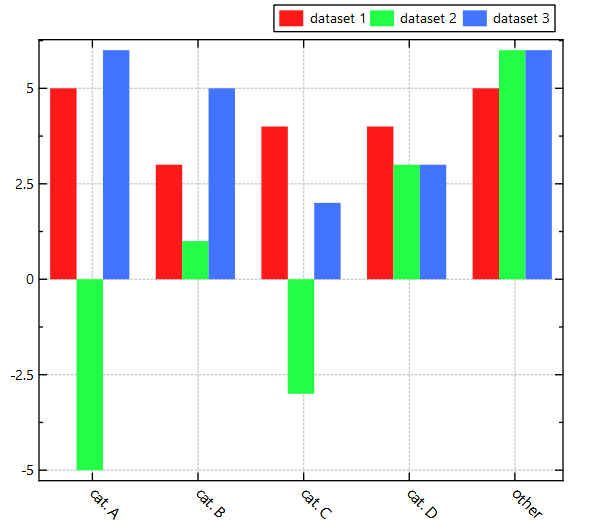
On the other hand, using the other extreme autoscaleBarWidthAndSHift(1.0,0.9) there is no grouping of the bars, but they have a slight distance between each other.
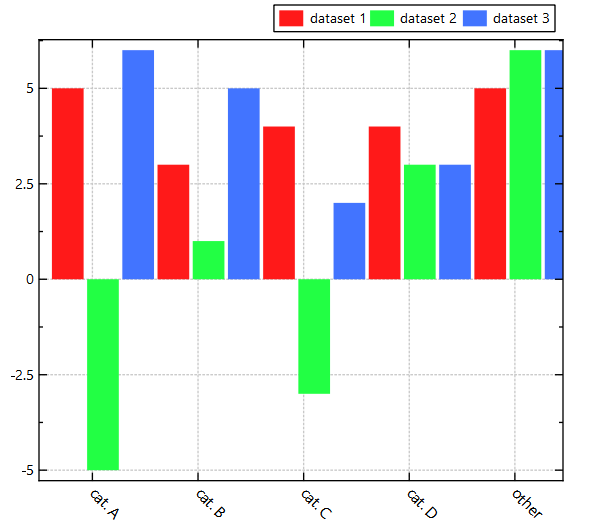
Finally the default parameters autoscaleBarWidthAndSHift(0.75,0.9) will lead to a separation of the bars AND a grouping:
|
slot |
equivalent to autoscaleBarWidthAndShift(groupWidth,0.9);
The default parameters autoscaleBarWidthAndShiftSeparatedGroups(0.75) will lead to a separation of the bars AND a grouping:
On the other hand, using autoscaleBarWidthAndShiftSeparatedGroups(1.0) there is no grouping of the bars, but they have a slight distance between each other.
| JKQTPGraphLineStyleMixin & JKQTPBarGraphBase::baselineStyle | ( | ) |
if m_drawBaseline ==true then this style is used to draw the baseline
| const JKQTPGraphLineStyleMixin & JKQTPBarGraphBase::baselineStyle | ( | ) | const |
if m_drawBaseline ==true then this style is used to draw the baseline
|
protectedpure virtual |
this function is used by autoscaleBarWidthAndShift() to determine whether a given graph shall be taken into account when autoscaling. Typically this returns true for all JKQTPBarGraphBase-derived objects with the same orientation (horizontal or vertical). For stacked graphs it excludes everything except the bottom of the stack
Implemented in JKQTPBarHorizontalGraph, and JKQTPBarVerticalGraph.
|
protectedvirtual |
returns a FillBrushFunctor that is appropriate for the currently selected m_fillMode
|
overridevirtual |
plots a key marker inside the specified rectangle rect
Implements JKQTPPlotElement.
| JKQTPGraphFillStyleMixin & JKQTPBarGraphBase::fillStyleBelow | ( | ) |
if m_fillMode ==FillAboveAndBelowDifferently then this fill style is used below the baseline and the default fill style is used above
| const JKQTPGraphFillStyleMixin & JKQTPBarGraphBase::fillStyleBelow | ( | ) | const |
if m_fillMode ==FillAboveAndBelowDifferently then this fill style is used below the baseline and the default fill style is used above
| int JKQTPBarGraphBase::getBarHeightColumn | ( | ) | const |
returns xColumn or yColumn, whichever is used for the height of the bars (depending on whether the barchart is vertical or horizontal
| int JKQTPBarGraphBase::getBarPositionColumn | ( | ) | const |
returns xColumn or yColumn, whichever is used for the position of the bars (depending on whether the barchart is vertical or horizontal
| bool JKQTPBarGraphBase::getDrawBaseline | ( | ) | const |
indicates whether to draw a line with style m_baselineStyle at the baseline-value

| FillBrushFunctor & JKQTPBarGraphBase::getFillBrushFunctor | ( | ) |
functor, used to determine the color in m_fillMode==FunctorFilling
If you use FillMode::FunctorFilling you can specify the fill style by a functor, e.g.
The result may look like this:
| const FillBrushFunctor & JKQTPBarGraphBase::getFillBrushFunctor | ( | ) | const |
functor, used to determine the color in m_fillMode==FunctorFilling
If you use FillMode::FunctorFilling you can specify the fill style by a functor, e.g.
The result may look like this:
| FillMode JKQTPBarGraphBase::getFillMode | ( | ) | const |
specifies how the area of the graph is filles
|
overridevirtual |
returns the color to be used for the key label
Implements JKQTPPlotElement.
| JKQTPColorDerivationMode JKQTPBarGraphBase::getLineColorDerivationModeForSpecialFill | ( | ) | const |
defines how to derive the line color in m_fillMode!=SingleFilling
|
protectedvirtual |
used to generate stacked plots: returns the upper boundary of the parent plot in a stack, for the index-th datapoint
Reimplemented in JKQTPBarHorizontalStackableGraph, and JKQTPBarVerticalStackableGraph.
|
protected |
get the maximum and minimum value of the box positions of the graph
The result is given in the two parameters which are call-by-reference parameters!
| double JKQTPBarGraphBase::getRectRadiusAtBaseline | ( | ) | const |
corner radius (in pt) for bars at the "baseline" end
| double JKQTPBarGraphBase::getRectRadiusAtValue | ( | ) | const |
corner radius (in pt) for bars at the "value" end
| double JKQTPBarGraphBase::getShift | ( | ) | const |
the shift of the bargraphs, relative to the distance between the current and the next x-value
See the following graphic to understand this concept:
| double JKQTPBarGraphBase::getStackSeparation | ( | ) | const |
separation (in pt) between two bars in a stack of bars
|
protected |
get the maximum and minimum value in the box-elongation (i.e. value) direction of the graph
The result is given in the two parameters which are call-by-reference parameters!
| double JKQTPBarGraphBase::getWidth | ( | ) | const |
the width of the bargraphs, relative to the distance between the current and the next x-value
See the following graphic to understand this concept:
|
protectedvirtual |
returns true, if a stack parent is set (if available)
Reimplemented in JKQTPBarHorizontalStackableGraph, and JKQTPBarVerticalStackableGraph.
|
slot |
returns xColumn or yColumn, whichever is used for the height of the bars (depending on whether the barchart is vertical or horizontal
|
slot |
returns xColumn or yColumn, whichever is used for the height of the bars (depending on whether the barchart is vertical or horizontal
|
slot |
returns xColumn or yColumn, whichever is used for the position of the bars (depending on whether the barchart is vertical or horizontal
|
slot |
returns xColumn or yColumn, whichever is used for the position of the bars (depending on whether the barchart is vertical or horizontal
|
virtualslot |
set outline and fill color at the same time
|
slot |
this allows to provide custom drawing code for the bars. It is called for every visible bar if activated by setUseCustomDrawFunctor(true) .
Here is an example for a custom draw functor:
The result may look like this:
|
slot |
this allows to provide custom drawing code for the bars. It is called for every visible bar if activated by setUseCustomDrawFunctor(true) .
Here is an example for a custom draw functor:
The result may look like this:
|
slot |
indicates whether to draw a line with style m_baselineStyle at the baseline-value
|
slot |
functor, used to determine the color in m_fillMode==FunctorFilling
If you use FillMode::FunctorFilling you can specify the fill style by a functor, e.g.
The result may look like this:
|
slot |
functor, used to determine the color in m_fillMode==FunctorFilling
If you use FillMode::FunctorFilling you can specify the fill style by a functor, e.g.
The result may look like this:
|
slot |
functor, used to determine the color in m_fillMode==FunctorFilling
If you use FillMode::FunctorFilling you can specify the fill style by a functor, e.g.
The result may look like this:
|
slot |
functor, used to determine the color in m_fillMode==FunctorFilling
If you use FillMode::FunctorFilling you can specify the fill style by a functor, e.g.
The result may look like this:
| void JKQTPBarGraphBase::setFillColor_and_darkenedColor | ( | QColor | fill, |
| int | colorDarker = 200 ) |
sets the fill color and the color together, where fillColor is set to fill and the line-color is set to fill.darker(colorDarker)
|
slot |
specifies how the area of the graph is filles
|
slot |
defines how to derive the line color in m_fillMode!=SingleFilling
|
slot |
sets the corner radius of the bars for both ends
|
slot |
sets the corner radius of the bars for both ends
|
slot |
corner radius (in pt) for bars at the "baseline" end
|
slot |
corner radius (in pt) for bars at the "value" end
|
slot |
the shift of the bargraphs, relative to the distance between the current and the next x-value
See the following graphic to understand this concept:
|
slot |
separation (in pt) between two bars in a stack of bars
|
slot |
enabled custom drawing by m_customDrawFunctor
|
slot |
the width of the bargraphs, relative to the distance between the current and the next x-value
See the following graphic to understand this concept:
| bool JKQTPBarGraphBase::usesCustomDrawFunctor | ( | ) | const |
enabled custom drawing by m_customDrawFunctor
|
protected |
if m_drawBaseline ==true then this style is used to draw the baseline
|
protected |
this allows to provide custom drawing code for the bars. It is called for every visible bar if activated by setUseCustomDrawFunctor(true) .
Here is an example for a custom draw functor:
The result may look like this:
|
protected |
indicates whether to draw a line with style m_baselineStyle at the baseline-value
|
protected |
functor, used to determine the color in m_fillMode==FunctorFilling
If you use FillMode::FunctorFilling you can specify the fill style by a functor, e.g.
The result may look like this:
|
protected |
specifies how the area of the graph is filles
|
protected |
if m_fillMode ==FillAboveAndBelowDifferently then this fill style is used below the baseline and the default fill style is used above
|
protected |
defines how to derive the line color in m_fillMode!=SingleFilling
|
protected |
separation (in pt) between two bars in a stack of bars
|
protected |
enabled custom drawing by m_customDrawFunctor
|
protected |
corner radius (in pt) for bars at the "baseline" end
|
protected |
corner radius (in pt) for bars at the "value" end
|
protected |
the shift of the bargraphs, relative to the distance between the current and the next x-value
See the following graphic to understand this concept:
|
protected |
the width of the bargraphs, relative to the distance between the current and the next x-value
See the following graphic to understand this concept: