JKQTPlotter trunk/v5.0.0
an extensive Qt5+Qt6 Plotter framework (including a feature-richt plotter widget, a speed-optimized, but limited variant and a LaTeX equation renderer!), written fully in C/C++ and without external dependencies
Loading...
Searching...
No Matches
Example (JKQTPlotter): Line Graph with Different Symbols and Line Styles

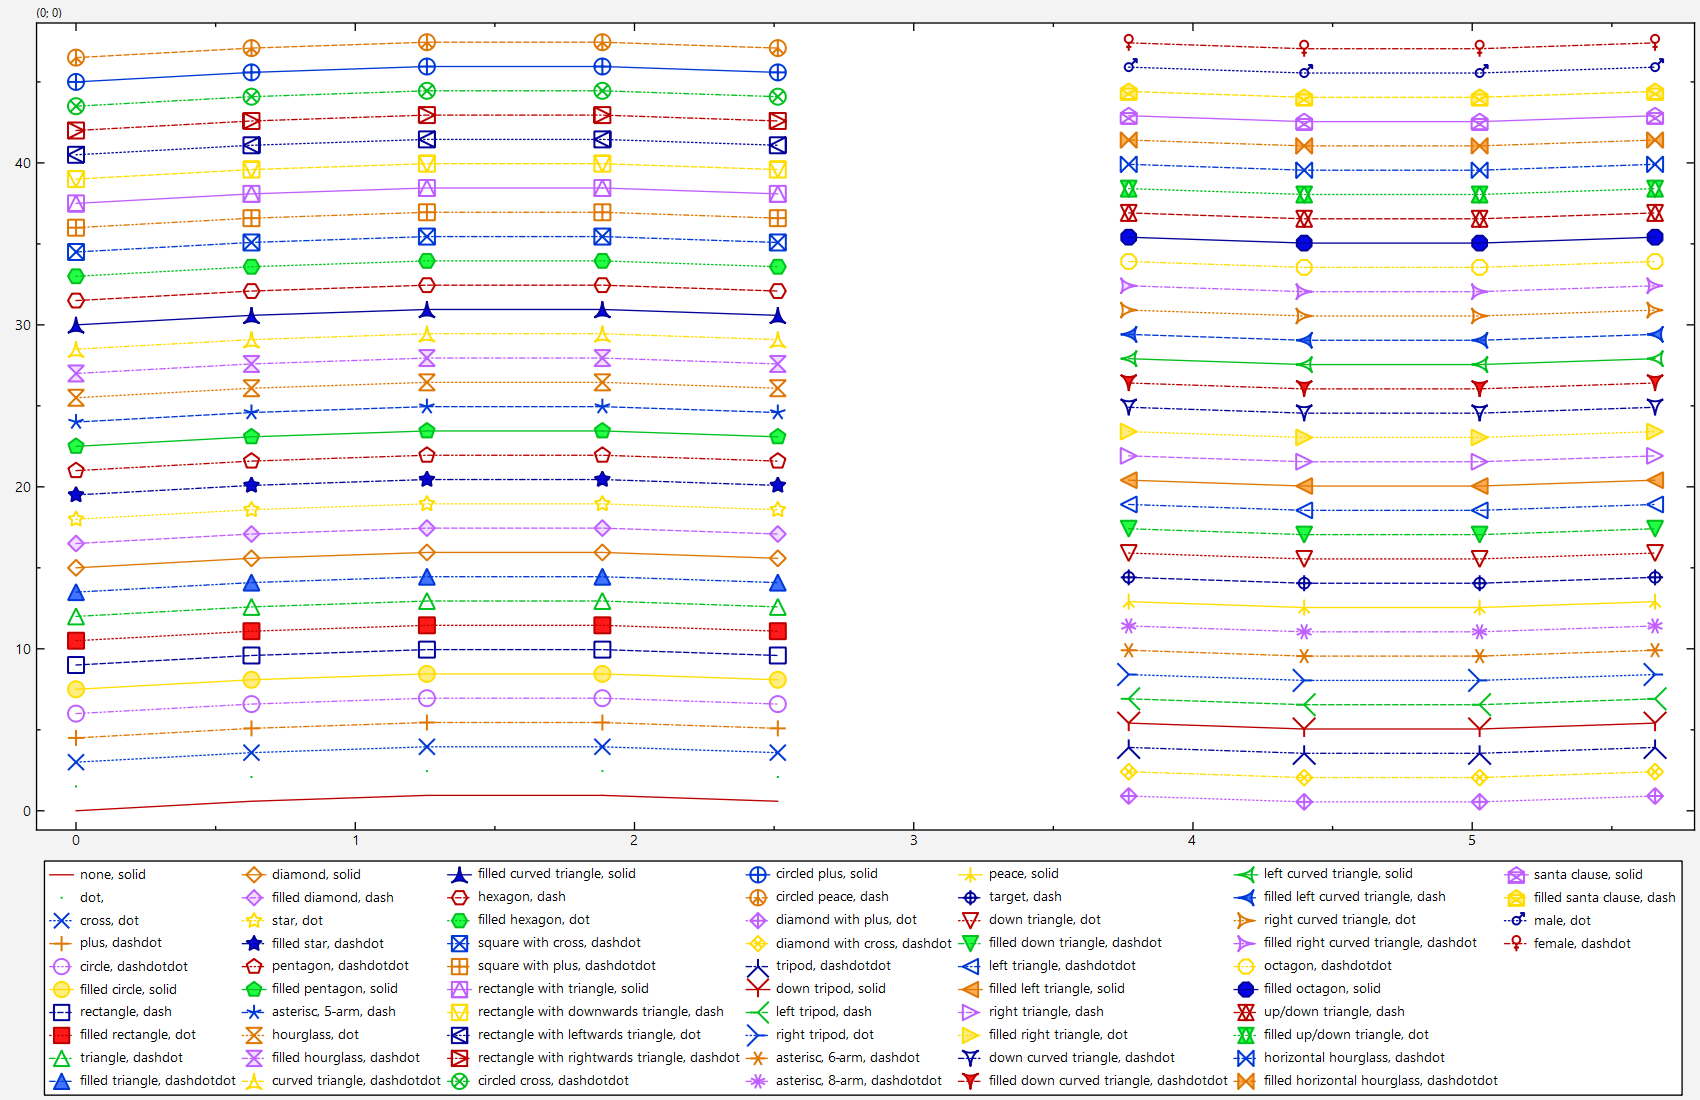
This project (see ./examples/symbols_and_styles/) simply creates a JKQTPlotter widget (as a new window) and adds a single line-graph (a sine-wave). Data is initialized from two QVector<double> objects.

The source code of the main application can be found in symbols_and_styles.cpp. Mainly several graphs are generated in a loop and then different symbol and line styles are applied to the graph (set by graph->setSymbolType() for the symbol and graph->setLineStyle() for the line style). The colors are set automtically from an internal default palette. The main loop looks like this:

QVector<Qt::PenStyle> pens {Qt::NoPen, Qt::SolidLine, Qt::DashLine, Qt::DotLine, Qt::DashDotLine, Qt::DashDotDotLine };
int ipen=0;
for (int symbolID=0; symbolID<=JKQTPMaxSymbolID; symbolID++) {
// generate some plot data
QVector<double> Y;
for (auto& xx: X) {
Y<<sin(xx)+static_cast<double>(symbolID)*1.5;
}
// copy data into datastore and immediately set the yColumn
graph->setXColumn(columnX);
graph->setYColumn(ds->addCopiedColumn(Y, "y"+QString::number(symbolID)));
// set symbol + pen style and color
graph->setSymbolType(static_cast<JKQTPGraphSymbols>(symbolID));
graph->setLineStyle(pens[ipen]);
// set symbol size
graph->setSymbolSize(14);
// set width of symbol lines
graph->setSymbolLineWidth(1.5);
// set width of graph line
graph->setLineWidth(1);
// graph title is made from symbol+penstyle
// add the graph to the plot, so it is actually displayed
plot.addGraph(graph);
ipen++;
if (ipen>=pens.size()) ipen=0;
}
void setLineWidth(double __value)
set the line width of the graph line (in pt)
Qt::PenStyle getLineStyle() const
get the style of the graph line
void setLineStyle(Qt::PenStyle __value)
set the style of the graph line
void setSymbolLineWidth(double __value)
set the line width of the graph symbol outline (in pt)
JKQTPGraphSymbols getSymbolType() const
get the type of the graph symbol
void setSymbolSize(double __value)
set the size (=diameter in pt) of the graph symbol (in pt)
void setSymbolType(JKQTPGraphSymbols __value)
set the type of the graph symbol
virtual void setTitle(const QString &__value)
sets the title of the plot (for display in key!).
void setYColumn(int __value)
the column that contains the y-component of the datapoints
void setXColumn(int __value)
the column that contains the x-component of the datapoints
This implements xy line plots. This also alows to draw symbols at the data points.
Definition jkqtplines.h:61
JKQTCOMMON_LIB_EXPORT QString JKQTPGraphSymbols2NameString(JKQTPGraphSymbols pos)
converts a JKQTPGraphSymbols variable into a human-readable string
JKQTPGraphSymbols
symbols that can be used to plot a datapoint for a graph
Definition jkqtpdrawingtools.h:143
@ JKQTPMaxSymbolID
points to the last available symbol, can be used to iterate over all symbols: for (int i=0; i<=static...
Definition jkqtpdrawingtools.h:217
JKQTCOMMON_LIB_EXPORT QString jkqtp_QPenStyle2String(Qt::PenStyle style)
converts a QT::PenStyle into a string

In addition to the symbol type and line style, you can also alter the size of the symbols (graph->setSymbolSize(14)), the line-width used to draw them (graph->setSymbolLineWidth(1.5)) and the line width of the graph line (graph->setLineWidth(1)). If you want to switch off the line altogether, use graph->setDrawLine(false).

Note: There are additional, more advanced options for styling the graphs. See the example Advanced Line and Fill Styling for details.

The result looks like this:

symbols_and_styles