This project (see ./examples/advplotstyling/) demonstrates how to use advanced line styling and filling options (e.g. custom dash-styles, gradient, image fills, transparencies, ...) with JKQtPlotter.
The source code of the main application can be found in advplotstyling.cpp.
Initially several data columns are generated and added to the internal datastore. Then several line graphs are added that all use different custom dashes. In addition the third line does not use a single color, but a gradient for coloring:
QVector<qreal> dashes1;
dashes1 << 2 << 2 << 2 << 2 << 4 << 4 << 4 << 4 << 8 << 8 << 8 << 8 ;
QVector<qreal> dashes2;
dashes2 << 1 << 2 << 2 << 2 << 3 << 2 << 4 << 2 << 5 << 2 << 6 << 2 ;
QVector<qreal> dashes3;
dashes3 << 4 << 4 << 4 << 4 << 12 << 4 ;
QLinearGradient lineGrad(QPointF(0, 0), QPointF(1, 0));
lineGrad.setColorAt(0, Qt::red);
lineGrad.setColorAt(1, Qt::green);
lineGrad.setCoordinateMode(QGradient::ObjectBoundingMode);
This JKQTPGeometricPlotElement is used to draw a line, optionally line-end decorations (aka arrows) a...
Definition jkqtpgeolines.h:62
void setLineWidth(double __value)
set the line width of the graph line (in pt)
void setLineBrush(const QBrush &style)
sets the brush used to fill the line area
void setLineDashPattern(const QVector< qreal > &pattern)
sets the dash pattern for a custom dash style
In addition, a JKQTPSpecialLineHorizontalGraph is filled using an image example.bmp as a texture:
void setFillTransform(const QTransform &b)
sets a fill transformation
void setFillTexture(const QPixmap &__value)
set the color of the graph filling and sets fill style to Qt::TexturePattern
void setDrawLine(bool __value)
indicates whether to draw a line on the circumference of the described area (i.e. along the data poin...
void setFillCurve(bool __value)
indicates whether to fill the space between the curve and the x-axis
void setSpecialLineType(const JKQTPSpecialLineType &__value)
type of connecting (step)lines
This implements a step plot with values .
Definition jkqtpspecialline.h:97
@ JKQTPDirectLine
no step, but connects the two datapoints with a straight line
Definition jkqtptools.h:757
This texture-filled graph is overlayn by a graph filled with a color gradient that is semi-transparent in some colors:
QLinearGradient linearGrad(QPointF(0, 0), QPointF(1, 1));
QColor c1(Qt::yellow);
c1.setAlphaF(0.5);
QColor c2(Qt::red);
QColor c3(Qt::blue);
QColor c4(Qt::green);
c4.setAlphaF(0.5);
linearGrad.setColorAt(0, c1);
linearGrad.setColorAt(0.3, c2);
linearGrad.setColorAt(0.7, c3);
linearGrad.setColorAt(1, c4);
linearGrad.setCoordinateMode(QGradient::ObjectBoundingMode);
void setFillGradient(const QGradient &__value)
set the filling of the graph to a gradient and sets fill style to a gradient setting
@ JKQTPStepCenter
datapoint is centered on the hor. step line
Definition jkqtptools.h:754
Finally two vertical barcharts with different filling options are added:
QColor c0=QColor("darkgreen").darker();
c0.setAlphaF(.75);
QLinearGradient linearG(QPointF(0, 0), QPointF(0, 1));
QColor cl11(QColor("darkgreen"));
QColor cl12(Qt::green);
cl12.setAlphaF(0.5);
linearG.setColorAt(0, cl11);
linearG.setColorAt(1, cl12);
linearG.setCoordinateMode(QGradient::ObjectBoundingMode);
This implements a vertical bar graph with bars between and .
Definition jkqtpbarchart.h:51
void setFillColor(const QColor &__value)
set the color of the graph filling
void setLineColor(const QColor &__value)
set the color of the graph line
In addition to the graph background properties, also the plot/widget/key backgrounds can be defined using a QBrush:
QLinearGradient backGrad(QPointF(0, 0), QPointF(1, 1));
backGrad.setColorAt(0, QColor("salmon"));
backGrad.setColorAt(1, QColor("white"));
backGrad.setCoordinateMode(QGradient::ObjectBoundingMode);
plot.getPlotter()->setPlotBackgroundGradient(backGrad);
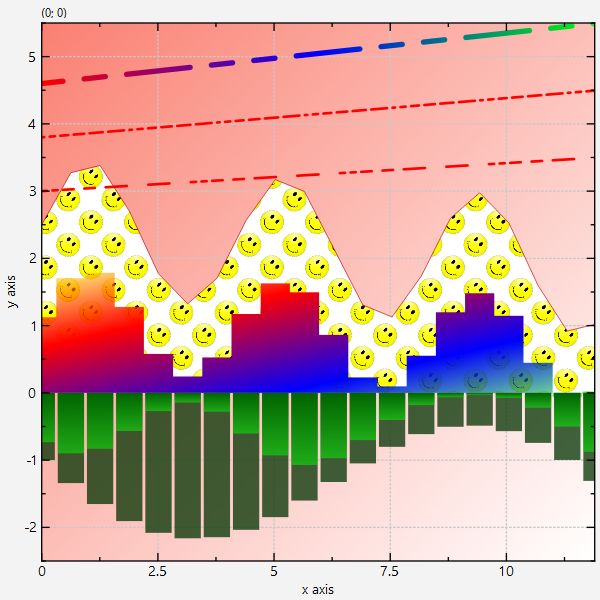
The result looks like this: