JKQTPlotter trunk/v5.0.0
an extensive Qt5+Qt6 Plotter framework (including a feature-richt plotter widget, a speed-optimized, but limited variant and a LaTeX equation renderer!), written fully in C/C++ and without external dependencies
Loading...
Searching...
No Matches
Collaboration diagram for Usage of JKQTPlotter Widget:

JKQTPlotter is a plotter widget which wraps around a JKQTBasePlotter instanced that does the actual drawing. A basic usage of JKQTPlotter looks like this:

// create a new JKQTPlotter instance
JKQTPlotter* plot = new JKQTPlotter(parentWidget);
// fill two vectors with dtaa for a graph:
QVector<double> X, Y;
fillDataVectors(X, Y);
// make data available to the internal datastore of the plotter:
size_t columnX=plot->getDatastore()->addCopiedColumn(X, "x");
size_t columnY=plot->getDatastore()->addCopiedColumn(Y, "y");
// create a graph/curve, which displays the data
graph1->setXColumn(columnX);
graph1->setYColumn(columnY);
graph1->setTitle(QObject::tr("graph title"));
plot->addGraph(graph1);
// autoscale the plot
plot->zoomToFit();
// alternatively set the axis dimension by hand:
plot->setXY(-10,10,-10,10);
size_t addCopiedColumn(TIterator first, TIterator last, const QString &name=QString(""))
add one column to the datastore. It will be filled with the values from first ... last
Definition jkqtpdatastorage.h:871
virtual void setTitle(const QString &__value)
sets the title of the plot (for display in key!).
void setYColumn(int __value)
the column that contains the y-component of the datapoints
void setXColumn(int __value)
the column that contains the x-component of the datapoints
This implements xy line plots. This also alows to draw symbols at the data points.
Definition jkqtplines.h:61
plotter widget for scientific plots (uses JKQTBasePlotter to do the actual drawing)
Definition jkqtplotter.h:364
void zoomToFit(bool zoomX=true, bool zoomY=true, bool includeX0=false, bool includeY0=false, double scaleX=1.05, double scaleY=1.05)
this method zooms the graph so that all plotted datapoints are visible.
Definition jkqtplotter.h:1039
void setXY(double xminn, double xmaxx, double yminn, double ymaxx, bool affectsSecondaryAxes=false)
sets the x- and y-range of the plot (minimum and maximum values on the x-/y-axis)
Definition jkqtplotter.h:1167
void addGraph(JKQTPPlotElement *gr)
Definition jkqtplotter.h:784
JKQTPDatastore * getDatastore()
returns a pointer to the datastore used by this object
Definition jkqtplotter.h:611

The result should look something like this:

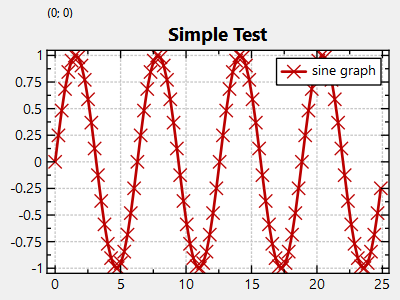
Starting from this basic example, you can observe several important principles:

  1. Data is stored in an (internal) instance of JKQTPDatastore, which is accessible through JKQTPlotter::getDatastore(). This datastore can either own its data (which is done here, as we copy the data into the store by calling JKQTPDatastore::addCopiedColumn(), or it can merely reference to the data (then data needs to be available as array of double values).
  2. Naming conventions (excerpt from Conventions: Naming and Plot Construction ):
    • plot is the complete drawn image, including the axes, the graphs, the key and all other visual elements
    • plot element any sub element of the plot, e.g. a single coordinate axis, the key, but also any graph/curve
    • graph is a single curve/image/geometric element in the plot
    • geometric element is a special graph that does not represent a curve based on data from the JKQTPDatastore, but a single graphic element, like a rectangle/circle/line/..., some text, a single symbol
    • key is the legend of the plot
    • coordinate axis is each of the x- or y-axis (there might be addition axes, e.g. when showing a color-scale)
  3. Each graph is represented by a class derived from JKQTPPlotElement (in the example we instanciated a JKQTPXYLineGraph, which shows data as a scatter of symbols that may (or may not) be connected by a line). Creating the graph class does not yet add it to the plotter. To add it, call JKQTPlotter::addGraph(). Only after this sep, the graph is displayed. You can modify the apperance of the graph (e.g. colors, name in the key ...) by setting properties in the graph class instance.
  4. You can auto-zoom the axis ranges of the plot by calling JKQTPlotter::zoomToFit(), or set them exlicitly by calling JKQTPlotter::setXY(). The user can later zoom in/out by the mouse (and other means). You can limit this zoom range by setting an absolute axis range, calling e.g. JKQTPlotter::setAbsoluteXY(). The the user cannot zoom farther out than the given range(s).
  5. If you want to style the plot itself, you need to set properties of the underlying JKQTBasePloter instance, which is accessible through JKQTPlotter::getPlotter(). If you want to style the coordinate axes, you can acces their representing objects by caling JKQTPlotter::getXAxis() or JKQTPlotter::getYAxis().
See also
Example (JKQTPlotter): Very simple line-graph and
JKQTPlotterQtCreator