JKQTPlotter trunk/v5.0.0
an extensive Qt5+Qt6 Plotter framework (including a feature-richt plotter widget, a speed-optimized, but limited variant and a LaTeX equation renderer!), written fully in C/C++ and without external dependencies
Loading...
Searching...
No Matches
Example (JKQTPlotter): Very simple line-graph

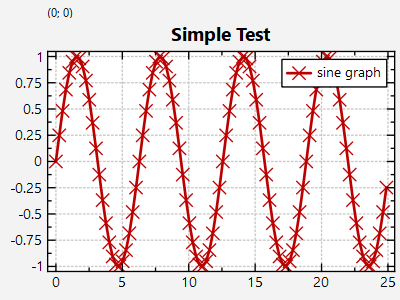
This project (see ./examples/simpletest/) simply creates a JKQTPlotter widget (as a new window) and adds a single line-graph (a sine-wave). Data is initialized from two QVector<double> objects.

The source code of the main application is (see jkqtplotter_simpletest.cpp:

#include <QApplication>
#include "jkqtplotter/jkqtplotter.h"
int main(int argc, char* argv[])
{
QApplication app(argc, argv);
// 1. create a plotter window and get a pointer to the internal datastore
// (for convenience)
// 2. now we create data for a simple plot (a sine curve)
QVector<double> X, Y;
const int Ndata=100;
for (int i=0; i<Ndata; i++) {
const double x=double(i)/double(Ndata)*8.0*M_PI;
X<<x;
Y<<sin(x);
}
// 3. make data available to JKQTPlotter by adding it to the internal
// datastore.
// Note: In this step the data is copied (of not specified otherwise), so
// you can reuse X and Y afterwards!
// The variables columnX and columnY will contain the internal column ID
// of the newlycreated columns with names "x" and "y" and the (copied)
// data from X and Y.
size_t columnX=ds->addCopiedColumn(X, "x");
size_t columnY=ds->addCopiedColumn(Y, "y");
// 4. create a graph in the plot, which plots the dataset X/Y:
JKQTPXYLineGraph* graph1=new JKQTPXYLineGraph(&plot);
graph1->setXColumn(columnX);
graph1->setYColumn(columnY);
graph1->setTitle(QObject::tr("sine graph"));
// 5. add the graph to the plot, so it is actually displayed
plot.addGraph(graph1);
// 6. autoscale the plot so the graph is contained
plot.zoomToFit();
// show plotter and make it a decent size
plot.show();
plot.resize(600,400);
return app.exec();
}
This class manages data columns (with entries of type double ), used by JKQTPlotter/JKQTBasePlotter t...
Definition jkqtpdatastorage.h:282
size_t addCopiedColumn(TIterator first, TIterator last, const QString &name=QString(""))
add one column to the datastore. It will be filled with the values from first ... last
Definition jkqtpdatastorage.h:871
virtual void setTitle(const QString &__value)
sets the title of the plot (for display in key!).
void setYColumn(int __value)
the column that contains the y-component of the datapoints
void setXColumn(int __value)
the column that contains the x-component of the datapoints
This implements xy line plots. This also alows to draw symbols at the data points.
Definition jkqtplines.h:61
plotter widget for scientific plots (uses JKQTBasePlotter to do the actual drawing)
Definition jkqtplotter.h:364
void zoomToFit(bool zoomX=true, bool zoomY=true, bool includeX0=false, bool includeY0=false, double scaleX=1.05, double scaleY=1.05)
this method zooms the graph so that all plotted datapoints are visible.
Definition jkqtplotter.h:1039
void addGraph(JKQTPPlotElement *gr)
Definition jkqtplotter.h:784
JKQTPDatastore * getDatastore()
returns a pointer to the datastore used by this object
Definition jkqtplotter.h:611

The result looks like this:

simpletest