This class draws an Open-High-Low-Close (OHLC) or candle-stick graph typically representing financial data.
More...
|
| virtual void | autoscaleBoxWidthAndShift (double maxWidth=0.8, double shrinkFactor=0.8) |
| | finds all financial charts of the same orientation and determines width and shift, so they stand side by side
|
| void | autoscaleBoxWidthAndShiftSeparatedGroups (double groupWidth=0.65) |
| | equivalent to autoscaleBoxWidthAndShift(groupWidth,0.8);
|
| void | setCandlestickOneColor (QColor cLine) |
| | sets graphType = FinancialGraphType::CandleStick and sets one color cLine for positive and negative items, where positive items are unfilled and negative items are filled
|
| void | setCandlestickTwoColor (QColor cPositive, QColor cNegative) |
| | sets graphType = FinancialGraphType::CandleStick and sets the positive and negative color (for fill and line equal!)
|
| void | setCandlestickTwoColor (QColor cPositive, QColor cNegative, QColor lineCOlor) |
| | sets graphType = FinancialGraphType::CandleStick and sets the positive and negative fill color and a single line-color
|
| void | setCloseColumn (int __value) |
| | column for the "Close" value of the financial graph
|
| void | setCloseColumn (size_t __value) |
| | column for the "Close" value of the financial graph
|
| virtual void | setColor (QColor cPositive, QColor cNegative) |
| | set outline and fill color at the same time, for both positive and negative boxes
|
| virtual void | setColor (QColor linePositive, QColor fillPositive, QColor lineNegative, QColor fillNegative) |
| | set outline and fill color at the same time, for both positive and negative boxes
|
| void | setGraphType (FinancialGraphType __value) |
| | type of the financial graph (OHLC or candle-stick)
|
| void | setHighColumn (int __value) |
| | column for the "High" value of the financial graph
|
| void | setHighColumn (size_t __value) |
| | column for the "High" value of the financial graph
|
| void | setLowColumn (int __value) |
| | column for the "Low" value of the financial graph
|
| void | setLowColumn (size_t __value) |
| | column for the "Low" value of the financial graph
|
| void | setOHLCTwoColor (QColor cPositive, QColor cNegative) |
| | sets graphType = FinancialGraphType::OHLC and sets the positive and negative color (for fill and line equal!)
|
| void | setOpenColumn (int __value) |
| | column for the "Open" value of the financial graph
|
| void | setOpenColumn (size_t __value) |
| | column for the "Open" value of the financial graph
|
| void | setShift (double __value) |
| | the shift of the boxes, relative to the distance between the current and the next x-value
|
| void | setWidth (double __value) |
| | the width of the boxes, relative to the distance between the current and the next x-value
|
| void | setDataSortOrder (DataSortOrder __value) |
| | if !=Unsorted, the data is sorted before plotting
|
| void | setDataSortOrder (int __value) |
| | if !=Unsorted, the data is sorted before plotting
|
| virtual void | setKeyColumn (int __value) |
| | sets the column used as "key" for the current graph (typically this call setXColumn(), but for horizontal graphs like filled curves or barcharts it may call setYColumn() )
|
| void | setXColumn (int __value) |
| | the column that contains the x-component of the datapoints
|
| void | setXColumn (size_t __value) |
| | the column that contains the x-component of the datapoints
|
| void | setHighlighted (bool __value) |
| | sets whether the graph is drawn in a highlighted style in the plot
|
| virtual void | setTitle (const QString &__value) |
| | sets the title of the plot (for display in key!).
|
| void | setVisible (bool __value) |
| | sets whether the graph is visible in the plot
|
|
| | JKQTPFinancialGraph (JKQTBasePlotter *parent=nullptr) |
| | class constructor
|
| | JKQTPFinancialGraph (JKQTPlotter *parent) |
| | class constructor
|
| virtual void | draw (JKQTPEnhancedPainter &painter) override |
| | plots the graph to the plotter object specified as parent
|
| virtual void | drawKeyMarker (JKQTPEnhancedPainter &painter, const QRectF &rect) override |
| | plots a key marker inside the specified rectangle rect
|
| JKQTPGraphFillStyleMixin & | fillStyleNegative () |
| | fill style for negative items (close<open)
|
| const JKQTPGraphFillStyleMixin & | fillStyleNegative () const |
| | fill style for negative items (close<open)
|
| JKQTPGraphFillStyleMixin & | fillStylePositive () |
| | fill style for positive items (close>open)
|
| const JKQTPGraphFillStyleMixin & | fillStylePositive () const |
| | fill style for positive items (close>open)
|
| int | getCloseColumn () const |
| | column for the "Close" value of the financial graph
|
| FinancialGraphType | getGraphType () const |
| | type of the financial graph (OHLC or candle-stick)
|
| int | getHighColumn () const |
| | column for the "High" value of the financial graph
|
| virtual bool | getIndexRange (int &imin, int &imax) const override |
| | determines the range of row indexes available in the data columns of this graph
|
| virtual QColor | getKeyLabelColor () const override |
| | returns the color to be used for the key label
|
| int | getLowColumn () const |
| | column for the "Low" value of the financial graph
|
| int | getOpenColumn () const |
| | column for the "Open" value of the financial graph
|
| double | getShift () const |
| | the shift of the boxes, relative to the distance between the current and the next x-value
|
| double | getWidth () const |
| | the width of the boxes, relative to the distance between the current and the next x-value
|
| virtual bool | getYMinMax (double &miny, double &maxy, double &smallestGreaterZero) override |
| | get the maximum and minimum y-value of the graph
|
| JKQTPGraphLineStyleMixin & | lineStyleNegative () |
| | fill style for negative items (close<open)
|
| const JKQTPGraphLineStyleMixin & | lineStyleNegative () const |
| | fill style for negative items (close<open)
|
| JKQTPGraphLineStyleMixin & | lineStylePositive () |
| | fill style for positive items (close>open)
|
| const JKQTPGraphLineStyleMixin & | lineStylePositive () const |
| | fill style for positive items (close>open)
|
| virtual bool | usesColumn (int column) const override |
| | returns true if the given column is used by the graph
|
| | JKQTPXGraph (JKQTBasePlotter *parent=nullptr) |
| | class constructor
|
| DataSortOrder | getDataSortOrder () const |
| | if !=Unsorted, the data is sorted before plotting
|
| virtual int | getKeyColumn () const |
| | returns the column used as "key" for the current graph (typically this call getXColumn(), but for horizontal graphs like filled curves or barcharts it may call getYColumn() )
|
| int | getXColumn () const |
| | the column that contains the x-component of the datapoints
|
| virtual bool | getXMinMax (double &minx, double &maxx, double &smallestGreaterZero) override |
| | get the maximum and minimum x-value of the graph
|
| | JKQTPGraph (JKQTBasePlotter *parent=nullptr) |
| | class constructor
|
| virtual | ~JKQTPGraph ()=default |
| | default wirtual destructor
|
| | JKQTPPlotElement (JKQTBasePlotter *parent=nullptr) |
| | class constructor
|
| virtual | ~JKQTPPlotElement ()=default |
| | default wirtual destructor
|
| QPointF | backTransform (const QPointF &x) const |
| | tool routine that back-transforms a QPointF according to the parent's transformation rules (pixels --> plot coordinate)
|
| QPointF | backTransform (double x, double y) const |
| | tool routine that back-transforms a QPointF according to the parent's transformation rules (pixels --> plot coordinate)
|
| double | backtransformX (double x) const |
| | tool routine that backtransforms an x-coordinate (pixels --> plot coordinate) for this plot element, uses the axis referenced in xAxisRef
|
| double | backtransformY (double y) const |
| | tool routine that backtransforms a y-coordinate (pixels --> plot coordinate) for this plot element, uses the axis referenced in yAxisRef
|
| virtual void | drawOutside (JKQTPEnhancedPainter &painter, QRect leftSpace, QRect rightSpace, QRect topSpace, QRect bottomSpace) |
| | plots outside the actual plot field of view (e.g. color bars, scale bars, ...)
|
| QImage | generateKeyMarker (QSize size=QSize(16, 16)) |
| | returns an image with a key marker inside
|
| virtual void | getOutsideSize (JKQTPEnhancedPainter &painter, int &leftSpace, int &rightSpace, int &topSpace, int &bottomSpace) |
| | if the graph plots outside the actual plot field of view (e.g. color bars, scale bars, ...)
|
| JKQTBasePlotter * | getParent () |
| | returns the parent painter class
|
| const JKQTBasePlotter * | getParent () const |
| | returns the parent painter class
|
| QString | getTitle () const |
| | returns the the title of the plot
|
| const JKQTPCoordinateAxis * | getXAxis () const |
| | returns the actual x-Axis-object from the parent plotter, referenced in xAxisRef
|
| JKQTPCoordinateAxisRef | getXAxisRef () const |
| | indicates which coordinate axis to use for coordinate transforms in x-direction
|
| const JKQTPCoordinateAxis * | getYAxis () const |
| | returns the actual y-Axis-object from the parent plotter, referenced in yAxisRef
|
| JKQTPCoordinateAxisRef | getYAxisRef () const |
| | indicates which coordinate axis to use for coordinate transforms in y-direction
|
| virtual double | hitTest (const QPointF &posSystem, QPointF *closestSpotSystem=nullptr, QString *label=nullptr, HitTestMode mode=HitTestXY) const |
| | returns the closest distance of the plot element to the (screen pixel) position pos, or NAN
|
| bool | isHighlighted () const |
| | returns whether the graph is shown in a highlighted style in the plot
|
| bool | isVisible () const |
| | returns whether the graph is visible in the plot
|
| void | setAxes (JKQTPCoordinateAxisRef ref) |
| | set the coordinate axes to use for this plot element
|
| virtual void | setParent (JKQTBasePlotter *parent) |
| | sets the parent painter class
|
| virtual void | setParent (JKQTPlotter *parent) |
| | sets the parent painter class
|
| void | setXAxis (JKQTPCoordinateAxisRef ref) |
| | indicates which coordinate axis to use for coordinate transforms in x-direction
|
| void | setYAxis (JKQTPCoordinateAxisRef ref) |
| | indicates which coordinate axis to use for coordinate transforms in y-direction
|
| QPointF | transform (const QPointF &x) const |
| | tool routine that transforms a QPointF according to the parent's transformation rules (plot coordinate --> pixels)
|
| QPolygonF | transform (const QPolygonF &x) const |
| | tool routine that transforms a QPolygonF according to the parent's transformation rules (plot coordinate --> pixels)
|
| QPointF | transform (double x, double y) const |
| | tool routine that transforms a QPointF according to the parent's transformation rules (plot coordinate --> pixels)
|
| QPainterPath | transformToLinePath (const QPolygonF &x) const |
| | tool routine that transforms a QPolygonF according to the parent's transformation rules and returns a (non-closed) path consisting of lines (plot coordinate --> pixels)
|
| QVector< double > | transformX (const QVector< double > &x) const |
| | transform all x-coordinates in a vector x
|
| double | transformX (double x) const |
| | tool routine that transforms an x-coordinate (plot coordinate --> pixels) for this plot element, uses the axis referenced in xAxisRef
|
| QVector< double > | transformY (const QVector< double > &x) const |
| | transform all y-coordinates in a vector x
|
| double | transformY (double y) const |
| | tool routine that transforms a y-coordinate (plot coordinate --> pixels) for this plot element, uses the axis referenced in yAxisRef
|
|
| virtual bool | considerForAutoscaling (JKQTPFinancialGraph *other) const |
| | this function is used by autoscaleBoxWidthAndShift() to determine whether a given graph shall be taken into account when autoscaling. Typically this returns true for all JKQTPFinancialGraph-derved objects with the same orientation (horizontal or vertical, i.e. currently all)
|
| int | getDataIndex (int i) const |
| | returns the index of the i-th datapoint (where i is an index into the SORTED datapoints)
|
| virtual void | intSortData () |
| | sorts data according to the specified criterion in sortData ... The result is stored as a index-map in sorted Indices
|
| virtual void | drawErrorsAfter (JKQTPEnhancedPainter &) |
| | this function is used to plot error inidcators after plotting the graphs.
|
| virtual void | drawErrorsBefore (JKQTPEnhancedPainter &) |
| | this function is used to plot error inidcators before plotting the graphs.
|
| bool | getDataMinMax (int column, double &minx, double &maxx, double &smallestGreaterZero) |
| | get the maximum and minimum value of the given column
|
| void | addHitTestData (const HitTestLocation &loc) |
| | clear the internal datastore for hitTest()
|
| void | addHitTestData (const QPointF &pos_, const QString &label_) |
| | clear the internal datastore for hitTest()
|
| void | addHitTestData (const QPointF &pos_, int index_, const QString &label_) |
| | clear the internal datastore for hitTest()
|
| void | addHitTestData (const QPointF &pos_, int index_=-1, const JKQTPDatastore *datastore=nullptr) |
| | clear the internal datastore for hitTest(), this variant uses formatHitTestDefaultLabel() to auto-generate the label
|
| void | addHitTestData (double x_, double y_, const QString &label_) |
| | add a new point on the graph to the internal datastore for hitTest()
|
| void | addHitTestData (double x_, double y_, int index_, const QString &label_) |
| | clear the internal datastore for hitTest()
|
| void | addHitTestData (double x_, double y_, int index_=-1, const JKQTPDatastore *datastore=nullptr) |
| | add a new point on the graph to the internal datastore for hitTest(), this variant uses formatHitTestDefaultLabel() to auto-generate the label
|
| void | clearHitTestData () |
| | clear the internal datastore for hitTest()
|
| virtual QString | formatHitTestDefaultLabel (double x, double y, int index=-1, const JKQTPDatastore *datastore=nullptr) const |
| | tool-function for hitTest(), which formats a default label, taking into account the x- and y-position (both provided) and optionally the errors of these positions.
|
| void | reserveHitTestData (int points) |
| | reserve list entries for up to points graph points in the internal datastore for hitTest()
|
| QString | xFloatToString (double v, int past_comma=-1) const |
| | converts a x-value v into a string, taking into account the type of x-axis
|
| QString | yFloatToString (double v, int past_comma=-1) const |
| | converts a x-value v into a string, taking into account the type of x-axis
|
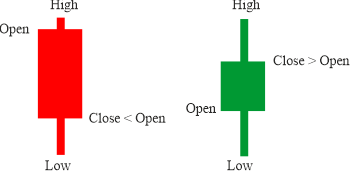
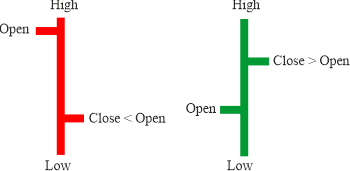
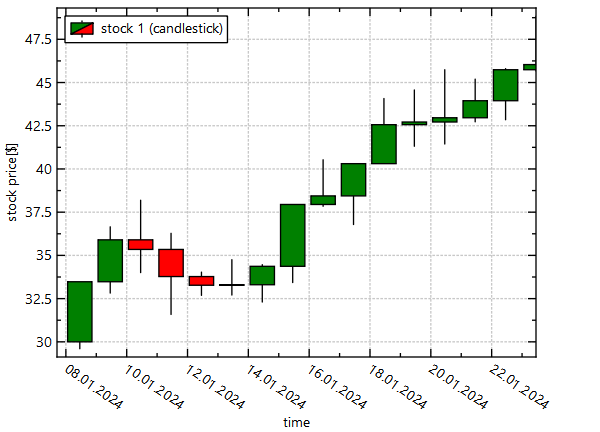
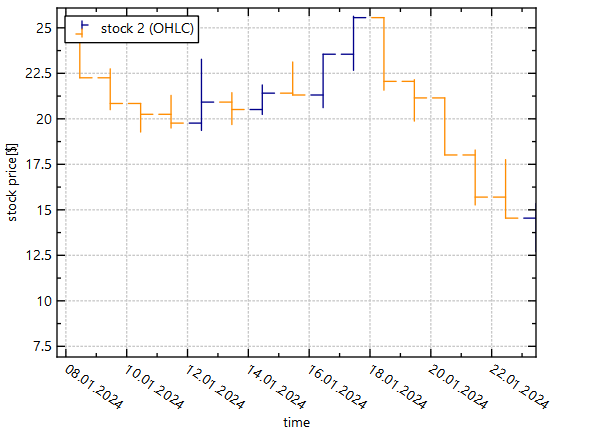
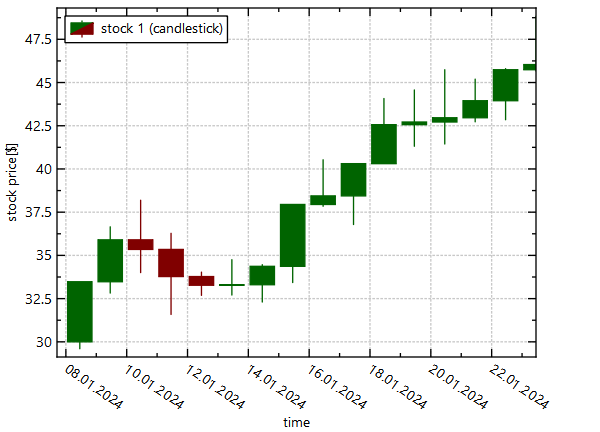
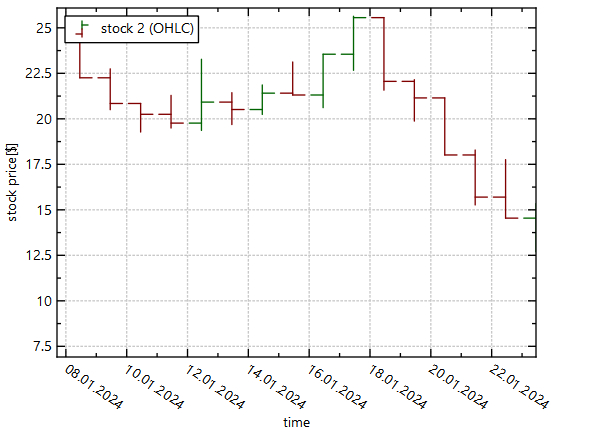
This class draws an Open-High-Low-Close (OHLC) or candle-stick graph typically representing financial data.
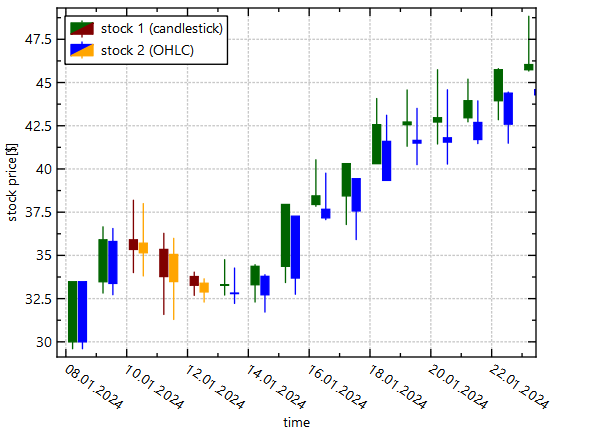
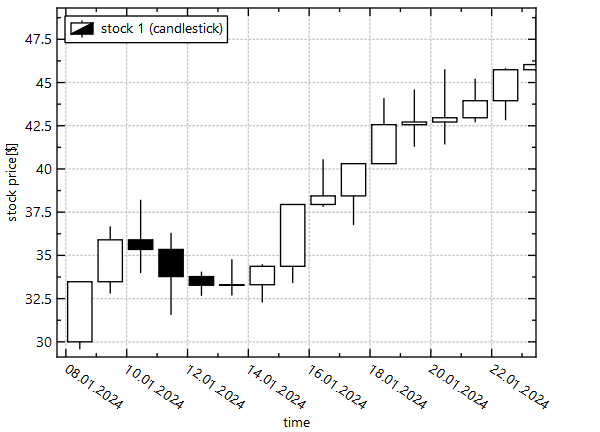
This graph draws either candlstick charts:
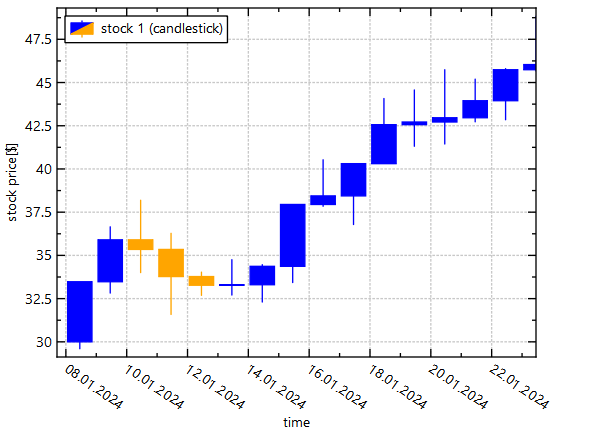
or Open-High-Low-Close (OHLC) charts (depending on what you set in setGraphType() ).
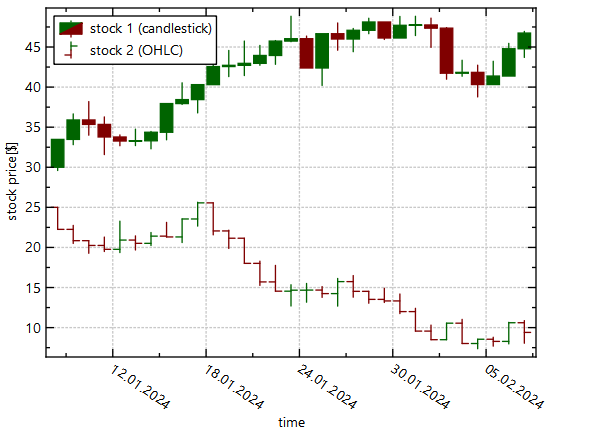
Here is an example graph showcasing both variants:
- See also
- For details on the graph types see https://en.wikipedia.org/wiki/Candlestick_chart and https://en.wikipedia.org/wiki/Open-high-low-close_chart
-
JKQTPXGraph
Styling the Financial Graphs
You can control the type of graph and it's appearance with these functions (example images are in the documentation of the functions):
For fine-tuning, you can access the line- and fill-styles for positiove (close>open) and negative (close<open) items separately via:
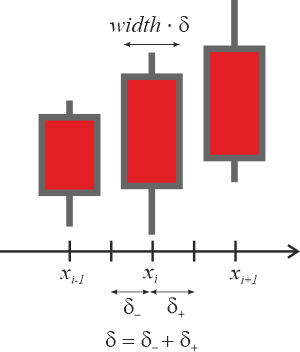
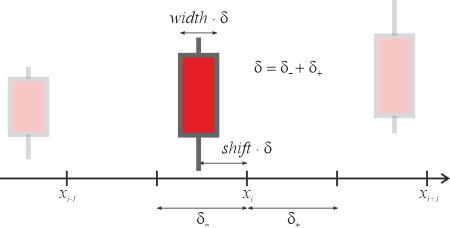
Note that the width of the single elements for each x-value is automatically from the distance to the next neighbours. Here set parameter width (setWidth(), getWidth() ) is employed. It sets the relative amount of space that an element occupies in its part of the graph. Typically the default width is 0.8 (or 80%).
Several Financial Graphs side-by-side
In case you want to display several of these graphs in the same plot, you can make them appear side-by-side, even if they all cover the same x-values and would thus be draw atop each other. We apply the same principles that were used for barcharts in JKQTPBarGraphBase and add a shift-parameter (setShift() ) that shifts each element in the available space:
For example for two financial graph elements per x-value one would set:
*        width=0.4
*        shift=-0.5 / +0.5
*
Two functions are provided (JKQTPFinancialGraph::autoscaleBoxWidthAndShift(), JKQTPFinancialGraph::autoscaleBoxWidthAndShiftSeparatedGroups() ) that can be applied to any JKQTPFinancialGraph in the plot and will calculate all JKQTPFinancialGraphs' shift and width parameter in such a way that the graphs appear tidied up into groups by x-value. With these functions you don't have to calculate the shift and width values by hand! A call always only affects the JKQTPFinancialGraph in the plot with the same orientation (vertical or horizontal).