This project (see ./examples/scatter_customsymbol/) demonstrates using JKQTPlotter to draw a scatter graph (JKQTPXYScatterGraph) with custom symbols.
The source code of the example can be found in jkqtplotter_scatter.cpp.
First we create a plotter window and get a pointer to the internal datastore (for convenience):
This class manages data columns (with entries of type double ), used by JKQTPlotter/JKQTBasePlotter t...
Definition jkqtpdatastorage.h:223
plotter widget for scientific plots (uses JKQTBasePlotter to do the actual drawing)
Definition jkqtplotter.h:374
JKQTPDatastore * getDatastore()
returns a pointer to the datastore used by this object
Definition jkqtplotter.h:621
Now we add several columns to the JKQTPDatastore and obtain back-inserter iterators for these:
JKQTPColumnBackInserter backInserter(int i)
returns a back-inserter iterator (JKQTPColumnBackInserter) to the i -th column in the JKQTPDatastore
size_t addColumn(JKQTPColumn &&col)
add a new column to the datastore and return its ID
... and fill the columns with data
const int Ndata=5;
for (int i=0; i<Ndata; i++) {
const double x=double(i)/double(Ndata-1);
*(colXInserter++)=x;
*(colY1Inserter++)=3.0+pow(x*1.3, 2.0)*1.3;
*(colY2Inserter++)=2.0+pow(x*1.3, 2.0)*1.2;
*(colY3Inserter++)=1.0+pow(x*1.3, 2.0)*1.1;
*(colY4Inserter++)=pow(x*1.3, 2.0);
}
Now we create several graph objects of type JKQTPXYScatterGraph. Each one uses a different custom symbol style:
Graphs graph3 and graph4 use JKQTPCharacterSymbol and JKQTPFilledCharacterSymbol respectively to draw spades and hearts from the unicode characters U+2660 and U+2665 respectively. The two graphs differ in the coloring of the symbols. The JKQTPCharacterSymbol variant would use the color default (cycling) graph color, but here we overwrite this with darkblue. The JKQTPFilledCharacterSymbol variant uses red filled hearts with a thin black border.
graph3->
setTitle(QObject::tr(
"spades"));
graph4->
setTitle(QObject::tr(
"hearts"));
void setSymbolFillColor(const QColor &__value)
set the color of filling of the graph symbols
void setSymbolLineWidth(double __value)
set the line width of the graph symbol outline (in pt)
void setSymbolSize(double __value)
set the size (=diameter in pt) of the graph symbol (in pt)
void setSymbolColor(const QColor &__value)
set the color of the graph symbols
void setSymbolType(JKQTPGraphSymbols __value)
set the type of the graph symbol
virtual void setTitle(const QString &__value)
sets the title of the plot (for display in key!).
void setYColumn(int __value)
the column that contains the y-component of the datapoints
void setXColumn(int __value)
the column that contains the x-component of the datapoints
This implements xy scatter plots. This also alows to draw symbols at the data points.
Definition jkqtpscatter.h:59
size_t addGraph(JKQTPPlotElement *gr)
Definition jkqtplotter.h:796
The more advanced graphs graph1 and graph2 use JKQTPRegisterCustomGraphSymbol() to register functors that draw user-specific symbols:
p.setBrush(Qt::NoBrush);
p.drawEllipse(QPointF(-0.33, -0.33/4.0), 0.33/2.0, 0.33/2.0);
p.drawEllipse(QPointF(0, -0.33/4.0), 0.33/2.0, 0.33/2.0);
p.drawEllipse(QPointF(0.33, -0.33/4.0), 0.33/2.0, 0.33/2.0);
p.drawEllipse(QPointF(-0.33/2.0, 0.33/4.0), 0.33/2.0, 0.33/2.0);
p.drawEllipse(QPointF(0.33/2.0, 0.33/4.0), 0.33/2.0, 0.33/2.0);
};
graph1->
setTitle(QObject::tr(
"olympics"));
[](QPainter& p) {
p.setBrush(Qt::NoBrush);
const double w=p.pen().widthF();
p.setPen(QPen(QColor("red"), w));
p.drawEllipse(QPointF(-0.33, -0.33/4.0), 0.33/2.0, 0.33/2.0);
p.setPen(QPen(QColor("black"), w));
p.drawEllipse(QPointF(0, -0.33/4.0), 0.33/2.0, 0.33/2.0);
p.setPen(QPen(QColor("gold"), w));
p.drawEllipse(QPointF(0.33, -0.33/4.0), 0.33/2.0, 0.33/2.0);
p.setPen(QPen(QColor("darkgreen"), w));
p.drawEllipse(QPointF(-0.33/2.0, 0.33/4.0), 0.33/2.0, 0.33/2.0);
p.setPen(QPen(QColor("darkblue"), w));
p.drawEllipse(QPointF(0.33/2.0, 0.33/4.0), 0.33/2.0, 0.33/2.0);
});
graph2->setXColumn(columnX);
graph2->setYColumn(columnY2);
graph2->setSymbolType(customsymbol_coloredolympicrings);
graph2->setSymbolSize(30);
graph2->setTitle(QObject::tr("colored olympics"));
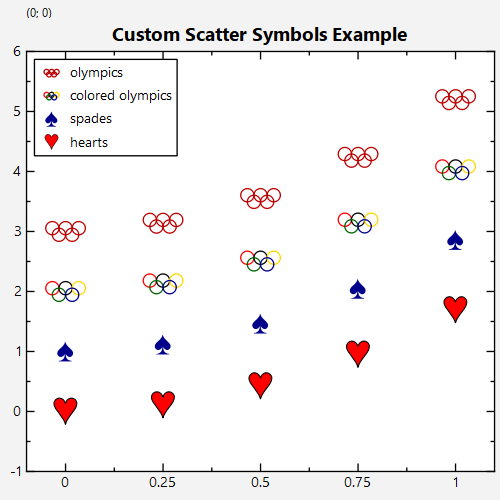
Bothe variant show the olympic rings. graph1 uses the (cycling) default graph color and graph2 draws with user-defined colors.
The result looks like this: