JKQTPlotter trunk/v5.0.0
an extensive Qt5+Qt6 Plotter framework (including a feature-richt plotter widget, a speed-optimized, but limited variant and a LaTeX equation renderer!), written fully in C/C++ and without external dependencies
Loading...
Searching...
No Matches
Example (JKQTPlotter): Parametrized Scatter-graph with custom symbols

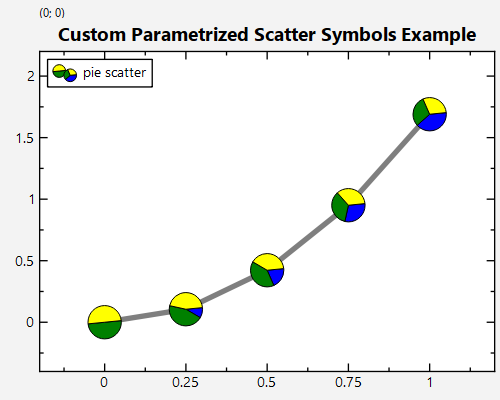
This project (see ./examples/paramscatterplot_customsymbol/) demonstrates using JKQTPlotter to draw a parametrized scatter graph (JKQTPXYParametrizedScatterGraph) with custom symbols. To demonstrate this, we create a plot with several symbols, connected by a line, where each symbol shows a pie-chart with varying fractions.

The source code of the example can be found in paramscatterplot_customsymbol.cpp.

First we create a plotter window and get a pointer to the internal datastore (for convenience). Then we add three new datacolumns and obtain back inserters.

size_t columnX=ds->addColumn("x");
auto colXInserter=ds->backInserter(columnX);
size_t columnY=ds->addColumn("y");
auto colYInserter=ds->backInserter(columnY);
size_t columnS=ds->addColumn("sym");
auto colSInserter=ds->backInserter(columnS);
This class manages data columns (with entries of type double ), used by JKQTPlotter/JKQTBasePlotter t...
Definition jkqtpdatastorage.h:282
JKQTPColumnBackInserter backInserter(int i)
returns a back-inserter iterator (JKQTPColumnBackInserter) to the i -th column in the JKQTPDatastore
size_t addColumn(JKQTPColumn col)
add a new column to the datastore and return its ID
plotter widget for scientific plots (uses JKQTBasePlotter to do the actual drawing)
Definition jkqtplotter.h:364
JKQTPDatastore * getDatastore()
returns a pointer to the datastore used by this object
Definition jkqtplotter.h:611

Now we define a functor that draws a pie chart with three segments with fractions f1 (blue), f2 (green) and 1.0-f1-f2 (yellow):

auto pieFunc=[](QPainter& p, double f1, double f2) {
double f3=1.0-f1-f2;
QRectF rec(-0.5,-0.5,1,1);
p.setPen(QPen(QColor("black"), p.pen().width(), Qt::SolidLine));
p.setBrush(QBrush(QColor("blue")));
p.drawPie(rec, 90, -f1*360*16);
p.setBrush(QBrush(QColor("green")));
p.drawPie(rec, 90-f1*360*16, -f2*360*16);
p.setBrush(QBrush(QColor("yellow")));
p.drawPie(rec, 90-(f1+f2)*360*16, -f3*360*16);
};

Now we create data for the plot, x and y follow a simple function and the symbols are encoded in a separated column, where for each datapoint, we register a new symbol using JKQTPRegisterCustomGraphSymbol(), which is drawn by a differently parametrized (f1,f2) functor pieFunc.

const int Ndata=5;
for (int i=0; i<Ndata; i++) {
// put data
const double x=double(i)/double(Ndata-1);
*(colXInserter++)=x;
*(colYInserter++)=pow(x*1.3, 2.0);
*(colSInserter++)=JKQTPRegisterCustomGraphSymbol(std::bind(pieFunc, std::placeholders::_1, x*0.4, 0.5-x*0.2));
}
JKQTCOMMON_LIB_EXPORT JKQTPGraphSymbols JKQTPRegisterCustomGraphSymbol(JKQTPCustomGraphSymbolFunctor &&)
register a JKQTPCustomGraphSymbolFunctor that draws a custom symbol.Returns an ID that allows to acce...

Finally we create a graph in the plot, which displays our datasets:

graph1->setXColumn(columnX);
graph1->setYColumn(columnY);
graph1->setSymbolSize(25);
graph1->setDrawLine(true);
graph1->setLineWidth(4);
graph1->setDrawLineInForeground(false);
graph1->setColor(QColor("black"));
graph1->setTitle(QObject::tr("pie scatter"));
void setLineWidth(double __value)
set the line width of the graph line (in pt)
void setSymbolSize(double __value)
set the size (=diameter in pt) of the graph symbol (in pt)
virtual void setTitle(const QString &__value)
sets the title of the plot (for display in key!).
void setYColumn(int __value)
the column that contains the y-component of the datapoints
void setXColumn(int __value)
the column that contains the x-component of the datapoints
This implements xy scatter plots (like JKQTPXYScatterGraph), but the color and size of the symbols ma...
Definition jkqtpscatter.h:147
void setDrawLine(bool __value)
indicates whether to draw a line or not
void setDrawLineInForeground(bool __value)
indicates whether to draw the line behind or above the symbols
void setColor(QColor c)
set color of line and symbol

The symbol type is stored in columnS, note however how we have to give a custom JKQTPXYParametrizedScatterGraph::symbolColumnFunctor, because the default one maps the values in the column to the range [0...JKQTPMaxSymbolID] in a cycling fashion (using a mod operation), but here we want to use the `stored ID directly.

graph1->setSymbolColumn(columnS);
graph1->setSymbolColumnFunctor(std::bind([](double /*x*/, double /*y*/, double symbolcolumn)->JKQTPGraphSymbols {
return static_cast<JKQTPGraphSymbols>(floor(symbolcolumn));
}, std::placeholders::_1, std::placeholders::_2, std::placeholders::_3));
plot.addGraph(graph1);
void setSymbolColumn(int __value)
this column contains the symbol type
void setSymbolColumnFunctor(FunctorToSymbol ff)
defines a functor, which converts a value from the symbolColumn into an actual symbol type
void addGraph(JKQTPPlotElement *gr)
Definition jkqtplotter.h:784
JKQTPGraphSymbols
symbols that can be used to plot a datapoint for a graph
Definition jkqtpdrawingtools.h:143

The result looks like this:

paramscatterplot_customsymbol