#include <QApplication>
#include "jkqtplotter/jkqtplotter.h"
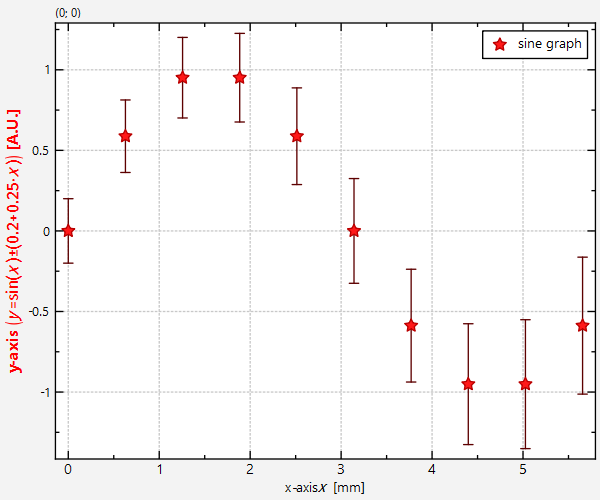
#define Ndata 10
int main(int argc, char* argv[])
{
QApplication app(argc, argv);
double X[Ndata], Y[Ndata], YERROR[Ndata];
for (int i=0; i<Ndata; i++) {
X[i]=double(i)/double(Ndata)*2.0*M_PI;
Y[i]=sin(X[i]);
YERROR[i]=0.2+double(i)/double(Ndata)*0.25;
}
graph1->
setTitle(QObject::tr(
"sine graph"));
plot.
getYAxis()->
setAxisLabel(QObject::tr(
"\\textbf{\\color{red}{y-axis} $\\left(y=\\sin(x)\\pm(0.2+0.25\\cdot x)\\right)$ [A.U.]}"));
plot.show();
plot.resize(600,400);
return app.exec();
}
void setLabelFontSize(double __value)
fontsize of the axis labels
void setShowZeroAxis(bool __value)
indicates whether to draw a thick axis line at x=0 (zero axis)
void setTickLabelFontSize(double __value)
fontsize of the axis tick labels
void setAxisLabel(const QString &__value)
axis label of the axis
This class manages data columns (with entries of type double ), used by JKQTPlotter/JKQTBasePlotter t...
Definition jkqtpdatastorage.h:223
size_t addCopiedColumn(QVector< double > &&data, const QString &name)
add a column with data from data, ownership of the memory behind data is transfered to the datastore
Definition jkqtpdatastorage.h:686
void setSymbolType(JKQTPGraphSymbols __value)
set the type of the graph symbol
virtual void setTitle(const QString &__value)
sets the title of the plot (for display in key!).
void setYColumn(int __value)
the column that contains the y-component of the datapoints
void setXColumn(int __value)
the column that contains the x-component of the datapoints
This implements xy line plots with x and y error indicators.
Definition jkqtplines.h:113
void setDrawLine(bool __value)
indicates whether to draw a line or not
void setYErrorColumn(int __value)
the column that contains the error of the x-component of the datapoints
void setYErrorStyle(JKQTPErrorPlotstyle __value)
how to draw the errors (if available) of the x-value
plotter widget for scientific plots (uses JKQTBasePlotter to do the actual drawing)
Definition jkqtplotter.h:374
void zoomToFit(bool zoomX=true, bool zoomY=true, bool includeX0=false, bool includeY0=false, double scaleX=1.05, double scaleY=1.05)
this method zooms the graph so that all plotted datapoints are visible.
Definition jkqtplotter.h:1051
JKQTPVerticalAxisBase * getYAxis(JKQTPCoordinateAxisRef axis=JKQTPPrimaryAxis)
returns the y-axis objet of the plot
Definition jkqtplotter.h:725
size_t addGraph(JKQTPPlotElement *gr)
Definition jkqtplotter.h:796
JKQTPDatastore * getDatastore()
returns a pointer to the datastore used by this object
Definition jkqtplotter.h:621
JKQTPHorizontalAxisBase * getXAxis(JKQTPCoordinateAxisRef axis=JKQTPPrimaryAxis)
returns the x-axis objet of the plot
Definition jkqtplotter.h:723
@ JKQTPErrorBars
error bars for each data point
Definition jkqtptools.h:713