|
JKQTPlotter trunk/v5.0.0
an extensive Qt5+Qt6 Plotter framework (including a feature-richt plotter widget, a speed-optimized, but limited variant and a LaTeX equation renderer!), written fully in C/C++ and without external dependencies
|
|
JKQTPlotter trunk/v5.0.0
an extensive Qt5+Qt6 Plotter framework (including a feature-richt plotter widget, a speed-optimized, but limited variant and a LaTeX equation renderer!), written fully in C/C++ and without external dependencies
|
This project (see ./examples/stepplots/) simply creates a JKQTPlotter widget (as a new window) and adds a single line-graph (a sine-wave). Data is initialized from two QVector<double> objects.
The source code of the main application can be found in stepplots.cpp. For the most part, several datasets of cosine-curves are generated. Then graphs of type JKQTPSpecialLineHorizontalGraph are added to the plot:
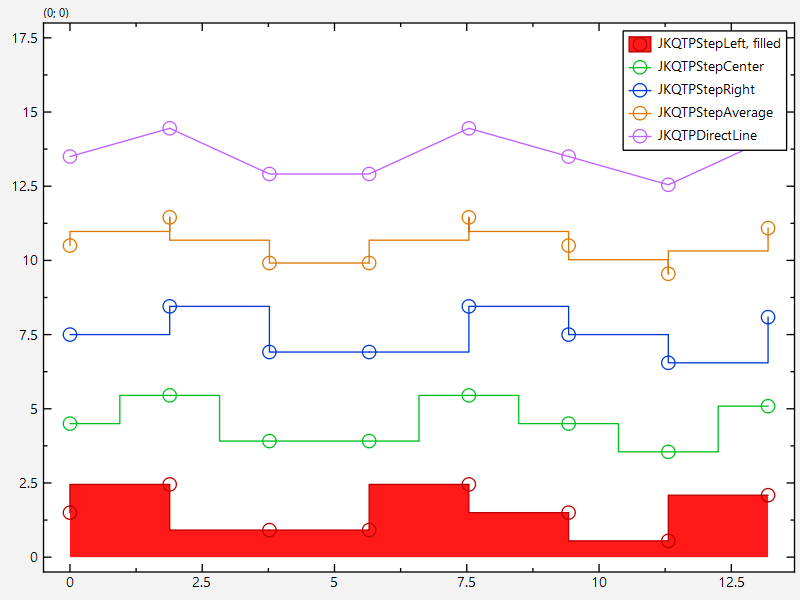
Note that you can configure the step type (left/center/right by graph->setSpecialLineType(JKQTPStepLeft). With graph->setFillCurve(true) you can draw the curve filled until the y=0-axis and with graph->setDrawLine(true) you can switch the line along the values on and off (e.g. to only have the filled area, but no line). With graph->setDrawSymbols(true) you can switch on drawing of symbols at the location of the data points.
... and all graphs are added to the plot:
In addition to the symbol type and line style, you can also alter the size of the symbols (graph->setSymbolSize(14)), the line-width used to draw them (graph->setSymbolLineWidth(1.5)) and the line width of the graph line (graph->setLineWidth(1)). If you want to switch off the line altogether, use graph->setDrawLine(false.
The result looks like this:
If you use instead of the horizontal variant and exchange x- for y-data, you will get a plot like this:
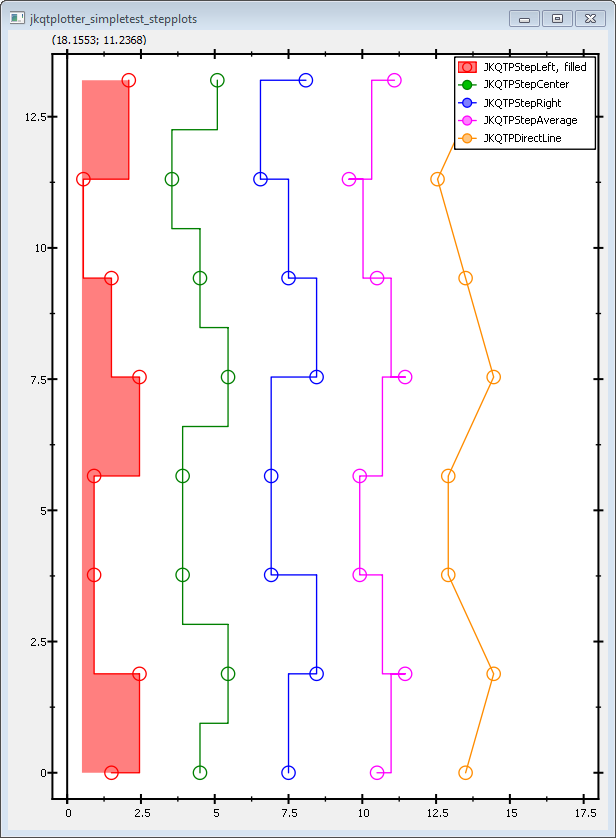
Also note how the red graph is filled towards the y-axis, not the x-axis.