JKQTPlotter trunk/v5.0.0
an extensive Qt5+Qt6 Plotter framework (including a feature-richt plotter widget, a speed-optimized, but limited variant and a LaTeX equation renderer!), written fully in C/C++ and without external dependencies
Loading...
Searching...
No Matches
Example (JKQTPlotter): Plotting Parametric Curves

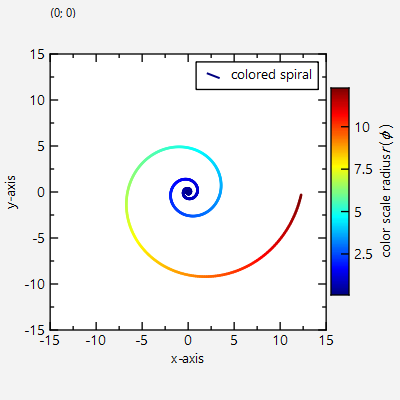
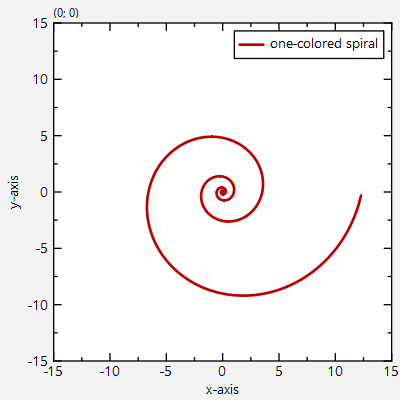
This project (see ./examples/parametriccurve/) demonstrates how to draw parametric curves [x,y]=f(t), using JKQTPXYLineGraph and JKQTPXYParametrizedScatterGraph, i.e. from a set of coordinates [xi,yi], for which the vector-values function f(t) is evaluated explicitly. If you are alloking for an example of implicit drawing by only defining the function f(t) and having JKQTPlotter evaluate it automatically and adaptively, you'll have to use JKQTPXYFunctionLineGraph, which is explained in ./examples/evalcurve

The source code of the main application can be found in parametriccurve.cpp. First, the parametric curve (here a logarithic spiral) is sampled into two columns containing the x- and y-values along the curve. In addition the radial distance from x=y=0 is added into a third column:

QVector<double> X, Y, R;
const int Ndata=500; // number of plot points in each curve
const double phiMax=4.0*M_PI;
const double a=1;
const double k=0.2;
for (double phi=-phiMax; phi<=phiMax; phi+=phiMax/double(Ndata)) {
const double x=a*exp(k*phi)*cos(phi);
const double y=a*exp(k*phi)*sin(phi);
X<<x;
Y<<y;
R<<sqrt(x*x+y*y);
}
// and copy it to the datastore
size_t columnX=ds->addCopiedColumn(X, "x");
size_t columnY=ds->addCopiedColumn(Y, "y");
size_t columnR=ds->addCopiedColumn(R, "r");

Then simples graph just uses the columns X and Y to plot the curve:

graph1->setXColumn(columnX);
graph1->setYColumn(columnY);
graph1->setDrawLine(true);
graph1->setTitle("one-colored spiral");
plot.addGraph(graph1);
void setSymbolType(JKQTPGraphSymbols __value)
set the type of the graph symbol
virtual void setTitle(const QString &__value)
sets the title of the plot (for display in key!).
void setYColumn(int __value)
the column that contains the y-component of the datapoints
void setXColumn(int __value)
the column that contains the x-component of the datapoints
This implements xy line plots. This also alows to draw symbols at the data points.
Definition jkqtplines.h:61
void setDrawLine(bool __value)
indicates whether to draw a line or not
@ JKQTPNoSymbol
plots no symbol at all (usefull together with error bars)
Definition jkqtpdrawingtools.h:144

If you use JKQTPXYParametrizedScatterGraph instead of JKQTPXYLineGraph, you can also modify the color of the line-segments, connecting the datapoints:

graph2->setXColumn(columnX);
graph2->setYColumn(columnY);
graph2->setColorColumn(columnR);
graph2->setDrawLine(true);
graph2->setTitle("colored spiral");
graph2->getColorBarRightAxis()->setAxisLabel("color scale radius $r(\\phi)$");
plot2.addGraph(graph2);
JKQTPVerticalIndependentAxis * getColorBarRightAxis()
object used for color bar axes at the right
void setColorPalette(int pal)
palette for plotting an image
This implements xy scatter plots (like JKQTPXYScatterGraph), but the color and size of the symbols ma...
Definition jkqtpscatter.h:147
void setDrawLine(bool __value)
indicates whether to draw a line or not
void setColorColumn(int __value)
this column contains the symbol color
@ JKQTPMathImageMATLAB
Definition jkqtpbasicimagetools.h:101

The result looks like this:

parametriccurve

... and with the line-color set by the radius:

parametriccurve