JKQTPlotter trunk/v5.0.0
an extensive Qt5+Qt6 Plotter framework (including a feature-richt plotter widget, a speed-optimized, but limited variant and a LaTeX equation renderer!), written fully in C/C++ and without external dependencies
Loading...
Searching...
No Matches
Example (JKQTPlotter): Draw an Artistic Image with a Parametrized Scatter Graph

This project (see ./examples/paramscatterplot_image/) demonstrates the capabilities of JKQTPXYParametrizedScatterGraph to display parametrized scatters in a rectangular arrangement. See the test program in examples/paramscatterplot for a basic example of the capabilities of JKQTPXYParametrizedScatterGraph.

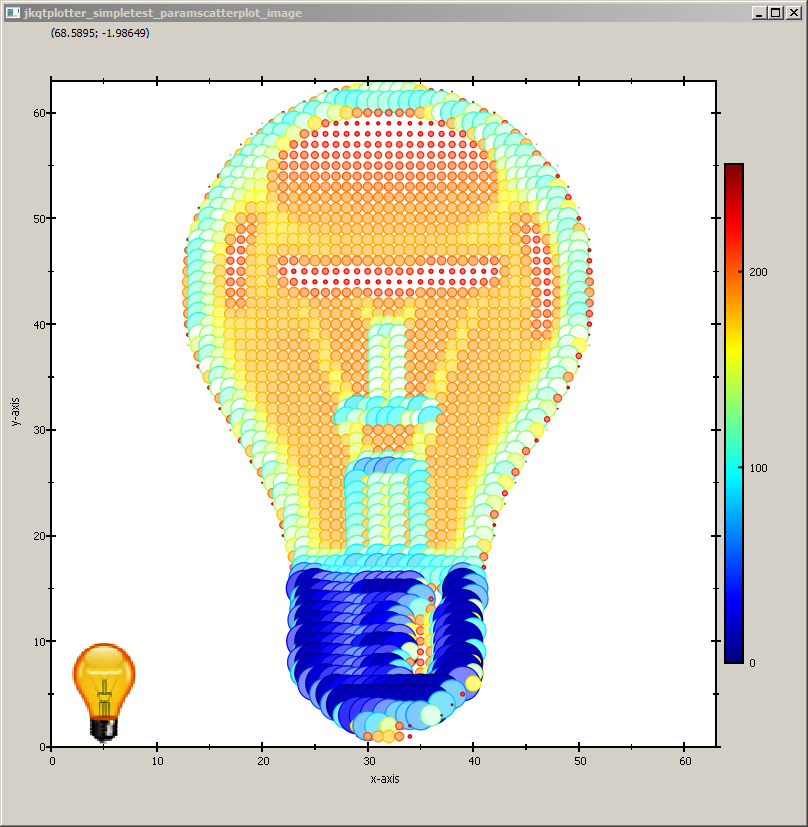
In this example, we load an image, convert it to greyscale and store it, together with x/y-coordinate-vectors in the datastore. Then a JKQTPXYParametrizedScatterGraph is used to draw the image as a pointilistic artwork, where each pixel is represented by a disk. The color of the disk is chosen from a color-palette, based on the grey-value. The size of each disk is chosen from the inverse grey value.

First we prepare the data, as described above. The image is loaded and then converted to the required data vectors.

// 2.1 load image
QImage image(":/example.bmp");
QVector<double> imageVector, pointSizes;
QVector<double> X,Y;
// 2.2 convert image to greyscale, stored in a vector in row-major order
double maxSymbolSize=30; // maximal diameter of symbols in pt
for (int y=0; y<image.height(); y++) {
for (int x=0; x<image.width(); x++) {
// calculate grey-value image vector
imageVector.push_back(qGray(image.pixel(x,y)));
// calculate point sizes from inverse grey value and scaling between 0 and maxSymbolSize
pointSizes.push_back(static_cast<double>(255-qGray(image.pixel(x,y)))/255.0*maxSymbolSize);
// calculate X/Y-coordinates (y mirrored, so image is upright)
X.push_back(x);
Y.push_back(image.height()-1-y);
}
}
// 2.3 and copy it to the datastore
size_t columnX=ds->addCopiedColumn(X, "x");
size_t columnY=ds->addCopiedColumn(Y, "y");
size_t columnG=ds->addCopiedColumn(imageVector, "greyscaleImageData");
size_t columnS=ds->addCopiedColumn(pointSizes, "pointSizes");

Now we can use th datavectors to add a JKQTPXYParametrizedScatterGraph:

graph1->setXColumn(columnX);
graph1->setYColumn(columnY);
graph1->setSizeColumn(columnS);
graph1->setColorColumn(columnG);
graph1->setDrawLine(false);
graph1->setTitle("");
plot.addGraph(graph1);
void setColorPalette(int pal)
palette for plotting an image
void setSymbolType(JKQTPGraphSymbols __value)
set the type of the graph symbol
virtual void setTitle(const QString &__value)
sets the title of the plot (for display in key!).
void setYColumn(int __value)
the column that contains the y-component of the datapoints
void setXColumn(int __value)
the column that contains the x-component of the datapoints
This implements xy scatter plots (like JKQTPXYScatterGraph), but the color and size of the symbols ma...
Definition jkqtpscatter.h:147
void setDrawLine(bool __value)
indicates whether to draw a line or not
void setSizeColumn(int __value)
this column contains the symbol size in pt
void setColorColumn(int __value)
this column contains the symbol color
@ JKQTPMathImageMATLAB
Definition jkqtpbasicimagetools.h:101
@ JKQTPFilledCircle
a filled circle
Definition jkqtpdrawingtools.h:149

For illustrative purposes, the original image is shown at the bottom-left:

JKQTPImage* graph2=new JKQTPImage(&plot);
graph2->setImage(image);
graph2->setX(0);
graph2->setY(0);
graph2->setWidth(10);
graph2->setHeight(10);
plot.addGraph(graph2);
void setHeight(double __value)
height of image
void setX(double __value)
x coordinate of lower left corner
void setWidth(double __value)
width of image
void setY(double __value)
y coordinate of lower left corner
class to plot an image from a QImage object
Definition jkqtpimage.h:296
virtual void setImage(const QImage &image)
copy an external image into an internally owned copy

Finally the plot is styled and the axis aspect ratios are fixed:

// scale the plot so the graph is contained and format the coordinate system
plot.getXAxis()->setAxisLabel("x-axis");
plot.getYAxis()->setAxisLabel("y-axis");
plot.getXAxis()->setDrawGrid(false);
plot.getYAxis()->setDrawGrid(false);
// max. size is the size of the image
plot.setXY(0,image.width()-1,0,image.height()-1);
plot.setAbsoluteXY(0,image.width()-1,0,image.height()-1);
// ensure that axis aspect ratio and coordinate system aspect ratio are maintained
plot.getPlotter()->setMaintainAspectRatio(true);
plot.getPlotter()->setAspectRatio(1);
plot.getPlotter()->setMaintainAxisAspectRatio(true);
plot.getPlotter()->setAxisAspectRatio(1);

The full test appication combines all these variants and the result looks like this:

paramscatterplot_image

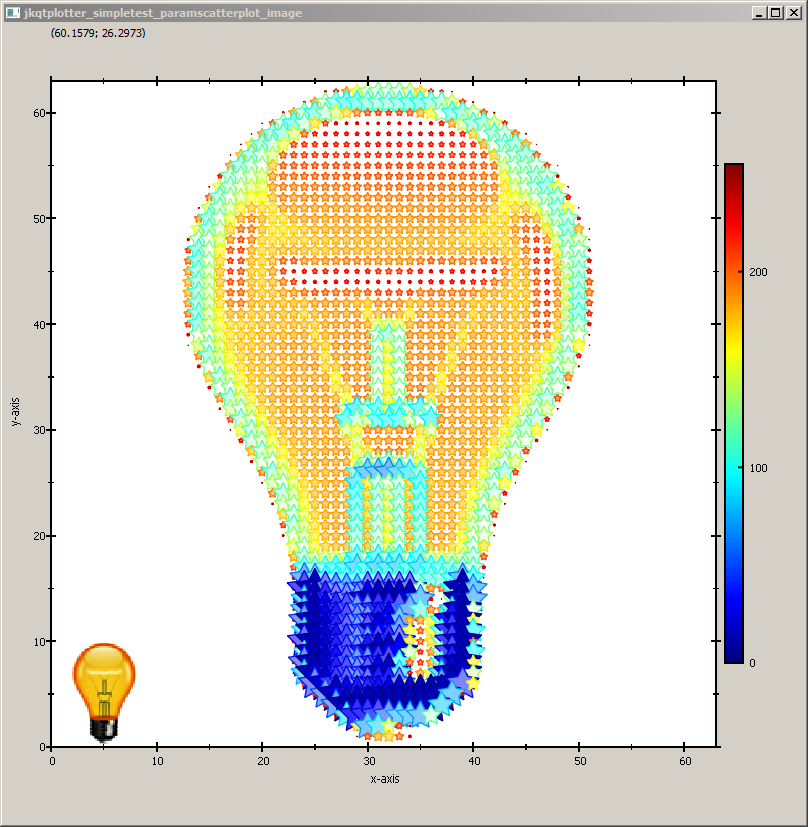
You can modify the example above in several ways, e.g. by choosing another symbol (e.g. a star):

paramscatterplot_image_star

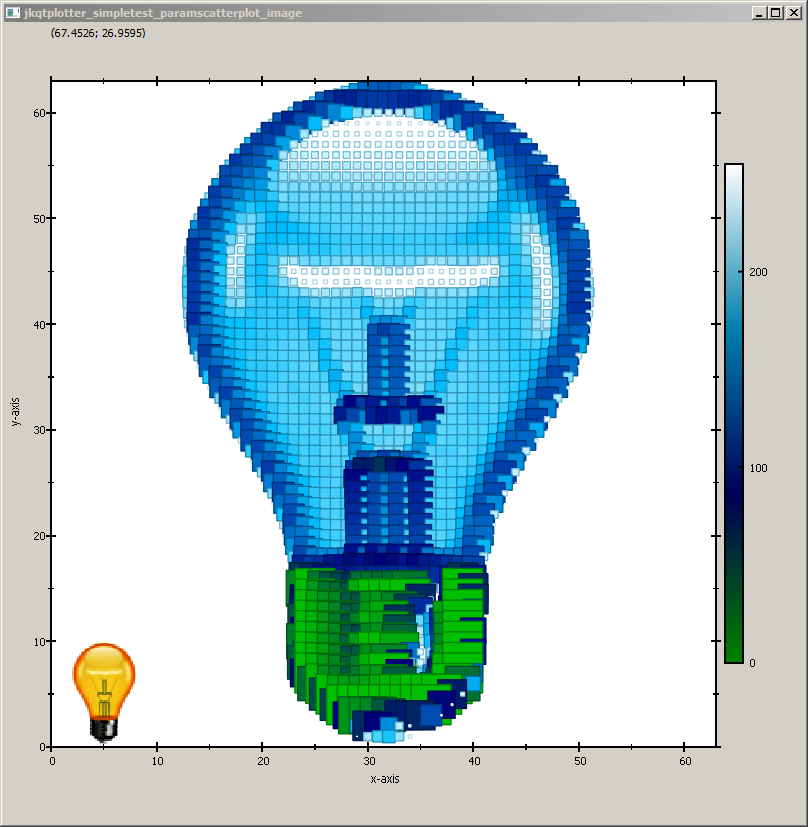
... or by changing the color palette and the symbol:

paramscatterplot_image_palette

paramscatterplot_image_palette_triangle

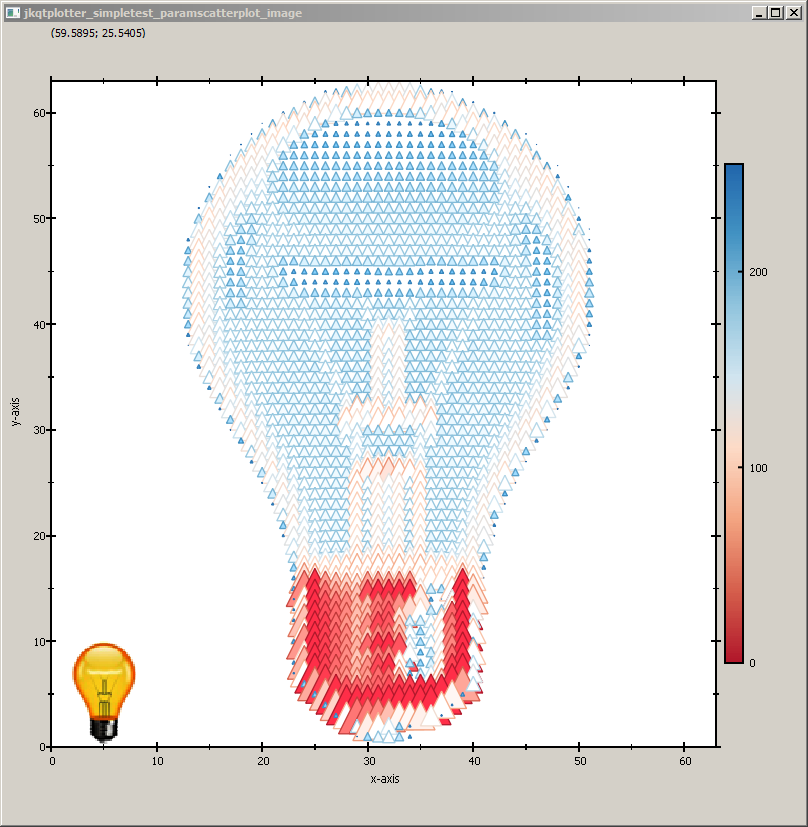
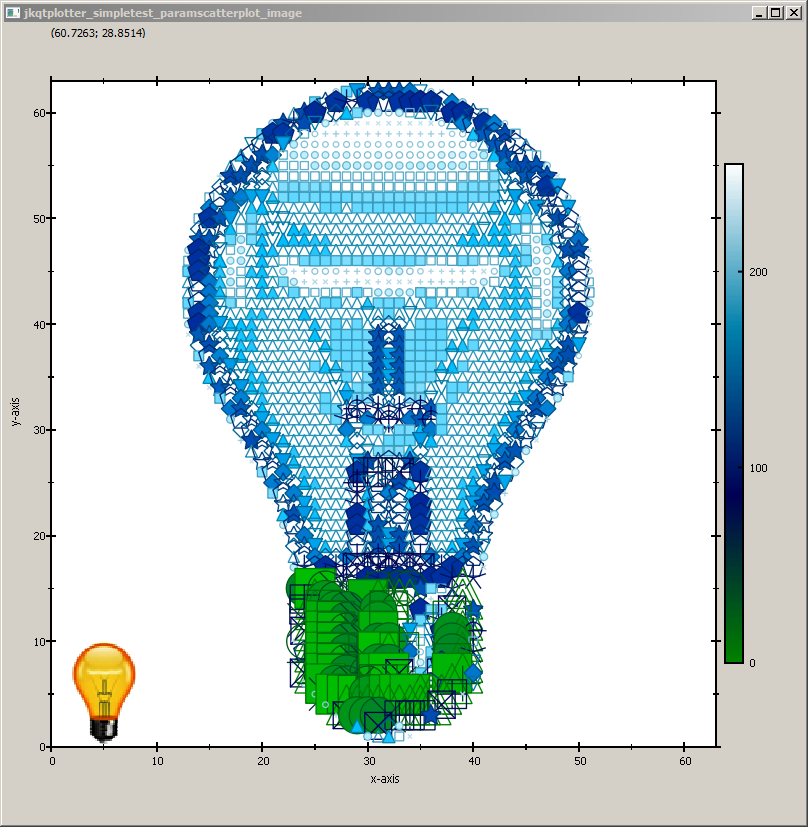
... or even to set a different symbol for each pixel, based on the values in columnS (simply add graph1->setSymbolColumn(columnS)):

paramscatterplot_image_varsymbol