JKQTPlotter trunk/v5.0.0
an extensive Qt5+Qt6 Plotter framework (including a feature-richt plotter widget, a speed-optimized, but limited variant and a LaTeX equation renderer!), written fully in C/C++ and without external dependencies
Loading...
Searching...
No Matches
Example (JKQTPlotter): Scatter Graph with Parametrized Symbols/Colors

This project (see ./examples/paramscatterplot/) demonstrates the capabilities of JKQTPXYParametrizedScatterGraph. This graph class plots symbol&line-graphs, juts like JKQTPXYLineGraph and in addition modifies several properties of each plot point by data from an additional column. These properties can be modified:

  • symbol size
  • symbol type
  • symbol/line color
  • line width

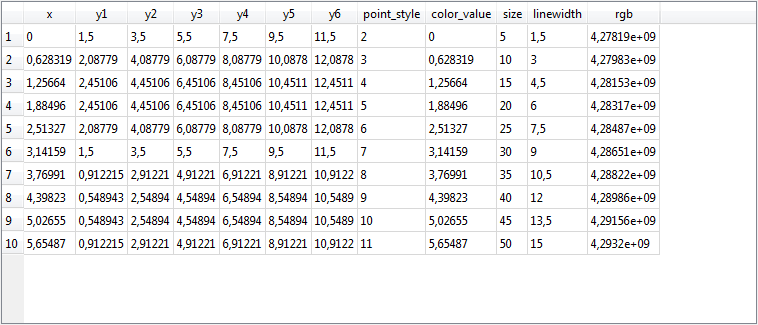
The source code of the main application can be found in paramscatterplot.cpp. First, several datasets are generated and added to the internal datastore. the resulting datatable looks like this:

paramscatterplot

Then several plots are added that modify different properties.

The simplest case is to modify the symbol type. Simply set the property symbolColumn with graph1->setSymbolColumn(columnP) to a data column. The values in the data column will be cast to an integer and then will be translated to JKQTPGraphSymbols. If the numbers are larger than the available symbol types in JKQTPGraphSymbols, the graph will cycle through the available symbols (via a modulo-operation with the max. symbol count!).

graph1->setXColumn(columnX);
graph1->setYColumn(columnY1);
graph1->setSymbolColumn(columnP);
graph1->setDrawLine(true);
graph1->setColor(QColor("blueviolet"));
graph1->setTitle("1: symbol type");
plot.addGraph(graph1);
virtual void setTitle(const QString &__value)
sets the title of the plot (for display in key!).
void setYColumn(int __value)
the column that contains the y-component of the datapoints
void setXColumn(int __value)
the column that contains the x-component of the datapoints
This implements xy scatter plots (like JKQTPXYScatterGraph), but the color and size of the symbols ma...
Definition jkqtpscatter.h:147
void setDrawLine(bool __value)
indicates whether to draw a line or not
void setSymbolColumn(int __value)
this column contains the symbol type
void setColor(QColor c)
set color of line and symbol

The next two code snippets show how to modify the size of the symbols and the line width of the lines, connecting the symbols (ensure to set graph6->setDrawLine(true), because otherwise no line will be drawn). The principle is the same as above, but here you need to set the properties sizeColumn for the symbol size and linewidthColumn for the line width. All values in the line width or symbol size columns are interpreted as sizes in dtp points (pt)!

// symbol size
graph3->setXColumn(columnX);
graph3->setYColumn(columnY3);
graph3->setSizeColumn(columnS);
graph3->setDrawLine(true);
graph3->setTitle("3: symbol size");
plot.addGraph(graph3);
// line width
graph6->setXColumn(columnX);
graph6->setYColumn(columnY6);
graph6->setLinewidthColumn(columnLW);
graph6->setDrawLine(true);
graph6->setTitle("6: line width");
plot.addGraph(graph6);
void setSymbolType(JKQTPGraphSymbols __value)
set the type of the graph symbol
void setLinewidthColumn(int __value)
this column contains the line width
void setSizeColumn(int __value)
this column contains the symbol size in pt
@ JKQTPNoSymbol
plots no symbol at all (usefull together with error bars)
Definition jkqtpdrawingtools.h:144
@ JKQTPFilledCircle
a filled circle
Definition jkqtpdrawingtools.h:149

Finally you can set the color of each symbol, based on data in the column colorColumn. Here two possibilities exist: First you can store the RGB(A) value for each datapoint explicitly. For this, you first need to create the data in the column, using the Qt-function qRgb() or [qRgba()}(http://doc.qt.io/qt-5/qcolor.html#qRgba):

QVector<double> RGB;
const int Ndata=10; // number of plot points in each curve
for (int i=0; i<Ndata; i++) {
const double x=double(i)/double(Ndata)*2.0*M_PI;
RGB<<double(qRgb(double(i)/double(Ndata)*255,0,255-double(i)/double(Ndata)*255));
}
size_t columnRGB=ds->addCopiedColumn(RGB, "rgb");

.cpp Basically the data points in a RGB(A)-column will be interpreted by castig them to QRgb.

Now you can add the graph. In order to interpret the color column as RGB(A)-values, ensure to set graph4->setColorColumnContainsRGB(true):

graph4->setXColumn(columnX);
graph4->setYColumn(columnY4);
graph4->setColorColumn(columnRGB);
graph4->setDrawLine(true);
graph4->setTitle("4: RGB-color");
plot.addGraph(graph4);
void setColorColumnContainsRGB(bool __value)
if this is true, the value in the colorColumn is converted to an integer, representing a color in ARG...
void setColorColumn(int __value)
this column contains the symbol color
@ JKQTPFilledDownTriangle
a filled triangle (tip at bottom)
Definition jkqtpdrawingtools.h:192

The second variant for setting the color of each datapoint is by mapping the values in the column to a color palette (JKQTPMathImageRYGB in this example). For this you simply need to define the color coumn and the palette to use. By default, the color palette spans the full range of values in colorColumn:

graph2->setXColumn(columnX);
graph2->setYColumn(columnY2);
graph2->setColorColumn(columnC);
graph2->setDrawLine(true);
graph2->setTitle("2: color");
graph2->getColorBarRightAxis()->setAxisLabel("color scale for graph2");
plot.addGraph(graph2);
JKQTPVerticalIndependentAxis * getColorBarRightAxis()
object used for color bar axes at the right
void setColorPalette(int pal)
palette for plotting an image
void setAxisLabel(const QString &__value)
axis label of the axis
@ JKQTPMathImageRYGB
Definition jkqtpbasicimagetools.h:103
@ JKQTPFilledRect
a filled rectangle
Definition jkqtpdrawingtools.h:151

Note: If you want to set the range manually, use ste_imageMin() and setImageMax() after setting setAutoImageRange(false).

Note also that it is possible to combine any of parametrizations above in a single graph, by setting two or more columns:

graph5->setXColumn(columnX);
graph5->setYColumn(columnY5);
graph5->setColorColumn(columnC);
graph5->setSizeColumn(columnS);
graph5->setDrawLine(true);
graph5->setTitle("5: color+size");
graph5->getColorBarRightAxis()->setAxisLabel("color scale for graph5");
plot.addGraph(graph5);
@ JKQTPMathImageBLUEYELLOW
Definition jkqtpbasicimagetools.h:234

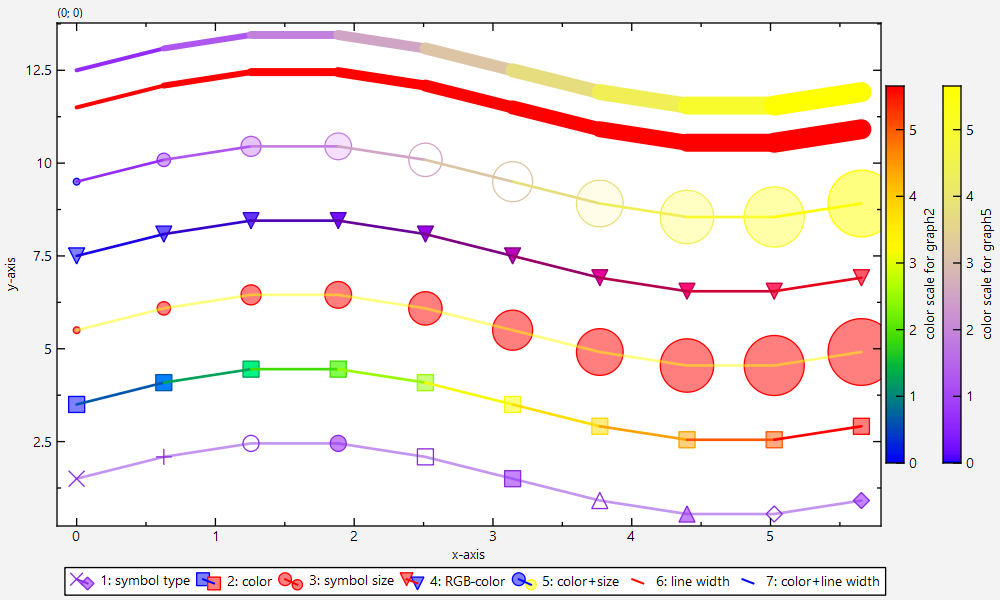
The full test appication combines all these variants and the result looks like this:
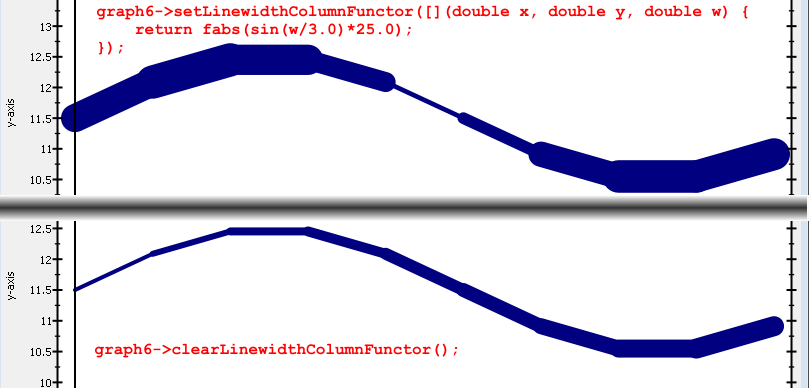
paramscatterplot

In `you can also set special functors that transform the values from the data columns (symbol type+size, datapoint), before using them for the plot, which gives you even more control. As an example you can set a special functor tograph6`:

graph6->setLinewidthColumnFunctor([](double x, double y, double w) {
return fabs(sin(w/3.0)*25.0);
});
void setLinewidthColumnFunctor(FunctorToWidth ff)
defines a functor, which converts a value from the symbolColumn into an actual line width in pt

This will result in modulated linewidths as shown below:

JKQTPXYParametrizedScatterGraph_LinewidthFunctor.png

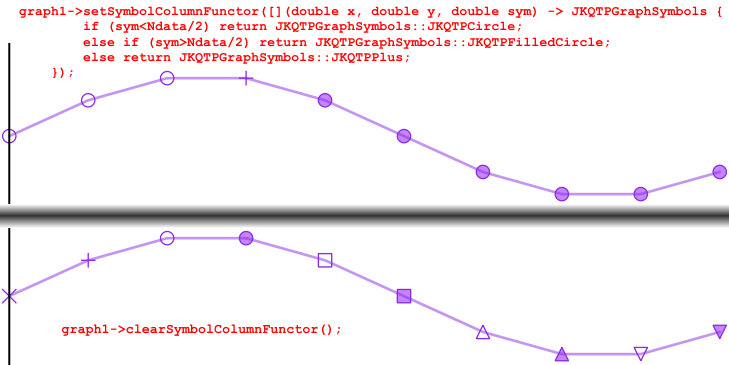
The same can be done for symbol type, e.g. with code like this:

graph1->setSymbolColumnFunctor([](double x, double y, double sym) -> JKQTPGraphSymbols {
if (sym<Ndata/2) {
} else if (sym>Ndata/2) {
} else {
}
});
void setSymbolColumnFunctor(FunctorToSymbol ff)
defines a functor, which converts a value from the symbolColumn into an actual symbol type
JKQTPGraphSymbols
symbols that can be used to plot a datapoint for a graph
Definition jkqtpdrawingtools.h:143
@ JKQTPCircle
an unfilled circle
Definition jkqtpdrawingtools.h:148
@ JKQTPPlus
a + cross
Definition jkqtpdrawingtools.h:147

This will result in symbols as shown below:

JKQTPXYParametrizedScatterGraph_SymbolFunctor.png

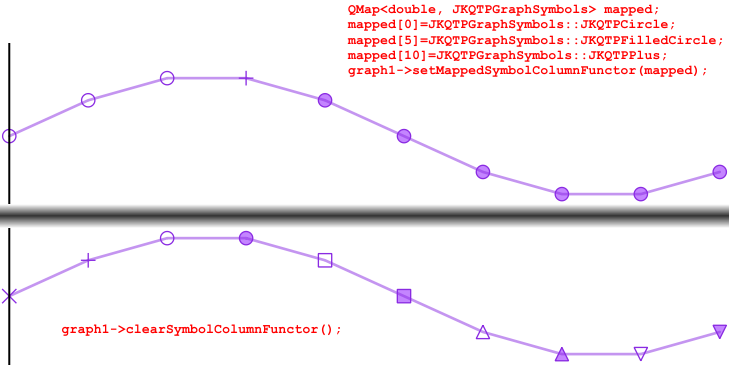
As an alternaitve for symbols, you can define the functor also in terms of a QMap:

graph1->setSymbolColumnFunctor([](double x, double y, double sym) -> JKQTPGraphSymbols {
if (sym<Ndata/2) {
} else if (sym>Ndata/2) {
} else {
}
});

This will result in symbols as shown below:

JKQTPXYParametrizedScatterGraph_MappedSymbolFunctor.png