This project (see ./examples/multithreaded/) shows how to use JKQTBasePlotter in multiple threads in parallel.
The source code of the main application can be found in multithreaded.cpp and multithreaded_thread.cpp.
The file multithreaded_thread.cpp contains a QThread class that implements the actual plotting within a static method that is also run inside the thread's QThread::run() method. It generates a plot with several line-graphs and then saves them into a PNG-file:
public:
inline static QString plotAndSave(const QString& filenamepart, int plotIndex, int NUM_GRAPHS, int NUM_DATAPOINTS, double* runtimeNanoseconds=nullptr) {
QElapsedTimer timer;
timer.start();
const QString filename=QDir(QDir::tempPath()).absoluteFilePath(QString("testimg_%1_%2.png").arg(filenamepart).arg(plotIndex));
const size_t colX=plot.getDatastore()->addLinearColumn(NUM_DATAPOINTS, 0, 10, "x");
QRandomGenerator rng;
for (int i=0; i<NUM_GRAPHS; i++) {
g->
setYColumn(plot.getDatastore()->addColumnCalculatedFromColumn(colX, [&](
double x) { return cos(x+double(i)/8.0*JKQTPSTATISTICS_PI)+rng.generateDouble()*0.2-0.1;}));
g->
setTitle(QString(
"Plot %1: $f(x)=\\cos\\leftx+\\frac{%1\\pi}{8}\\right)").arg(i+1));
}
plot.setPlotLabel(QString("Test Plot %1").arg(plotIndex+1));
plot.getXAxis()->setAxisLabel("x-axis");
plot.getYAxis()->setAxisLabel("y-axis");
plot.zoomToFit();
plot.saveAsPixelImage(filename, false, "PNG");
if (runtimeNanoseconds) *runtimeNanoseconds=timer.nsecsElapsed();
return filename;
}
protected:
inline virtual void run() {
m_filename=plotAndSave(m_filenamepart, m_plotindex, m_NUM_GRAPHS, m_NUM_DATAPOINTS, &m_runtimeNanoseconds);
}
base class for 2D plotter classes (used by the plotter widget JKQTPlotter)
Definition jkqtpbaseplotter.h:394
void setSymbolType(JKQTPGraphSymbols __value)
set the type of the graph symbol
virtual void setTitle(const QString &__value)
sets the title of the plot (for display in key!).
void setYColumn(int __value)
the column that contains the y-component of the datapoints
void setXColumn(int __value)
the column that contains the x-component of the datapoints
This implements xy line plots. This also alows to draw symbols at the data points.
Definition jkqtplines.h:61
void setDrawLine(bool __value)
indicates whether to draw a line or not
The main application in multithreaded.cpp then uses this method/thread-class to perform a test: First the function is run several times serially and then an equal amount of times in parallel.
#define NUM_PLOTS 8
#define NUM_GRAPHS 6
#define NUM_DATAPOINTS 1000
QElapsedTimer timer;
timer.start();
for (int i=0; i<NUM_PLOTS; i++) {
PlottingThread::plotAndSave("serial", i, NUM_GRAPHS, NUM_DATAPOINTS);
}
const double durSerialNano=timer.nsecsElapsed();
qDebug()<<"durSerial = "<<durSerialNano/1e6<<"ms";
QList<QSharedPointer<PlottingThread>> threads;
for (int i=0; i<NUM_PLOTS; i++) {
qDebug()<<" creating thread "<<i;
threads.append(QSharedPointer<PlottingThread>::create("parallel",i, NUM_GRAPHS, NUM_DATAPOINTS, nullptr));
}
timer.start();
for (int i=0; i<NUM_PLOTS; i++) {
qDebug()<<" staring thread "<<i;
threads[i]->start();
}
for (int i=0; i<NUM_PLOTS; i++) {
qDebug()<<" waiting for thread "<<i;
threads[i]->wait();
}
const double durParallelNano=timer.nsecsElapsed();
qDebug()<<"durParallel = "<<durParallelNano/1e6<<"ms";
threads.clear();
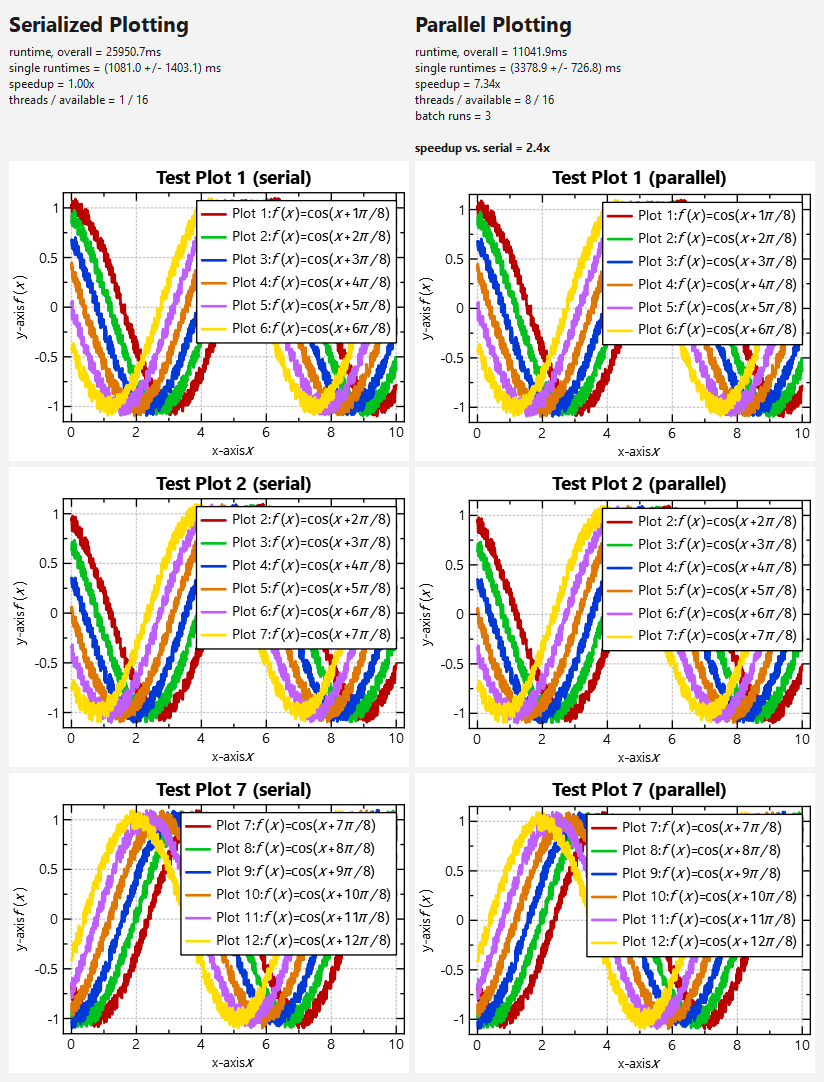
This test results in the following numbers (on my AMD Ryzen5 8/16-core laptop):
VERSION: 5.0.0 BUILD MODE: Release
SERIAL RESULTS:
runtime, overall = 20519.5ms
single runtimes = (854.9 +/- 2592.7) ms
speedup = 1.00x
threads / available = 1 / 16
PARALLEL RESULTS:
runtime, overall = 1691.4ms
single runtimes = (478.9 +/- 79.0) ms
speedup = 6.80x
threads / available = 8 / 16
batch runs = 3
speedup vs. serial = 12.1x
From this data you can observe:
- The plotting parallelizes nicely, i.e. the speedup ist >7x on a 8-core-machine. This is the speedup calculated as sum of runtimes of each thread, divided by the runtime of all threads in parallel.
- BUT: the speedup of serialized plotting vs. parallel plotting is a biz smaller: It is only 6-7x. Also the runtime in each thread is a bit longer than in the serialized example. This can be explained by the overhead due to shared caches (and therefore synchronization) between the plotters (e.g. using JKQTMathTextGetBoundingRect() within JKQTMathText).
- The variance in runtimes in the (initial) serial test-run is larger than in the parallel run. This is due to filling of the internal caches during the first plotting!
- NOTE: The parallel vs. serial speedup significantly depends on the complexity of the text rendering (i.e. usage of JKQTMathText). Therefore rendinering more complex textxs with more and more complex LaTeX markup, will result in smalle speedups!
Finally the application displays the plots: