JKQTPlotter trunk/v5.0.0
an extensive Qt5+Qt6 Plotter framework (including a feature-richt plotter widget, a speed-optimized, but limited variant and a LaTeX equation renderer!), written fully in C/C++ and without external dependencies
Loading...
Searching...
No Matches
Example (JKQTPlotter): Line Graph with Logarithmic y-axis

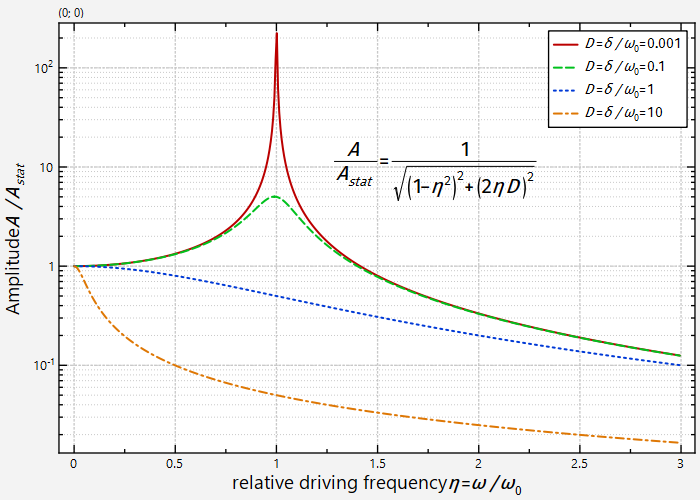
This project (see ./examples/logaxes/) simply creates a JKQTPlotter widget (as a new window) and several line-graphs of different resonance curves.

The source code of the main application can be found in logaxes.cpp. Mainly several graphs are generated in a loop and then different line styles are applied to the graphs (set by `graph->setLineStyle()). The colors are set automtically from an internal default palette. The main loop looks like this:

QVector<Qt::PenStyle> pens {Qt::SolidLine, Qt::DashLine, Qt::DotLine, Qt::DashDotLine, Qt::DashDotDotLine };
for (int id=0; id<D.size(); id++) {
// generate some plot data
QVector<double> Y;
for (auto& xx: X) {
Y<<1.0/sqrt(sqr(1-sqr(xx))+sqr(2*xx*D[id]));
}
// copy data into datastore and immediately set the yColumn
graph->setXColumn(columnX);
graph->setYColumn(ds->addCopiedColumn(Y, "y"+QString::number(id)));
// don't use symbols
// use one of different pens
graph->setLineStyle(pens[id%pens.size()]);
// set width of graph line
graph->setLineWidth(1.5);
// graph title is made from symbol+penstyle
graph->setTitle(QString("D=\\delta/\\omega_0=%1").arg(D[id]));
// add the graph to the plot, so it is actually displayed
plot.addGraph(graph);
}
void setLineWidth(double __value)
set the line width of the graph line (in pt)
void setLineStyle(Qt::PenStyle __value)
set the style of the graph line
void setSymbolType(JKQTPGraphSymbols __value)
set the type of the graph symbol
virtual void setTitle(const QString &__value)
sets the title of the plot (for display in key!).
void setYColumn(int __value)
the column that contains the y-component of the datapoints
void setXColumn(int __value)
the column that contains the x-component of the datapoints
This implements xy line plots. This also alows to draw symbols at the data points.
Definition jkqtplines.h:61
@ JKQTPNoSymbol
plots no symbol at all (usefull together with error bars)
Definition jkqtpdrawingtools.h:144

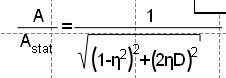
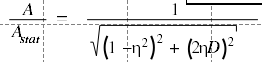
Then a JKQTPGeoText is added to the graph, which shows the function plotted in the plot:

// 4. Also we add a text-element in the plot to show the plotted function
// This element (JKQTPGeoText) is taken from the set of geometric elements
// and is simply parametrized by a position (1.25/10) and the text to display.
// In addition you can also set the font size (here to 15)
// Use '$...$' around the actual math string to ensure rendering with a math font
// (the internal renderer uses XITS fonts by default, which are free and auto-distributed
// and loaded in the library). If you don't use the math-mode modifiers, the default
// font of the other rendering text is used, which might not be suitable for
// high-quality math rendering.
plot.addGraph(new JKQTPGeoText(&plot, 1.25, 10, "$\\frac{A}{A_{stat}}=\\frac{1}{\\sqrt{\\left(1-\\eta^2\\right)^2+\\left(2{\\eta}D\\right)^2}}$", 15, QColor("black")));
This JKQTPPlotAnnotationElement is used to display text. It uses the JKQTMathText class in order to d...
Definition jkqtpgeoannotations.h:185

The difference between not using and using $...$ for the equation can be seen here:

  • no $-math-mode:
  • using $-math-mode:

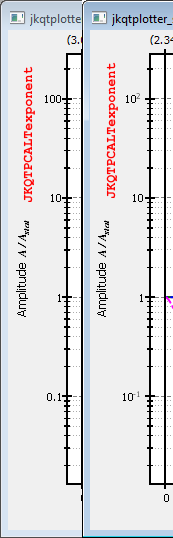
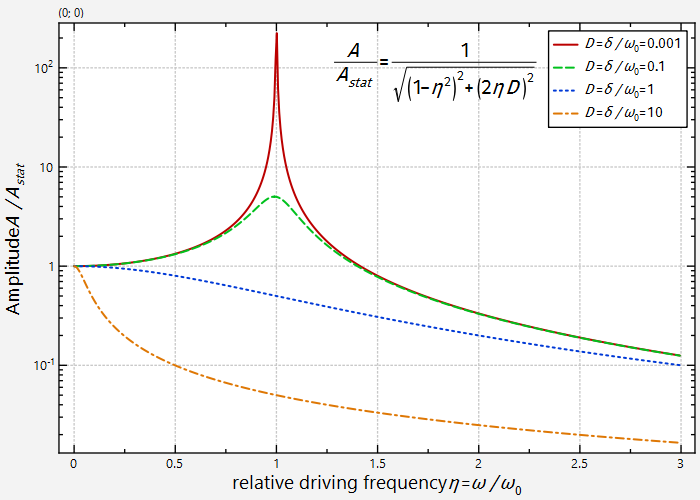
Finally the y-axis is switched to logarithmic scaling and the axis labels are set:

// 5. set y-axis to logarithmic (x-axis would be analogous, but using `plot.getXAxis()`)
plot.getYAxis()->setLogAxis(true);
// now we set the number of label ticks to 9 (you give the count if minor between two majors,
// so if you want ticks for 1,2,3,...,10,20,30,...,100... you need to use 9:
plot.getYAxis()->setMinorTicks(9);
// the minor grid is not shown by default. You can switch it on:
plot.getYAxis()->setDrawMinorGrid(true);
// usually axis ticks are shown as numbers 0.01, 0.1, 1, 10, ... You can also force the scientific
// power-of-10 notation, using:
plot.getYAxis()->setLabelType(JKQTPCALTexponent);
// the number of digits in JKQTPCALTexponent determines which labels are drawn in standard-notation,
// as compared to power-notation (e.g. if set to 1, the labels 0.1=10^{-1}, 1, 10 are shown in
// standard notation, the rest in power-notation. This tweak improves readability)
plot.getYAxis()->setLabelDigits(0);
// minor tick labels are usually not displayed, but you can switch them on, using
//plot.getYAxis()->setMinorTickLabelsEnabled(true);
// the axis font sizes can be set with:
plot.getYAxis()->setTickLabelFontSize(10); // axis tick labels
plot.getYAxis()->setMinorTickLabelFontSize(7); // minor axis tick labels
plot.getYAxis()->setLabelFontSize(14); // axis label size
plot.getXAxis()->setTickLabelFontSize(10); // axis tick labels
plot.getXAxis()->setMinorTickLabelFontSize(7); // minor axis tick labels
plot.getXAxis()->setLabelFontSize(14); // axis label size
// ... and finally set axis labels (using LaTeX notation and $...$ to improve rendering)
plot.getYAxis()->setAxisLabel("Amplitude $A/A_{stat}$");
plot.getXAxis()->setAxisLabel("relative driving frequency $\\eta=\\omega/\\omega_0$");
@ JKQTPCALTexponent
show numbers in exponential for, e.g. ...
Definition jkqtptools.h:453

As an alternative JKQTPCALTexponentCharacter does not use the power-of-10 notation, but uses the usual unit-characters, e.g. 0.001=1m, 0.000001=1ยต, 10000=10k, ...

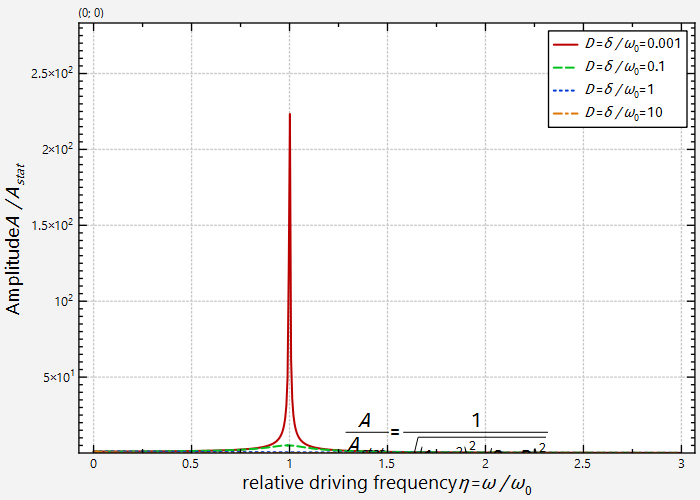
The result looks like this:

logaxes

Without the logarithmic scaling we would have:

logaxes_nolog

Switching the minor grid off results in a plot like this:

logaxes_nominorgrid

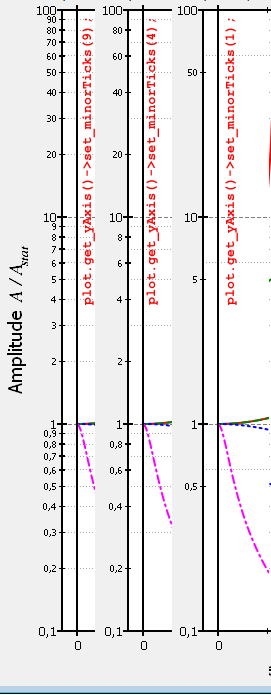
These examples show the results for different typical values for setMinorTicks():

logaxis_set_minorticks

These examples show the results for different typical values for setLabelType():

logaxis_set_labelType