JKQTPlotter trunk/v5.0.0
an extensive Qt5+Qt6 Plotter framework (including a feature-richt plotter widget, a speed-optimized, but limited variant and a LaTeX equation renderer!), written fully in C/C++ and without external dependencies
Loading...
Searching...
No Matches
Example (JKQTPlotter): Simple impulse plots

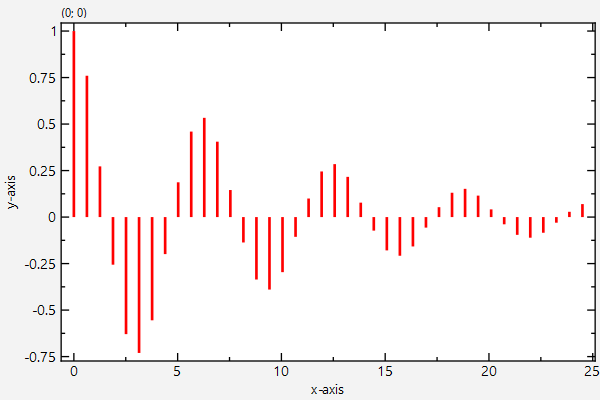
This project (see ./examples/impulsesplot/) simply creates a JKQTPlotter widget (as a new window) and adds a single impulse graph. The source code of the main application is (see impulsesplot.cpp.

First data for a curve is calculated and stored in QVector<double>:

QVector<double> X, Y;
for (int i=0; i<Ndata; i++) {
const double xx=double(i)/double(Ndata)*6.0*M_PI;
X << xx;
Y << cos(xx)*exp(-xx/10.0);
}

... and finally the data is copied into the datastore

size_t columnX=ds->addCopiedColumn(X, "x");
size_t columnY=ds->addCopiedColumn(Y, "y");

Now an impulse graph object is generated and added to the plot:

graph->setXColumn(columnX);
graph->setYColumn(columnY);
graph->setLineWidth(2);
graph->setColor(QColor("red"));
graph->setTitle(QObject::tr("$\\cos(x)\\cdot\\exp(-x/10)$"));
plot.addGraph(graph);
void setLineWidth(double __value)
set the line width of the graph line (in pt)
virtual void setColor(QColor c)
color of symbols and impulses in one call
This implements an impulse plot with impulses in direction of the Y axis (i.e. from y=0 to y=f(x) )
Definition jkqtpimpulses.h:205
virtual void setTitle(const QString &__value)
sets the title of the plot (for display in key!).
void setYColumn(int __value)
the column that contains the y-component of the datapoints
void setXColumn(int __value)
the column that contains the x-component of the datapoints

The result looks like this:

impulsesplot

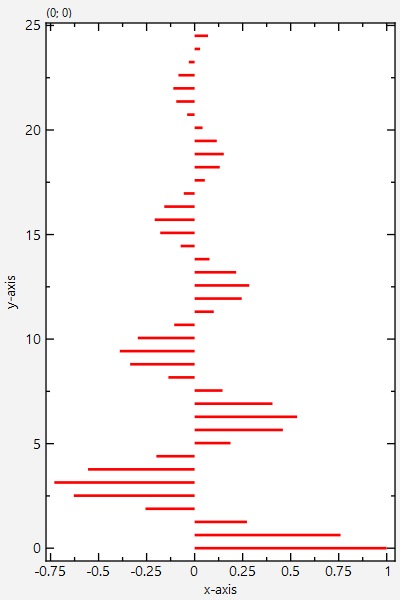
There is an alternative class JKQTPImpulsesHorizontalGraph which draws horizontal impulse plots:

graph->setYColumn(columnX);
graph->setXColumn(columnY);
graph->setLineWidth(2);
graph->setColor(QColor("blue"));
graph->setTitle(QObject::tr("$\\cos(x)\\cdot\\exp(-x/10)$"));
This implements an impulse plot with horizontal impulses in direction of the X axis (i....
Definition jkqtpimpulses.h:111

This code snippet results in a plot like this:

impulsesplot

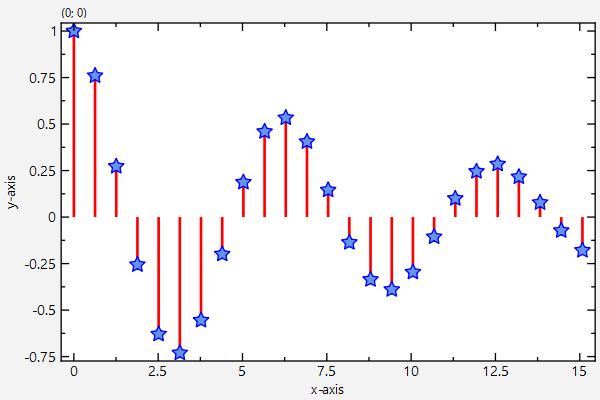
The classes JKQTPImpulsesVerticalGraph and JKQTPImpulsesHorizontalGraph also provide the ability to draw a symbol at the end of the impulse, e.g. using this code:

graph->setDrawSymbols(true);
void setSymbolType(JKQTPGraphSymbols __value)
set the type of the graph symbol
void setDrawSymbols(bool __value)
indicates whether to draw symbols at the top of the impulse
@ JKQTPFilledStar
a filled diamond
Definition jkqtpdrawingtools.h:157

This code snippet results in a plot like this:

impulsesplot_symbols

Finally you can move the baseline (i.e. the level, where the impulses start, which is typically x=0 or y=0) in the classes JKQTPImpulsesVerticalGraph and JKQTPImpulsesHorizontalGraph:

graph->setBaseline(0.25);
void setBaseline(double __value)
baseline of the plot (NOTE: 0 is interpreted as until plot border in log-mode!!!)

This code snippet results in a plot like this:

impulsesplot_baseline