|
JKQTPlotter trunk/v5.0.0
an extensive Qt5+Qt6 Plotter framework (including a feature-richt plotter widget, a speed-optimized, but limited variant and a LaTeX equation renderer!), written fully in C/C++ and without external dependencies
|
|
JKQTPlotter trunk/v5.0.0
an extensive Qt5+Qt6 Plotter framework (including a feature-richt plotter widget, a speed-optimized, but limited variant and a LaTeX equation renderer!), written fully in C/C++ and without external dependencies
|
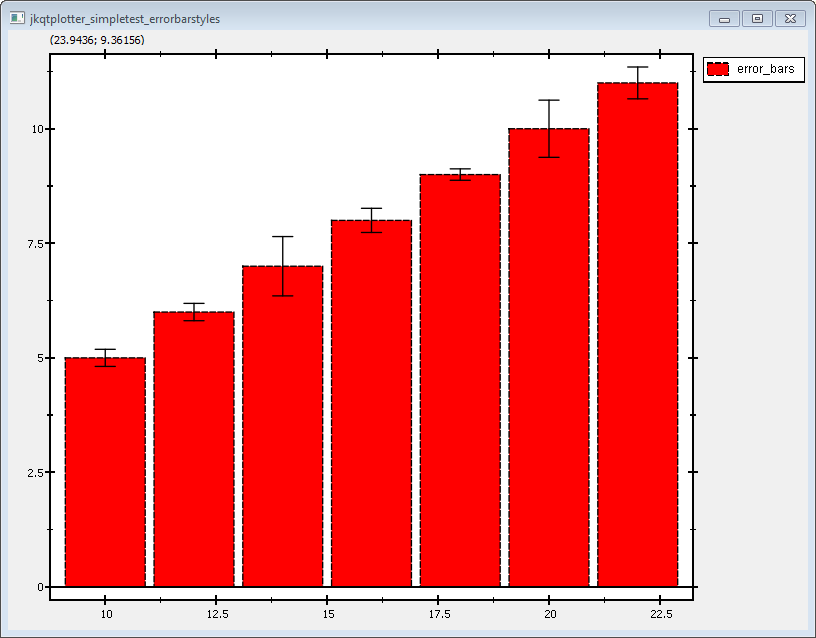
This project (see ./examples/errorbarstyles/) simply creates a JKQTPlotter widget (as a new window) and adds several curves show-casing different styles of error indicators. Data is initialized from two QVector<double> objects.
Note: This examples explains how to plot graphs with error indicators, when the data has already been calculated. The tutorial 1-Dimensional Group Statistics with JKQTPDatastore explains one way how to use the JKQTPlotter Statistics Library in order to calculate the errors from data.
The source code of the main application can be found in errorbarstyles.cpp.
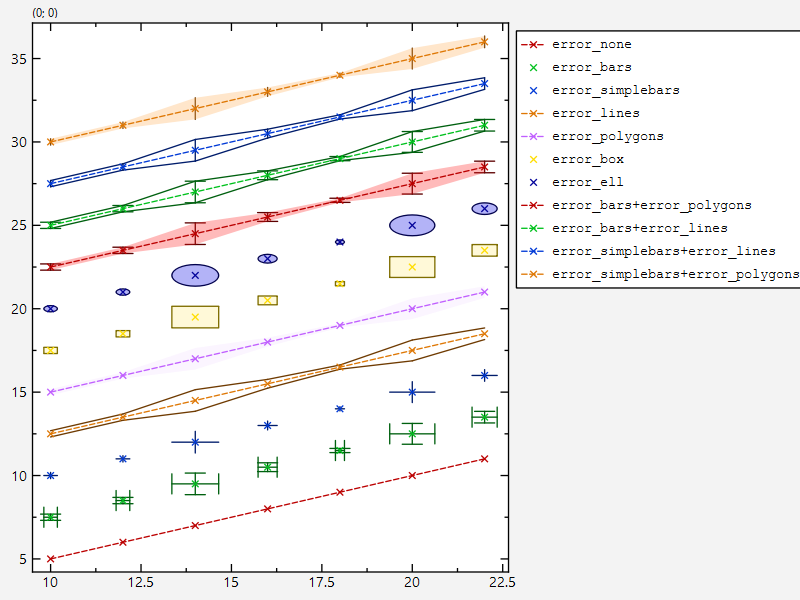
First some data is added to the internal datastore (mostly, like explained in several other examples, like e.g. Line Graph with Different Symbols and Line Styles). The (in a loop) several graphs are added, each with a distinct style for its error indicators:
The error styles are set in these lines:
There are several variables that can be used to further style the error indicator, like:
There are more properties that you can find in the documentation of the mix-in classes JKQTPXYGraphErrors, JKQTPXGraphErrors, JKQTPYGraphErrors, JKQTPGraphErrors.
In addition the plot key is moved outside the pot and the grid in the plot is switched off:
The result looks like this:
Error bars are implemented in the mixin-classes JKQTPXYGraphErrors, JKQTPXGraphErrors and JKQTPYGraphErrors that are all derived from JKQTPGraphErrors. With these it is simple to add error indicators to several different plot styles. Usually you can recognize these by looking at the class name, e.g. JKQTPXYLineGraph is a simple line+symbol graph, and JKQTPXYLineErrorGraph is the same with error indictaors (see above). There are also several other plots with error indicators: