This project (see vectorfield demonstrates the use of JKQTPVectorFieldGraph to visualize a vector field.
The source code of the main application is (see vectorfield.cpp.
Here is a short summary of the important parts of the code:
graph1->
setTitle(QObject::tr(
"$\\vec{f}(x,y)=\\bigl[\\sin(y)\\cdot\\sqrt{x/3}, \\cos(x)\\cdot\\sqrt{x/3}\\bigr]^\\mathrm{T}$"));
This class manages data columns (with entries of type double ), used by JKQTPlotter/JKQTBasePlotter t...
Definition jkqtpdatastorage.h:282
std::pair< size_t, size_t > addLinearGridColumns(size_t width, double startX, double endX, size_t height, double startY, double endY, const QString &nameX=QString(""), const QString &nameY=QString(""))
add two columns to the datastore that contains the x- and y- coordinates of a rectangular grid with w...
size_t addCalculatedColumnFromColumn(size_t otherColumn, const std::function< double(double)> &f, const QString &name=QString(""))
add a column with the same number of entries, as in the other column otherColumn ,...
virtual void setTitle(const QString &__value)
sets the title of the plot (for display in key!).
This graph plots a vector field, i.e. a set of vectors (dx,dy) or (angle,length) at positions (x,...
Definition jkqtpvectorfield.h:96
void setDyColumn(int col)
the column that contains the delta along the y-axis.
void setDxColumn(int col)
the column that contains the delta along the x-axis.
void setXYColumns(size_t xCol, size_t yCol)
sets xColumn and yColumn at the same time
plotter widget for scientific plots (uses JKQTBasePlotter to do the actual drawing)
Definition jkqtplotter.h:374
size_t addGraph(JKQTPPlotElement *gr)
Definition jkqtplotter.h:796
JKQTPDatastore * getDatastore()
returns a pointer to the datastore used by this object
Definition jkqtplotter.h:621
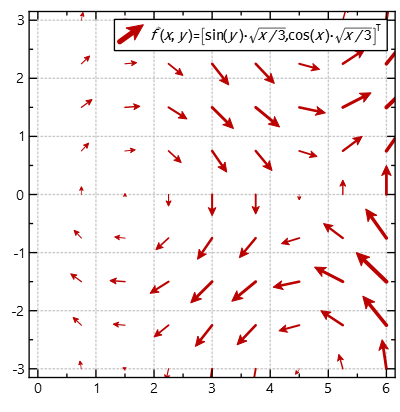
The result looks like this:
By default, the length of the drawn vector is determined from the actual length in the data via an autoscaling algorithm that is supposed to prevent the vectors from overlapping. But you can modify this behaviour by adding a line
void setVectorLengthMode(VectorLengthMode newMode)
indicates how the length of the drawn vectors are determined from the data
@ LengthFromData
the vector's length is determined by the data directly
Definition jkqtpvectorfield.h:113
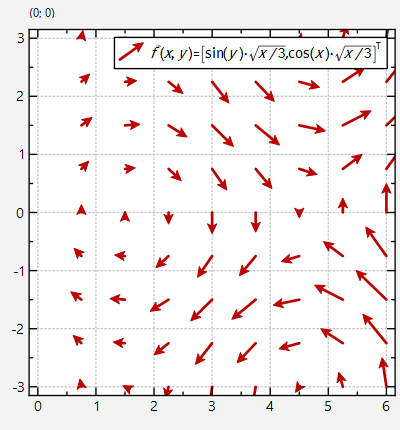
which will use the given lengths directly (only scaled by an optional factor defined by JKQTPVectorFieldGraph::setLengthScaleFactor() ). The result then looks like this:
Alternatively you can also set
@ IgnoreLength
all vectors have the same length
Definition jkqtpvectorfield.h:114
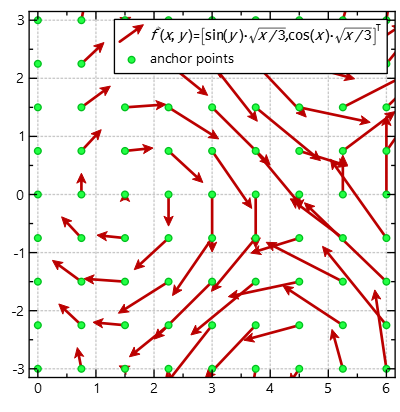
which will draw all vectors with the same length. You can scale this length by setting JKQTPVectorFieldGraph::setAutoscaleLengthFactor() ). The result then looks like this:
Finally it is also possibly to scale the vector's line width with its length:
@ AutoscaleLineWidthFromLength
line width is determined from the vector length. The maximum line width is given by JKQTPGraphLineSty...
Definition jkqtpvectorfield.h:121
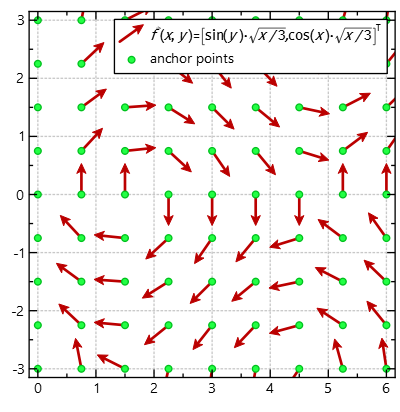
void setVectorLineWidthMode(VectorLineWidthMode m)
determines how the line width of the vectors is derived.
@ AutoscaleLength
this is the default: vector lengths are autoscaled, so they don't overlap (in first approximation)
Definition jkqtpvectorfield.h:112
This will result in a plot like this: