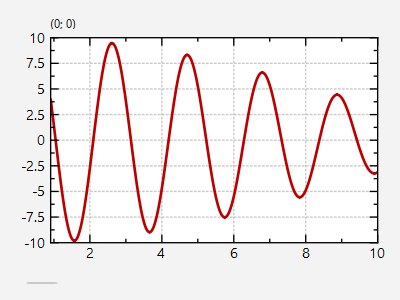
This project (see ./examples/ui_bind_scrollbar/) shows how to use JKQTPlotter together with a QScrollBar for panning.
The source code of the main application can be found in ui_bind_scrollbar.cpp.
First we create a QWidget, a plot and a QScrollBar in a layout:
QWidget win;
QVBoxLayout* lay=new QVBoxLayout();
win.setLayout(lay);
lay->addWidget(plot);
QScrollBar* scroll=new QScrollBar(Qt::Horizontal, &win);
scroll->setMinimum(0);
scroll->setMaximum(100);
scroll->setPageStep(10);
lay->addWidget(scroll);
plotter widget for scientific plots (uses JKQTBasePlotter to do the actual drawing)
Definition jkqtplotter.h:374
Then we add a plot ranging from x=0 to x=100, with 10000 datapoints:
const int NPOINTS=10000;
This class manages data columns (with entries of type double ), used by JKQTPlotter/JKQTBasePlotter t...
Definition jkqtpdatastorage.h:282
size_t addLinearColumn(size_t rows, double start, double end, const QString &name=QString(""))
add a column to the datastore that contains rows rows with monotonely increasing value starting at st...
size_t addCalculatedColumnFromColumn(size_t otherColumn, const std::function< double(double)> &f, const QString &name=QString(""))
add a column with the same number of entries, as in the other column otherColumn ,...
void setSymbolType(JKQTPGraphSymbols __value)
set the type of the graph symbol
void setYColumn(int __value)
the column that contains the y-component of the datapoints
void setXColumn(int __value)
the column that contains the x-component of the datapoints
This implements xy line plots. This also alows to draw symbols at the data points.
Definition jkqtplines.h:61
void setDrawLine(bool __value)
indicates whether to draw a line or not
size_t addGraph(JKQTPPlotElement *gr)
Definition jkqtplotter.h:796
JKQTPDatastore * getDatastore()
returns a pointer to the datastore used by this object
Definition jkqtplotter.h:621
The plot axis range is limited to the plot range and zooming in y-direction is disabled
void setRangeFixed(bool fixed)
fixes/ufixes the axis
void setY(double yminn, double ymaxx)
sets the y-range of the plot (minimum and maximum y-value on the y-axis)
Definition jkqtplotter.h:1176
JKQTPVerticalAxisBase * getYAxis(JKQTPCoordinateAxisRef axis=JKQTPPrimaryAxis)
returns the y-axis objet of the plot
Definition jkqtplotter.h:725
void setAbsoluteXY(double xminn, double xmaxx, double yminn, double ymaxx)
sets absolutely limiting x- and y-range of the plot
Definition jkqtplotter.h:1170
Now we need a slot for the QScrollBar (here implemented as a functor), which calculates the desired view in the graph and sets it. Note the blockSignals()-calls that stop the plot from sending signals back to the scrollbar, which would cause a strange loop due to the fact that the scrollbar only accepts integers for range and value!
QObject::connect(scroll, &QScrollBar::valueChanged, [plot,scroll](int value) {
const double scrollRange=scroll->maximum()-scroll->minimum()+scroll->pageStep();
const double scrollPos=scroll->value();
const double scrollPageSize=scroll->pageStep();
const double scrollRelative=scrollPos/scrollRange;
const double plotViewRange=scrollPageSize/scrollRange*plotFullRange;
const double plotViewStart=plot->
getAbsoluteXMin()+scrollRelative*plotFullRange;
plot->blockSignals(true);
plot->
setX(plotViewStart, plotViewStart+plotViewRange);
plot->blockSignals(false);
});
scroll->setValue(1);
void setX(double xminn, double xmaxx)
sets the x-range of the plot (minimum and maximum x-value on the x-axis)
Definition jkqtplotter.h:1173
double getAbsoluteXMin() const
returns the absolute x-axis min of the primary x-axis. This is the lowest allowed value the the axis ...
Definition jkqtplotter.h:840
double getAbsoluteXMax() const
returns the absolute x-axis max of the primary x-axis This is the highest allowed value the the axis ...
Definition jkqtplotter.h:842
A second functor catches whenever the user zooms or pans (or otherwise changes the axis ranges) of the plot by catching the signal JKQTPlotter::zoomChangedLocally() and from that calculates the value (and pageStep) for the QScrollBar:
const double plotViewRange=newxmax-newxmin;
const double plotRelViewRange=(plotViewRange>=plotFullRange)?1.0:(plotViewRange/(plotFullRange-plotViewRange));
const double plotRelViewStart=(newxmin-plot->
getAbsoluteXMin())/plotFullRange;
const double scrollRange=scroll->maximum()-scroll->minimum();
scroll->blockSignals(true);
scroll->setPageStep(plotRelViewRange*scrollRange);
scroll->setValue(plotRelViewStart*scrollRange);
scroll->blockSignals(false);
});
void zoomChangedLocally(double newxmin, double newxmax, double newymin, double newymax, JKQTPlotter *sender)
signal: emitted whenever the user selects a new x-y zoom range (in the major axes,...
The window from this example looks like this:

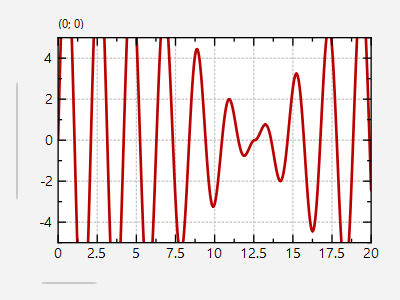
With the same method, it is also possible to add x- and y-scrollbars:


