|
JKQTPlotter trunk/v5.0.0
an extensive Qt5+Qt6 Plotter framework (including a feature-richt plotter widget, a speed-optimized, but limited variant and a LaTeX equation renderer!), written fully in C/C++ and without external dependencies
|
|
JKQTPlotter trunk/v5.0.0
an extensive Qt5+Qt6 Plotter framework (including a feature-richt plotter widget, a speed-optimized, but limited variant and a LaTeX equation renderer!), written fully in C/C++ and without external dependencies
|
This project (see ./examples/filledgraphs/) simply creates a JKQTPlotter widget (as a new window) and adds several filled curve graphs (Histograms). Data is initialized from QVector<int> objects.
The source code of the main application can be found in filledgraphs.cpp.
First the data columns for three x-y-curves are generated. One column of x-values with entries 0,1,2,...,254,255 (256 entries).
And three columns with 256 entries each, which will be filled with the R-, G- and B-histograms of an image example.bmp:
In order to calculate the histograms, first all enries in the columns are set to 0:
Finally the histogram is calculated:
Finally three JKQTPFilledCurveXGraph objects are generated and added to the plot (here we show the code for the R-channel only):
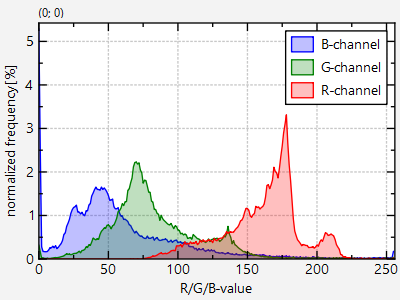
The curves are fille with a semi-transparent color, which is achieved by setting col.setAlphaF(0.25) on the graph color col.
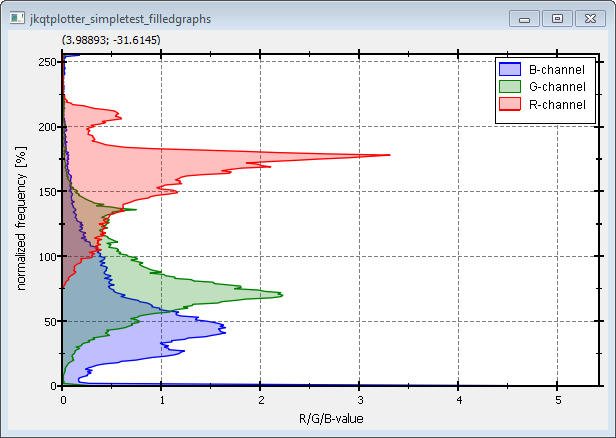
The result looks like this:
If you use JKQTPFilledCurveYGraph instead of JKQTPFilledCurveXGraph, the curve will not be filled until the y=0-axis, but until the x=0-axis. Of course you will also have to swap the x- and y-data columns. The result will look like this: