|
JKQTPlotter trunk/v5.0.0
an extensive Qt5+Qt6 Plotter framework (including a feature-richt plotter widget, a speed-optimized, but limited variant and a LaTeX equation renderer!), written fully in C/C++ and without external dependencies
|
|
JKQTPlotter trunk/v5.0.0
an extensive Qt5+Qt6 Plotter framework (including a feature-richt plotter widget, a speed-optimized, but limited variant and a LaTeX equation renderer!), written fully in C/C++ and without external dependencies
|
Classes | |
| class | JKQTPGeoSymbol |
| This virtual JKQTPPlotAnnotationElement descendent may be used to display a single symbol (marker). More... | |
| class | JKQTPGeoText |
| This JKQTPPlotAnnotationElement is used to display text. It uses the JKQTMathText class in order to display LaTeX formulas. More... | |
| class | JKQTPHorizontalRange |
| simply marks a range (and possibly a centerline) in a plot. This may be used to display e.g. mean +/- stddev or a range of interest, or the range of good values, ... More... | |
| class | JKQTPRangeBase |
| simply marks a range (and possibly a centerline) in a plot. This may be used to display e.g. mean +/- stddev or a range of interest, or the range of good values, ... More... | |
| class | JKQTPVerticalRange |
| simply marks a range (and possibly a centerline) in a plot. This may be used to display e.g. mean +/- stddev or a range of interest, or the range of good values, ... More... | |
| Screenshot | Classes |
|---|---|

| JKQTPGeoSymbol |
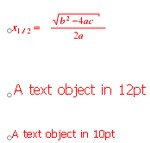
| JKQTPGeoText |
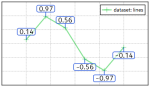
| JKQTPXYGraphLabels |
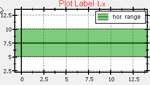
| JKQTPHorizontalRange, JKQTPVerticalRange |
Examples: