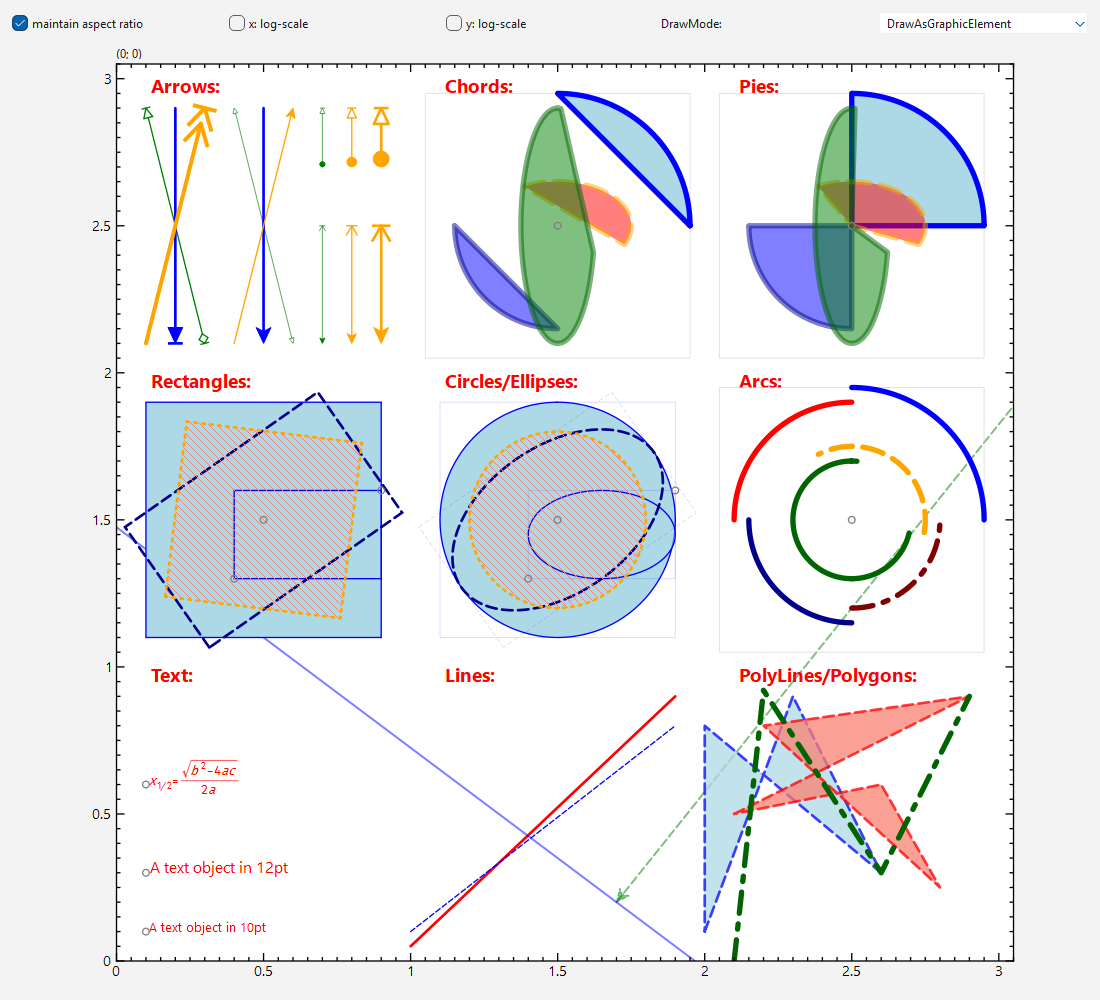
plot->addGraph(
new JKQTPGeoText(plot, 0.1,0.6,
"$x_{1/2}=\\frac{\\sqrt{b^2-4ac}}{2a}$", 10, QColor(
"red")));
plot->addGraph(l=
new JKQTPGeoLine(plot, 1, 0.05, 1.9, 0.9));
infLine->
setStyle(QColor(
"green"), 1.5, Qt::PenStyle::DashLine);
plot->addGraph(infLine);
QVector<QPointF> p;
p<<QPointF(2.1, 0.0)<<QPointF(2.2, 0.92)<<QPointF(2.6, 0.3)<<QPointF(2.9, 0.9);
poly->setStyleTransparentFill(QColor("darkgreen"), 4, Qt::PenStyle::DashDotLine);
rec->
setStyle(QColor(
"blue"), 1, Qt::SolidLine, rfill, Qt::SolidPattern);
plot->addGraph(ell=
new JKQTPGeoEllipse(plot, QPointF(0.4,1.3), QPointF(0.9,1.6)));
ell->
setStyle(QColor(
"blue"), 1, Qt::SolidLine, rfill, Qt::SolidPattern);
polygongraph->
setStyle(QColor(
"red"), 2, Qt::PenStyle::DashLine, QColor(
"salmon"), Qt::SolidPattern);
plot->addGraph(polygongraph);
plot->addGraph(
new JKQTPGeoArc(plot,2.5,1.5,0.5,0.5, -10, 117 ));
plot->addGraph(
new JKQTPGeoPie(plot,2.5,2.5,0.9,0.9, 0, 90));
This JKQTPGeometricPlotElement is used to draw an arc.
Definition jkqtpgeolines.h:600
This convenience specialisation of JKQTPGeoLine is used to draw a line with decorations (e....
Definition jkqtpgeolines.h:190
virtual void setStyle(QColor color, double lineWidth)
set several of the style properties with one call
virtual void setAlpha(float alpha)
sets the alpha-channel of the color (i.e. its transparency)
virtual void setStyle(QColor color, double lineWidth)
set several of the style properties with one call
void setStyleTransparentFill(QColor color, double lineWidth, Qt::PenStyle style)
set several of the style properties with one call, sets fill to transparent
virtual void setAlpha(float alpha) override
sets the alpha-channel of the color and fillColor (i.e. its transparency) to the same value
virtual void setStyle(QColor color, double lineWidth, Qt::PenStyle style, QColor fillColor, Qt::BrushStyle fillStyle)
set several of the style properties with one call
This JKQTPGeometricPlotElement is used to draw a chord.
Definition jkqtpgeoshapes.h:477
This JKQTPGeometricPlotElement is used to draw an ellipse.
Definition jkqtpgeoshapes.h:300
This JKQTPGeometricPlotElement is used to draw an infinite line.
Definition jkqtpgeolines.h:279
void setTwoSided(bool __value)
indicates whether the line ends at the given point (false, default), or is infinite in both directio...
This JKQTPGeometricPlotElement is used to draw a line, optionally line-end decorations (aka arrows) a...
Definition jkqtpgeolines.h:62
This JKQTPGeometricPlotElement is used to draw a pie.
Definition jkqtpgeoshapes.h:404
This JKQTPGeometricPlotElement is used to draw a poly line.
Definition jkqtpgeolines.h:378
This JKQTPGeometricPlotElement is used to draw a polygon.
Definition jkqtpgeoshapes.h:202
void appendPoint(const QPointF &p)
append a point to the polygon
This JKQTPGeometricPlotElement is used to draw a rectangle.
Definition jkqtpgeoshapes.h:49
void setAngle(double __value)
rotation angle of rectangle [degrees] around (x,y)
This virtual JKQTPPlotAnnotationElement descendent may be used to display a single symbol (marker).
Definition jkqtpgeoannotations.h:42
This JKQTPPlotAnnotationElement is used to display text. It uses the JKQTMathText class in order to d...
Definition jkqtpgeoannotations.h:185
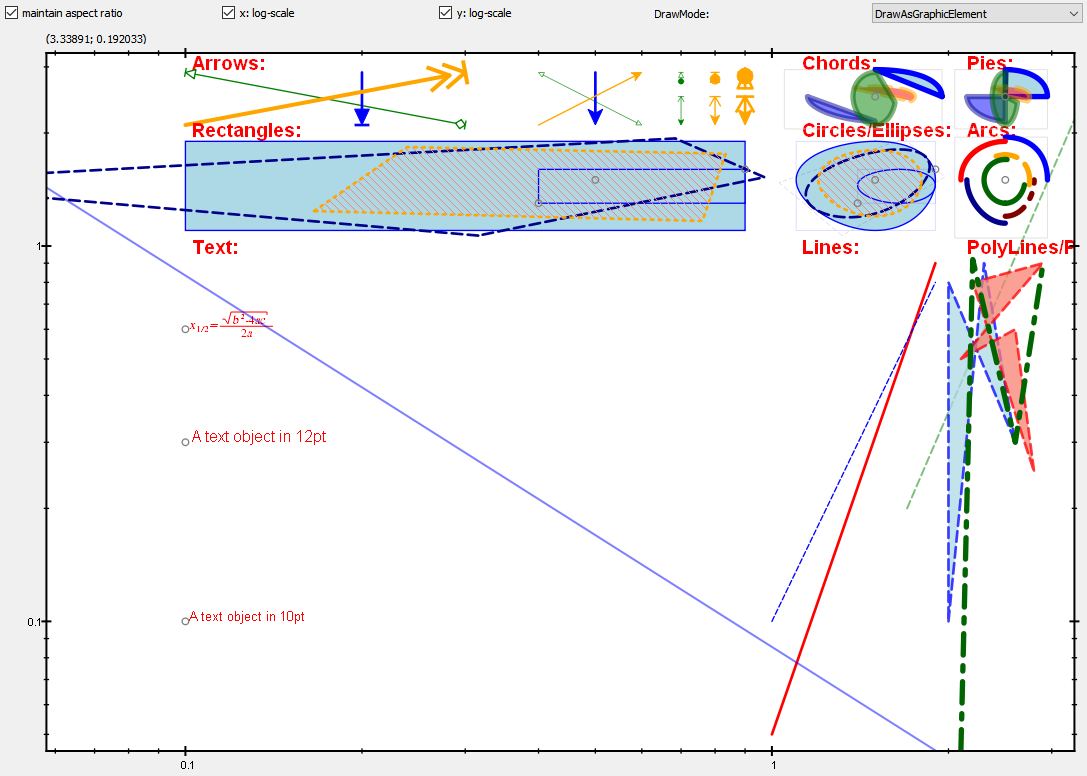
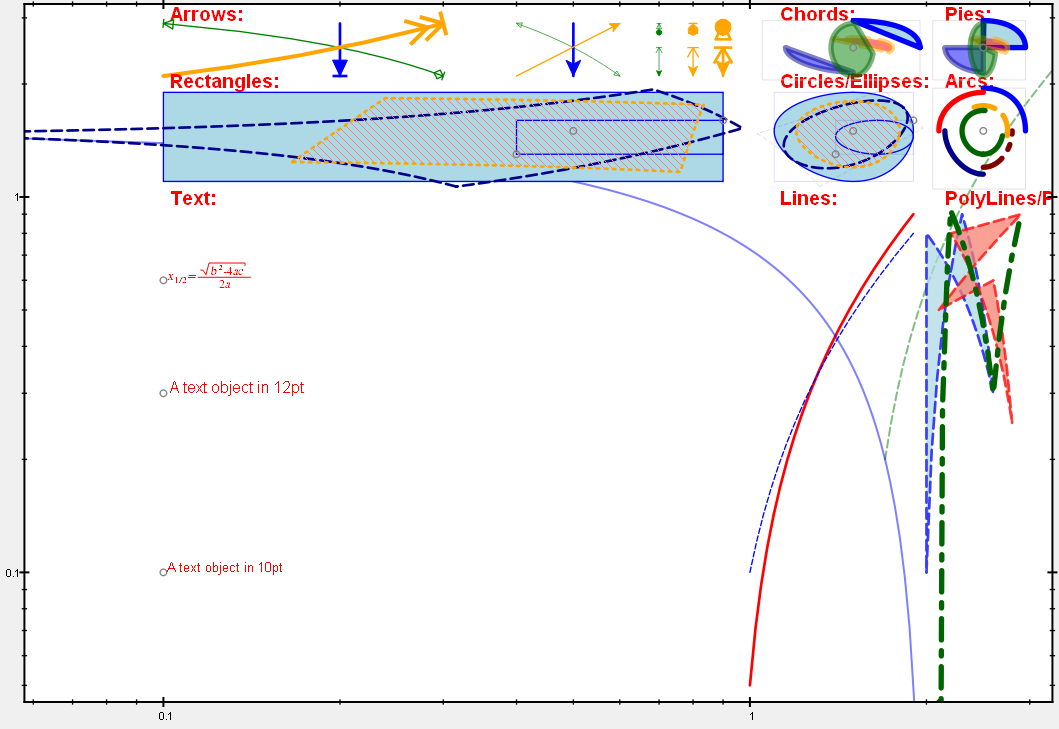
The example also adds some control-widgets that allow to change the properties of the plot, especially whether the aspect ratio is maintained and whether the axes have logarithmic scaling. This is achieved by code like this:
QWidget widMain;
QGridLayout* layMain=new QGridLayout;
widMain.setLayout(layMain);
layMain->addWidget(plot, 1,0,1,5);
layMain->setRowStretch(1,1);
QCheckBox* chk;
layMain->addWidget(chk=new QCheckBox(QObject::tr("maintain aspect ratio"), &widMain), 0, 0);
chk->setChecked(true);
QObject::connect(chk, &QCheckBox::toggled, [plot](bool checked) {
});
layMain->addWidget(chk=new QCheckBox(QObject::tr("x: log-scale"), &widMain), 0, 1);
chk->setChecked(false);
layMain->addWidget(chk=new QCheckBox(QObject::tr("y: log-scale"), &widMain), 0, 2);
chk->setChecked(false);
QComboBox* cmb;
layMain->addWidget(new QLabel(QObject::tr("DrawMode: "), &widMain), 0, 3);
layMain->addWidget(cmb=new QComboBox(&widMain), 0, 4);
cmb->addItem(QObject::tr("DrawAsGraphicElement"));
cmb->addItem(QObject::tr("DrawAsMathematicalCurve"));
cmb->setCurrentIndex(0);
QObject::connect(cmb, static_cast<void (QComboBox::*)(int)>(&QComboBox::currentIndexChanged), [plot](int index) {
for (
size_t i=0; i<plot->
getPlotter()->getGraphCount(); i++) {
if (obj) {
}
}
});
void setMaintainAspectRatio(bool value)
en-/disables the maintaining of the data aspect ratio
JKQTPHorizontalAxisBase * getXAxis(JKQTPCoordinateAxisRef axis=JKQTPPrimaryAxis)
returns the x-axis objet of the plot
void setMaintainAxisAspectRatio(bool value)
en-/disables the maintaining of the axis aspect ratio
JKQTPVerticalAxisBase * getYAxis(JKQTPCoordinateAxisRef axis=JKQTPPrimaryAxis)
returns the y-axis objet of the plot
void setLogAxis(bool __value)
indicates whether the y axis has a logarithmic scale
this is the virtual base class of all JKQTPPlotElement's in a JKQTPlotter plot that represent geometr...
Definition jkqtpgraphsbase.h:491
@ DrawAsMathematicalCurve
draw lines as the mathematically correct curve
Definition jkqtpgraphsbase.h:498
@ DrawAsGraphicElement
draw lines as lines (i.e. graphic elements)
Definition jkqtpgraphsbase.h:497
void setDrawMode(DrawMode mode)
indicated whether to draw lines as graphic elements (even on non-linear coordinate systems),...
plotter widget for scientific plots (uses JKQTBasePlotter to do the actual drawing)
Definition jkqtplotter.h:374
JKQTBasePlotter * getPlotter()
returns the JKQTBasePlotter object internally used for plotting
Definition jkqtplotter.h:414
void redrawPlot()
update the plot and the overlays