JKQTPlotter trunk/v5.0.0
an extensive Qt5+Qt6 Plotter framework (including a feature-richt plotter widget, a speed-optimized, but limited variant and a LaTeX equation renderer!), written fully in C/C++ and without external dependencies
Loading...
Searching...
No Matches
Example (JKQTPlotter): Very simple scatter-graph

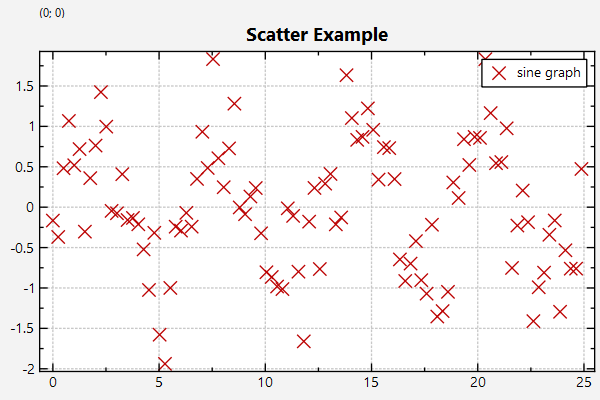
This project (see ./examples/scatter/) simply creates a JKQTPlotter widget (as a new window) and adds a single scatter graph of type JKQTPXYScatterGraph (a sine-wave with noise).

The source code of the example can be found in jkqtplotter_scatter.cpp.

First we create a plotter window and get a pointer to the internal datastore (for convenience):

This class manages data columns (with entries of type double ), used by JKQTPlotter/JKQTBasePlotter t...
Definition jkqtpdatastorage.h:282
plotter widget for scientific plots (uses JKQTBasePlotter to do the actual drawing)
Definition jkqtplotter.h:364
JKQTPDatastore * getDatastore()
returns a pointer to the datastore used by this object
Definition jkqtplotter.h:611

Now we add two columns to the JKQTPDatastore and obtain back-inserter iterators for these:

size_t columnX=ds->addColumn("x");
auto colXInserter=ds->backInserter(columnX);
size_t columnY=ds->addColumn("y");
auto colYInserter=ds->backInserter(columnY);
JKQTPColumnBackInserter backInserter(int i)
returns a back-inserter iterator (JKQTPColumnBackInserter) to the i -th column in the JKQTPDatastore
size_t addColumn(JKQTPColumn col)
add a new column to the datastore and return its ID

Now we create data for a simple plot (a sine curve with random noise):

std::default_random_engine generator;
std::normal_distribution<double> distribution(0,0.5);
const int Ndata=100;
for (int i=0; i<Ndata; i++) {
// put data
const double x=double(i)/double(Ndata)*8.0*JKQTPSTATISTICS_PI;
*colXInserter=x;
*colYInserter=sin(x)+distribution(generator);
// advance back-inserters
colXInserter++;
colYInserter++;
}
#define JKQTPSTATISTICS_PI
Definition jkqtpmathtools.h:52

Here we create a graph in the plot, which plots the dataset X/Y:

graph1->setXColumn(columnX);
graph1->setYColumn(columnY);
graph1->setTitle(QObject::tr("sine graph"));
virtual void setTitle(const QString &__value)
sets the title of the plot (for display in key!).
void setYColumn(int __value)
the column that contains the y-component of the datapoints
void setXColumn(int __value)
the column that contains the x-component of the datapoints
This implements xy scatter plots. This also alows to draw symbols at the data points.
Definition jkqtpscatter.h:59

Now we add the graph to the plot, so it is actually displayed:

plot.addGraph(graph1);
void addGraph(JKQTPPlotElement *gr)
Definition jkqtplotter.h:784

Finally we autoscale the plot so the graph is contained:

plot.zoomToFit();
void zoomToFit(bool zoomX=true, bool zoomY=true, bool includeX0=false, bool includeY0=false, double scaleX=1.05, double scaleY=1.05)
this method zooms the graph so that all plotted datapoints are visible.
Definition jkqtplotter.h:1039

The result looks like this:

jkqtplotter_scatter