|
JKQTPlotter trunk/v5.0.0
an extensive Qt5+Qt6 Plotter framework (including a feature-richt plotter widget, a speed-optimized, but limited variant and a LaTeX equation renderer!), written fully in C/C++ and without external dependencies
|
|
JKQTPlotter trunk/v5.0.0
an extensive Qt5+Qt6 Plotter framework (including a feature-richt plotter widget, a speed-optimized, but limited variant and a LaTeX equation renderer!), written fully in C/C++ and without external dependencies
|
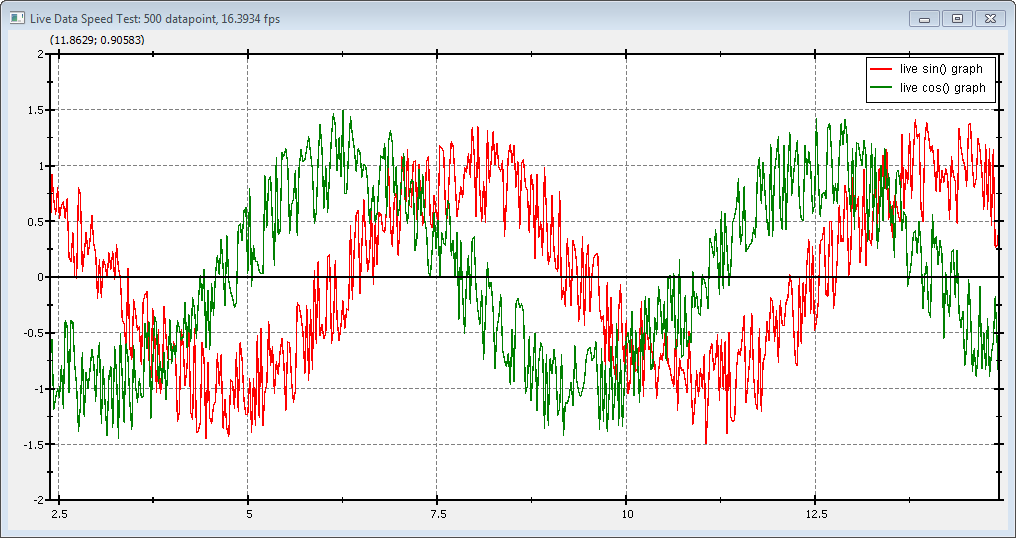
This project (see ./examples/speed/) creates a JKQTPlotter widget (as a new window) withs two line-graph (a sine and a cosine wave with a random disturbance). It constantly changes the data (a bit) and redraws the plot. The redraw-rate is measured and displayed at the top of the window. Also the example offers several context-menu entries to alter the plot and thus experiment with different factors that affect the actuak plot speed.
Here follows a basic description of the eample's code. Note however that the actual code is more involved and this description is mostly to give you a first clue, what is going on.
Data is stored in two std::array<double, NDATA> objects (X, Y, and Y2) and the data is added as external pointer to the datastore:
The datastore then uses the data from the std::array instances, i.e. just references the memory managed by the std::arrayss.
For this example we also don't use axis autoscaling, but set the axes explicitly:
Finally a slot is started with a one-shot timer. In that slot, the data is shifted one place to the left and the graph is updated. The slot also calculated the current framerate and displays it in the window title. Finally a single-shot timer with 1ms delay is used to call the slot again (i.e. continuously):
The result looks like this:
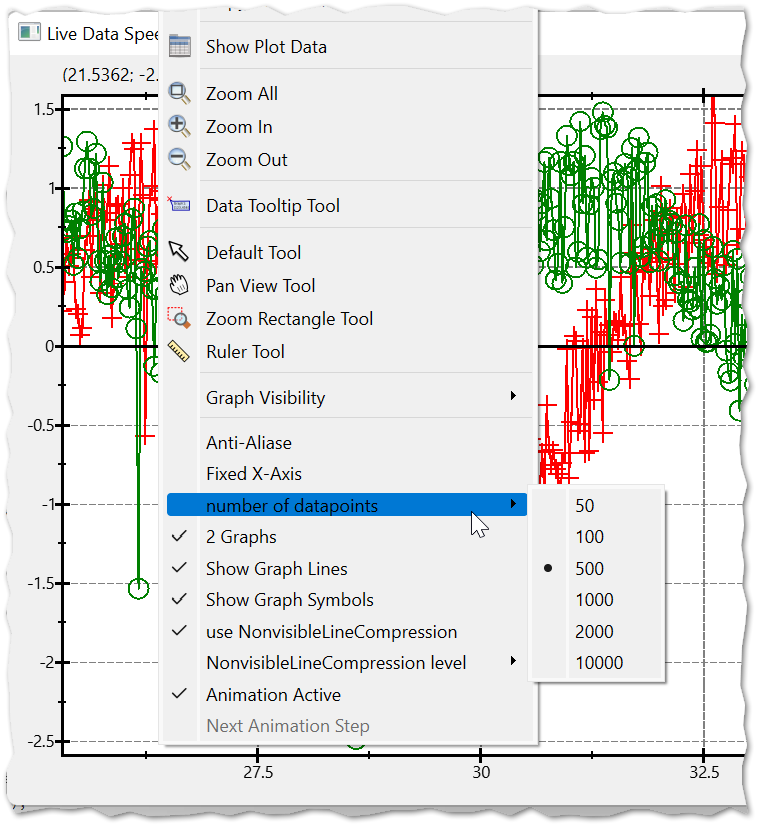
There are different factors affecting the replot speed:
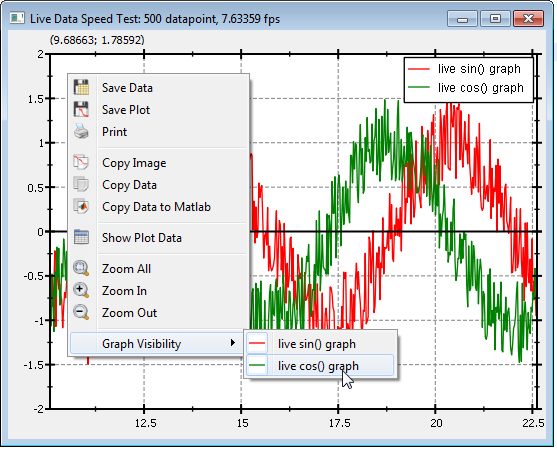
You can change all these properties by additional context-menu actions in this test-program.
Running this test on a modern AMD Ryzen 7 5800H laptop (eaxct conditions: Qt 6.2.4, 64-bit, MinGW, Release, AMD Ryzen 3600, Win11, high-res display) for two graphs with 500 datapoints each yields:
| Graph Style | Anti-Aliasing | Fixed X-Axis | frame rate [fps] |
|---|---|---|---|
| lines+symbols | yes | no | 20 |
| lines+symbols | yes | yes | 40 |
| lines+symbols | no | no | 50 |
| lines+symbols | no | yes | 95 |
| lines-only | yes | no | 30 |
| lines-only | yes | yes | 65 |
| lines-only | no | no | 78 |
| lines-only | no | yes | 140 |
Since 5.0.0 JKQTPlotter supports a line-compression algorithm (see JKQTPSimplifyPolyLines()). This allows to also draw very large datasets with sub-linear speed-decrease. The algorithm tries to not draw lines that are not visible, because they overlay each other. Using this mode we obtain these framerates for a two line-only graphs without anti-aliasing and with fixed x-axis:
| Number of Points | frame rate [fps] |
|---|---|
| 500 | 67 |
| 1000 | 42 |
| 2000 | 23 |
| 10000 | 11 |