This project (see second_axis shows how to plot with multiple axes.
The source code of the main application is (see second_axis.cpp.
In the code we take these step to set up a plot with two secondary axes and three graphs:
1./2. create a plotter and create columns with different dataset:
This class manages data columns (with entries of type double ), used by JKQTPlotter/JKQTBasePlotter t...
Definition jkqtpdatastorage.h:223
size_t addLinearColumn(size_t rows, double start, double end, const QString &name=QString(""))
add a column to the datastore that contains rows rows with monotonely increasing value starting at st...
size_t addColumnCalculatedFromColumn(size_t otherColumn, const std::function< double(double)> &f, const QString &name=QString(""))
Definition jkqtpdatastorage.h:1256
- create a second y-axis and set its formating options, so it only draws an axis on the right
plot.getYAxis(yAxisRef2)->setDrawGrid(false);
plot.getYAxis(yAxisRef2)->setShowZeroAxis(false);
implements a vertical axis for use as primary, secondary, ... axis of a JKQTPBasePlotter,...
Definition jkqtpcoordinateaxes.h:1032
@ JKQTPPrimaryAxis
Definition jkqtpcoordinateaxes.h:43
@ JKQTPCADMcomplete
draw axis withline, ticks, ticklabels and axis label
Definition jkqtptools.h:421
@ JKQTPCADMnone
draw no axis
Definition jkqtptools.h:420
... and create third y-axis
plot.getYAxis(yAxisRef3)->setDrawGrid(false);
plot.getYAxis(yAxisRef3)->setShowZeroAxis(false);
... and a fourth y-axis (on the primary side)
plot.getYAxis(yAxisRef4)->setDrawGrid(false);
plot.getYAxis(yAxisRef4)->setShowZeroAxis(false);
... reformat the major y-axis, so it does not draw on the right and thus the secondary axis yAxisRef2 replaces it there. If this step is omitted, the secondary axes stack on the right of the primary.
plot.getYAxis()->setColor(graph1->getLineColor());
- create graph in the plot, which plots the dataset:
3.1 the first graph uses the default (primary) x/y-axes
plot.addGraph(graph1);
plot.getYAxis()->setAxisLabel("graph1");
virtual void setValueColumn(int __value)
sets the column used as "value" for the current graph (typically this call setXColumn(),...
virtual void setKeyColumn(int __value)
sets the column used as "key" for the current graph (typically this call setXColumn(),...
This implements xy line plots. This also alows to draw symbols at the data points.
Definition jkqtplines.h:61
3.2 the second graph uses the default (primary) x-axis, but the secondary axis yAxisRef2 as y-axis
tell graph2 to use this axis
void setYAxis(JKQTPCoordinateAxisRef ref)
indicates which coordinate axis to use for coordinate transforms in y-direction
set axis color to match graph2's color
QColor getLineColor() const
get the color of the graph line
set axis label
plot.getYAxis(yAxisRef2)->setAxisLabel("graph2");
3.3 the third graph uses the default (primary) x-axis, but the secondary axis yAxisRef3 as y-axis
plot.addGraph(graph3);
plot.getYAxis(yAxisRef3)->setAxisLabel("graph3");
3.5 the fourth graph uses the default (primary) x-axis, but the secondary axis yAxisRef4 as y-axis
plot.addGraph(graph3);
plot.getYAxis(yAxisRef4)->setAxisLabel("graph4");
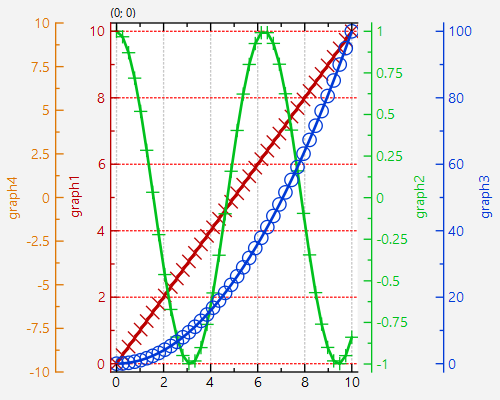
- autoscale the plot so the graph is contained. This auto-scales all axes using the graphs (and their data) as assigned to the axes, i.e.:
- all 3 graphs for x-axis,
- graph1 for primary y-axis,
- graph2 for secondary axis yAxisRef2
- graph3 for secondary axis yAxisRef3
- graph4 for secondary axis yAxisRef4
- show plotter and make it a decent size
plot.setWindowTitle(title);
plot.show();
plot.resize(500,400);
The result looks like this:
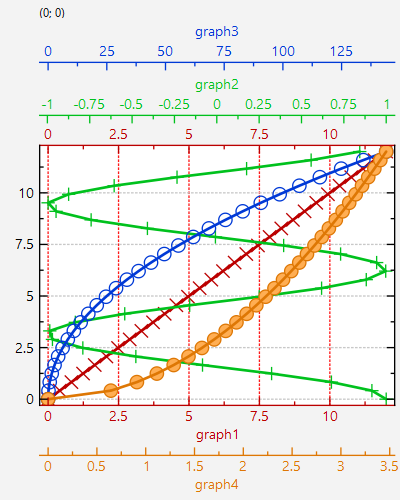
If we set seondary axes for the x-axis instead of the y-axis, i.e. use
implements a horizontal axis, based on JKQTPCoordinateAxis (for most of documentation: see JKQTPCoord...
Definition jkqtpcoordinateaxes.h:1221
we get a plot like this: