graph1->
setTitle(QObject::tr(
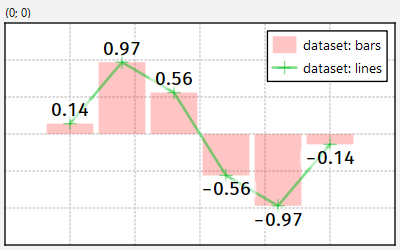
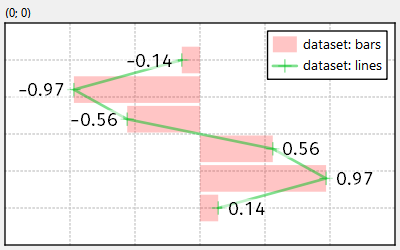
"dataset: bars"));
graph2->
setTitle(QObject::tr(
"dataset: lines"));
void setBarHeightColumn(int column)
returns xColumn or yColumn, whichever is used for the height of the bars (depending on whether the ba...
virtual void setColor(QColor c)
set outline and fill color at the same time
void setBarPositionColumn(int column)
returns xColumn or yColumn, whichever is used for the position of the bars (depending on whether the ...
This implements a vertical bar graph with bars between and .
Definition jkqtpbarchart.h:51
This class manages data columns (with entries of type double ), used by JKQTPlotter/JKQTBasePlotter t...
Definition jkqtpdatastorage.h:223
size_t addLinearColumn(size_t rows, double start, double end, const QString &name=QString(""))
add a column to the datastore that contains rows rows with monotonely increasing value starting at st...
size_t addCalculatedColumnFromColumn(size_t otherColumn, const std::function< double(double)> &f, const QString &name=QString(""))
add a column with the same number of entries, as in the other column otherColumn ,...
QColor getFillColor() const
set the color of the graph filling
QColor getLineColor() const
get the color of the graph line
void setTextFontSize(double __value)
set the base font size of text
void setLabelPosition(JKQTPGraphLabelPosition r)
position of the label
virtual void setTitle(const QString &__value)
sets the title of the plot (for display in key!).
void setYColumn(int __value)
the column that contains the y-component of the datapoints
void setXColumn(int __value)
the column that contains the x-component of the datapoints
int getXColumn() const
the column that contains the x-component of the datapoints
int getYColumn() const
the column that contains the y-component of the datapoints
This graph plots a series of data labels. This can be used to add number-labels to e....
Definition jkqtpgraphlabels.h:103
@ YValueLabel
generates a label with the y-coordinate only, calls setDefaultYLabelGenerator()
Definition jkqtpgraphlabels.h:108
This implements xy line plots. This also alows to draw symbols at the data points.
Definition jkqtplines.h:61
void setColor(QColor c)
set color of line and symbol
plotter widget for scientific plots (uses JKQTBasePlotter to do the actual drawing)
Definition jkqtplotter.h:374
size_t addGraph(JKQTPPlotElement *gr)
Definition jkqtplotter.h:796
JKQTPDatastore * getDatastore()
returns a pointer to the datastore used by this object
Definition jkqtplotter.h:621
@ JKQTPGLabelAwayFromXAxis
all labels pointing away from the x-axis
Definition jkqtpgraphlabelstylemixin.h:50
QColor QColorWithAlphaF(const QColor &color, qreal alphaF)
construct a QColor, based on the given color, but with alpha set to the specified value alphaF
Definition jkqtptools.h:366