graph1->
setTitle(QObject::tr(
"JKQTPErrorBars"));
graph2->
setTitle(QObject::tr(
"JKQTPErrorPolygons"));
graph3->
setTitle(QObject::tr(
"JKQTPErrorLines"));
plot.setWindowTitle(title);
plot.show();
plot.resize(400,400);
void setKeyPosition(const JKQTPKeyPosition &__value)
key position inside or besides the plot area, see JKQTPKeyPositions for details and examples
This class manages data columns (with entries of type double ), used by JKQTPlotter/JKQTBasePlotter t...
Definition jkqtpdatastorage.h:223
size_t addLinearColumn(size_t rows, double start, double end, const QString &name=QString(""))
add a column to the datastore that contains rows rows with monotonely increasing value starting at st...
size_t addColumnCalculatedFromColumn(size_t otherColumn, const std::function< double(double)> &f, const QString &name=QString(""))
Definition jkqtpdatastorage.h:1256
This implements filled curve plots with y errors where the area is filled between the plot line and t...
Definition jkqtpfilledcurve.h:131
void setValueErrorStyle(JKQTPErrorPlotstyle __value)
how to draw the errors (if available) of the x-value
Definition jkqtpfilledcurve.h:164
void setValueErrorColumn(int __value)
the column that contains the error of the x-component of the datapoints
Definition jkqtpfilledcurve.h:172
virtual void setTitle(const QString &__value)
sets the title of the plot (for display in key!).
virtual void setValueColumn(int __value)
sets the column used as "value" for the current graph (typically this call setXColumn(),...
virtual void setKeyColumn(int __value)
sets the column used as "key" for the current graph (typically this call setXColumn(),...
plotter widget for scientific plots (uses JKQTBasePlotter to do the actual drawing)
Definition jkqtplotter.h:374
void zoomToFit(bool zoomX=true, bool zoomY=true, bool includeX0=false, bool includeY0=false, double scaleX=1.05, double scaleY=1.05)
this method zooms the graph so that all plotted datapoints are visible.
Definition jkqtplotter.h:1051
JKQTBasePlotter * getPlotter()
returns the JKQTBasePlotter object internally used for plotting
Definition jkqtplotter.h:414
size_t addGraph(JKQTPPlotElement *gr)
Definition jkqtplotter.h:796
JKQTPDatastore * getDatastore()
returns a pointer to the datastore used by this object
Definition jkqtplotter.h:621
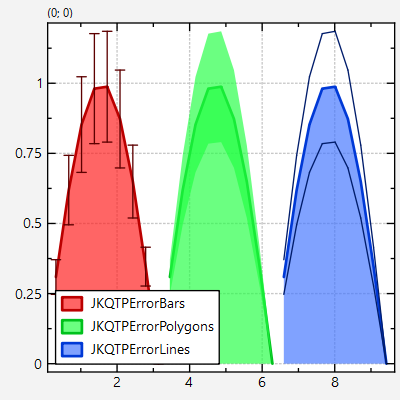
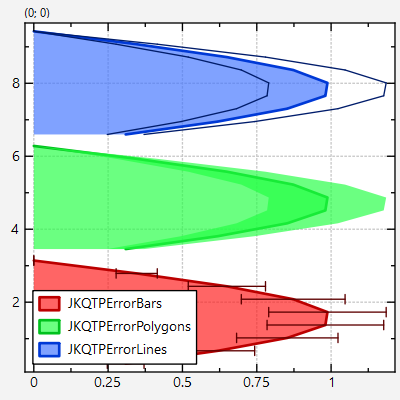
@ JKQTPErrorLines
a second and third graph line above and below the actual data which indicates the error value
Definition jkqtptools.h:696
@ JKQTPErrorPolygons
line error lines, but with filled range in between
Definition jkqtptools.h:697
@ JKQTPErrorBars
error bars for each data point
Definition jkqtptools.h:713
@ JKQTPKeyInsideBottomLeft
the key is positioned inside on the bottom-left
Definition jkqtptools.h:587