plot.setWindowTitle(title);
plot.show();
plot.resize(400,400);
This is a base-class for all bar graphs with vertical or horizontal orientation (the orientation is i...
Definition jkqtpbarchartbase.h:152
JKQTPGraphFillStyleMixin & fillStyleBelow()
if m_fillMode ==FillAboveAndBelowDifferently then this fill style is used below the baseline and the ...
void setFillMode(JKQTPBarGraphBase::FillMode mode)
specifies how the area of the graph is filles
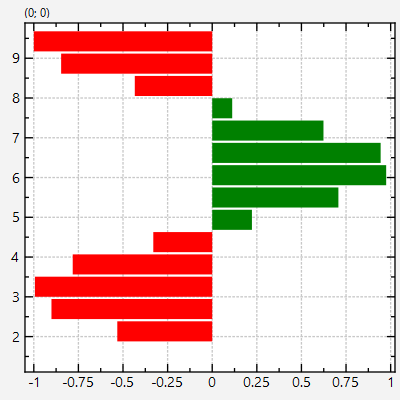
@ TwoColorFilling
the area above and below baseline with the two different colors/pattern
Definition jkqtpbarchartbase.h:174
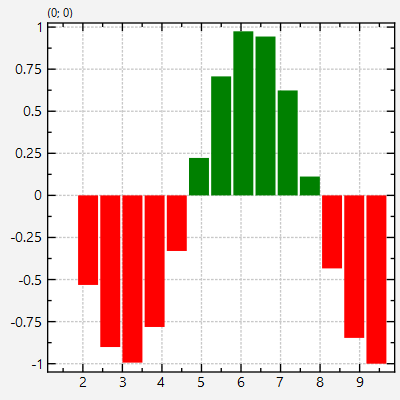
This implements a vertical bar graph with bars between and .
Definition jkqtpbarchart.h:51
This class manages data columns (with entries of type double ), used by JKQTPlotter/JKQTBasePlotter t...
Definition jkqtpdatastorage.h:282
size_t addLinearColumn(size_t rows, double start, double end, const QString &name=QString(""))
add a column to the datastore that contains rows rows with monotonely increasing value starting at st...
size_t addColumnCalculatedFromColumn(size_t otherColumn, const std::function< double(double)> &f, const QString &name=QString(""))
Definition jkqtpdatastorage.h:1333
void setFillColor(const QColor &__value)
set the color of the graph filling
virtual void setValueColumn(int __value)
sets the column used as "value" for the current graph (typically this call setXColumn(),...
virtual void setKeyColumn(int __value)
sets the column used as "key" for the current graph (typically this call setXColumn(),...
plotter widget for scientific plots (uses JKQTBasePlotter to do the actual drawing)
Definition jkqtplotter.h:364
void zoomToFit(bool zoomX=true, bool zoomY=true, bool includeX0=false, bool includeY0=false, double scaleX=1.05, double scaleY=1.05)
this method zooms the graph so that all plotted datapoints are visible.
Definition jkqtplotter.h:1039
void addGraph(JKQTPPlotElement *gr)
Definition jkqtplotter.h:784
JKQTPDatastore * getDatastore()
returns a pointer to the datastore used by this object
Definition jkqtplotter.h:611