JKQTPlotter trunk/v5.0.0
an extensive Qt5+Qt6 Plotter framework (including a feature-richt plotter widget, a speed-optimized, but limited variant and a LaTeX equation renderer!), written fully in C/C++ and without external dependencies
Loading...
Searching...
No Matches
Example (JKQTPlotter): Simple barchart

This project (see barchart simply creates a JKQTPlotter widget (as a new window) and adds several barcharts. They are ordered in groups.

The source code of the main application is (see barchart.cpp:

#include <QApplication>
#include "jkqtplotter/jkqtplotter.h"
#include "jkqtplotter/graphs/jkqtpbarchart.h"
#define Ndata 5
int main(int argc, char* argv[])
{
QApplication app(argc, argv);
// 1. create a plotter window and get a pointer to the internal datastore (for convenience)
plot.getPlotter()->setUseAntiAliasingForGraphs(true); // nicer (but slower) plotting
plot.getPlotter()->setUseAntiAliasingForSystem(true); // nicer (but slower) plotting
plot.getPlotter()->setUseAntiAliasingForText(true); // nicer (but slower) text rendering
// 2. now we create data for three simple barchart
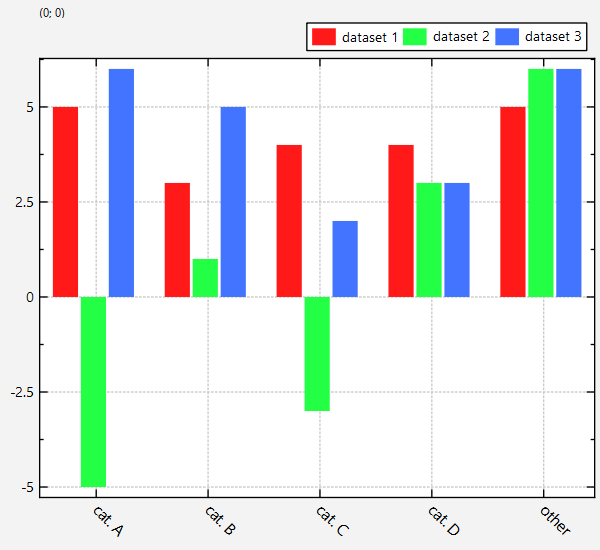
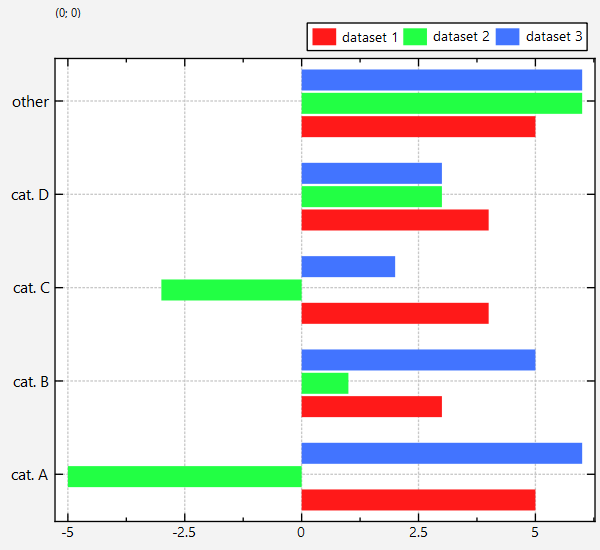
QString L[Ndata]={ "cat. A", "cat. B", "cat. C", "cat. D", "other"};
double X[Ndata]={ 1, 2, 3, 4, 5};
double Y1[Ndata]={ 5, 4, 3, 4, 5};
double Y2[Ndata]={ -5, -3, 1, 3, 6};
double Y3[Ndata]={ 6, 2, 5, 3, 6};
// 3. make data available to JKQTPlotter by adding it to the internal datastore.
// Note: In this step the data is copied (of not specified otherwise)
// the variables columnX and columnY... will contain the internal column ID of the
// newly created columns with names "x" and "y..." and the (copied) data from X
// and Y...
size_t columnX=ds->addCopiedColumn(X, Ndata, "x");
size_t columnY1=ds->addCopiedColumn(Y1, Ndata, "y1");
size_t columnY2=ds->addCopiedColumn(Y2, Ndata, "y2");
size_t columnY3=ds->addCopiedColumn(Y3, Ndata, "y3");
// 4. create graphs in the plot, which plots the dataset X/Y1, X/Y2 and X/Y3:
graph1->setXColumn(columnX);
graph1->setYColumn(columnY1);
graph1->setTitle(QObject::tr("dataset 1"));
graph2->setXColumn(columnX);
graph2->setYColumn(columnY2);
graph2->setTitle(QObject::tr("dataset 2"));
graph3->setXColumn(columnX);
graph3->setYColumn(columnY3);
graph3->setTitle(QObject::tr("dataset 3"));
// 5. add the graphs to the plot, so it is actually displayed
plot.addGraph(graph1);
plot.addGraph(graph2);
plot.addGraph(graph3);
// 6. now we set the graphs, so they are plotted side-by-side
// This function searches all JKQTPBarVerticalGraph in the current
// plot and sets their shift/scale so they form a nice plot with
// side-by-side groups
graph1->autoscaleBarWidthAndShift(0.75, 1);
// 7. data is grouped into 5 numbere groups (1..5), but we also have string
// labels for these groups (stored in L). In order to display these labels,
// we have to tell the x-Axis to use these special labels:
plot.getXAxis()->addAxisTickLabels(X, L, Ndata);
// also we can rotate the labels a bit (by 45 degree), so they fit better
// 8. finally we move the plot key/legend to the outside, top-right
// and lay it out as a single row
// NOTE: plot is a descendent of QWidget, which uses an internal object of
// type JKQTBasePlotter, which does the actual plotting.
// So many properties of the plot are only available in this internal
// object, which you can access by plot.getPlotter().
plot.getPlotter()->setKeyLayout(JKQTPKeyLayoutOneRow);
// 9 autoscale the plot so the graph is contained
plot.zoomToFit();
// show plotter and make it a decent size
plot.show();
plot.resize(600,400);
return app.exec();
}
void setUseAntiAliasingForSystem(bool __value)
specifies whether to use antialiasing for plotting the coordinate system
void setUseAntiAliasingForGraphs(bool __value)
specifies whether to use antialiasing for plotting the graphs
void setKeyPosition(const JKQTPKeyPosition &__value)
key position inside or besides the plot area, see JKQTPKeyPositions for details and examples
void setUseAntiAliasingForText(bool __value)
specifies whether to use antialiasing when drawing any text
virtual void autoscaleBarWidthAndShift(double maxWidth=0.75, double shrinkFactor=0.9)
finds all bar charts of the same orientation and determines width and shift, so they stand side by si...
This implements a vertical bar graph with bars between and .
Definition jkqtpbarchart.h:51
void setTickLabelAngle(double __value)
rotation angle of tick labels [-180..180], i.e. given in degrees, default is 0 (horizontal)
void addAxisTickLabels(const QVector< double > &x, const QStringList &label)
add a new tick label to the axis
void setTickLabelFontSize(double __value)
fontsize of the axis tick labels
This class manages data columns (with entries of type double ), used by JKQTPlotter/JKQTBasePlotter t...
Definition jkqtpdatastorage.h:282
size_t addCopiedColumn(TIterator first, TIterator last, const QString &name=QString(""))
add one column to the datastore. It will be filled with the values from first ... last
Definition jkqtpdatastorage.h:871
virtual void setTitle(const QString &__value)
sets the title of the plot (for display in key!).
void setYColumn(int __value)
the column that contains the y-component of the datapoints
void setXColumn(int __value)
the column that contains the x-component of the datapoints
plotter widget for scientific plots (uses JKQTBasePlotter to do the actual drawing)
Definition jkqtplotter.h:364
void zoomToFit(bool zoomX=true, bool zoomY=true, bool includeX0=false, bool includeY0=false, double scaleX=1.05, double scaleY=1.05)
this method zooms the graph so that all plotted datapoints are visible.
Definition jkqtplotter.h:1039
JKQTBasePlotter * getPlotter()
returns the JKQTBasePlotter object internally used for plotting
Definition jkqtplotter.h:404
void addGraph(JKQTPPlotElement *gr)
Definition jkqtplotter.h:784
JKQTPDatastore * getDatastore()
returns a pointer to the datastore used by this object
Definition jkqtplotter.h:611
JKQTPHorizontalAxisBase * getXAxis(JKQTPCoordinateAxisRef axis=JKQTPPrimaryAxis)
returns the x-axis objet of the plot
Definition jkqtplotter.h:711
@ JKQTPKeyLayoutOneRow
the key consists of one row. This may overflow the available space, use JKQTPKeyLayoutMultiColumn or ...
Definition jkqtptools.h:637
@ JKQTPKeyOutsideTopRight
the key is positioned above the graph, on the right
Definition jkqtptools.h:557

Note: Here we use the functions JKQTPBarVerticalGraph::setXColumn() and JKQTPBarVerticalGraph::setYColumn() to set the columns to use for the stack positions (X) and heights (Y). Instead you can also use the semantic version JKQTPBarGraphBase::setBarPositionColumn() and JKQTPBarGraphBase::setBarHeightColumn().

The result looks like this:

barchart

In order to draw horizontal error bars, you have to use JKQTPBarHorizontalGraph instead of JKQTPBarVerticalGraph:

barchart