JKQTPlotter trunk/v5.0.0
an extensive Qt5+Qt6 Plotter framework (including a feature-richt plotter widget, a speed-optimized, but limited variant and a LaTeX equation renderer!), written fully in C/C++ and without external dependencies
Loading...
Searching...
No Matches
Example (JKQTPlotter): Vector Field Plot Example

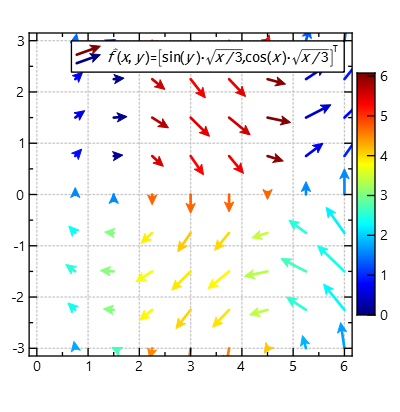
This project (see paramvectorfield demonstrates the use of JKQTPParametrizedVectorFieldGraph to visualize a vector field with additional information encoded in the color of the vectors.

The source code of the main application is (see paramvectorfield.cpp.

Here is a short summary of the important parts of the code:

// 1. setup a plotter window and get a pointer to the internal datastore (for convenience)
// 2. make up some arbitrary data to be used for plotting
// this generates a 2D grid of x/y-coordinates and then calculates dx=cos(y)*sqrt(x/3.0) and dy=sin(x)*sqrt(x/3.0)
const auto columnXY=ds->addLinearGridColumns(NX, 0, 6, NY, -3, 3,"x","y");
const auto columnDX=ds->addCalculatedColumnFromColumn(columnXY.first, columnXY.second, [](double x,double y) { return sin(y)*sqrt(x/3.0); });
const auto columnDY=ds->addCalculatedColumnFromColumn(columnXY.first, columnXY.second, [](double x,double y) { return cos(x)*sqrt(x/3.0); });
// now we also calulate a column that encodes some other information that can be color-coded
const auto columnC=ds->addCalculatedColumnFromColumn(columnXY.first, columnXY.second, [](double x,double y) { return sqrt(fabs(y)); });
// 3. create JKQTPVectorFieldGraph to display the data:
graph1->setXYColumns(columnXY);
graph1->setDxColumn(columnDX);
graph1->setDyColumn(columnDY);
graph1->setColorColumn(columnC);
graph1->setTitle(QObject::tr("$\\vec{f}(x,y)=\\bigl[\\sin(y)\\cdot\\sqrt{x/3}, \\cos(x)\\cdot\\sqrt{x/3}\\bigr]^\\mathrm{T}$"));
// 4. add the graphs to the plot, so it is actually displayed
plot.addGraph(graph1);
This class manages data columns (with entries of type double ), used by JKQTPlotter/JKQTBasePlotter t...
Definition jkqtpdatastorage.h:282
std::pair< size_t, size_t > addLinearGridColumns(size_t width, double startX, double endX, size_t height, double startY, double endY, const QString &nameX=QString(""), const QString &nameY=QString(""))
add two columns to the datastore that contains the x- and y- coordinates of a rectangular grid with w...
size_t addCalculatedColumnFromColumn(size_t otherColumn, const std::function< double(double)> &f, const QString &name=QString(""))
add a column with the same number of entries, as in the other column otherColumn ,...
This graph plots a vector field, i.e. a set of vectors (dx,dy) or (angle,length) at positions (x,...
Definition jkqtpvectorfield.h:286
void setColorColumn(int __value)
this column contains the symbol color
virtual void setTitle(const QString &__value)
sets the title of the plot (for display in key!).
void setDyColumn(int col)
the column that contains the delta along the y-axis.
void setDxColumn(int col)
the column that contains the delta along the x-axis.
void setXYColumns(size_t xCol, size_t yCol)
sets xColumn and yColumn at the same time
plotter widget for scientific plots (uses JKQTBasePlotter to do the actual drawing)
Definition jkqtplotter.h:364
void addGraph(JKQTPPlotElement *gr)
Definition jkqtplotter.h:784
JKQTPDatastore * getDatastore()
returns a pointer to the datastore used by this object
Definition jkqtplotter.h:611

The result looks like this:

paramvectorfield

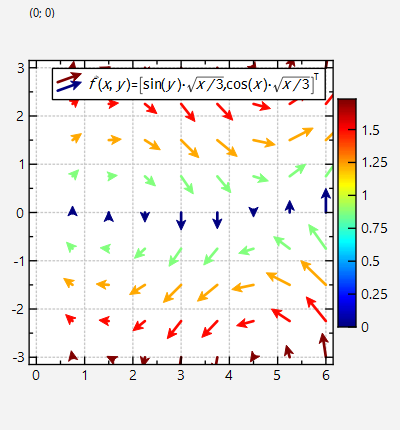
By default, the color of the drawn vector is determined from the color column provided to the graph object. But you can also choose to not provide a color column and instead set

void setVectorColorMode(VectorColorMode __value)
indicates how color is determined from data (either from the vector or from m_colorColumn)
@ ColorFromMagnitude
color-coding by vector magnitude/length
Definition jkqtpvectorfield.h:292

Now the color encodes the actual length (or magnitude) of the vectors:
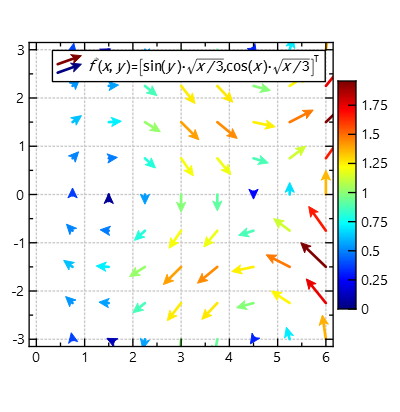
paramvectorfield

Alternatively

@ ColorFromAngle
color-coding by vector angle
Definition jkqtpvectorfield.h:293

will color-encode the rotation angle (in radians, 3 o'clock is 0rad) of the vectors:

paramvectorfield